

U.S. Census Bureau: Uninsured rate dropped to lowest ever in 2022...ahead of #MedicaidUnwinding
Thu, 09/14/2023 - 4:49pm
Yesterday the U.S. Census Bureau published new reports on Income, Poverty and Health Insurance Coverage in the United States as of 2022. Obviously all three of these are extremely important and interact closely with each other, but given that my focus is healthcare policy, I'm going to stick with the health insurance coverage portion.
According to the 2023 Current Population Survey Annual Social & Economic Supplement (CPS ASEC):
...92.1% of the U.S. population had health insurance coverage for all or part of 2022 (compared to 91.7% in 2021). An estimated 25.9 million or 7.9% of people did not have health insurance at any point during 2022, according to the 2023 Current Population Survey Annual Social and Economic Supplement (CPS ASEC). That compares to 27.2 million or 8.3% of people who did not have health insurance at any point during 2021.
...People are considered to be insured if they were covered by any type of health insurance for part or all of the previous calendar year. People are considered uninsured if, for the entire year, they were not covered by any type of insurance. Among the findings:
- More people were insured in 2022 than 2021. In 2022, 92.1% of people, or 304.0 million, had health insurance at some point during the year, representing an increase in the insured rate and number of insured from 2021 (91.7% or 300.9 million).
- In 2022, private health insurance coverage continued to be more prevalent than public coverage, at 65.6% and 36.1%, respectively. Some people may have more than one coverage type during the calendar year.
- Of the more common subtypes of health insurance coverage, employment-based insurance was the most prevalent, covering 54.5% of the population for some or all of the calendar year, followed by Medicaid (18.8%), Medicare (18.7%), and direct-purchase coverage (9.9%).
- Between 2021 and 2022, the rate of Medicare coverage increased by 0.3 percentage points to cover 18.7% of people. This increase was in part due to growth in the number of people age 65 and older.
- The uninsured rate among working-age adults ages 19 to 64 decreased 0.8 percentage points to 10.8% between 2021 and 2022, driven in part by a decrease in uninsured rates for workers.
Regional estimates are available for income, poverty and health insurance coverage in each respective report. There is also a table showing state-level poverty rates using three-year averages.
The CPS ASEC is subject to sampling and nonsampling errors. All comparisons made here and in each respective report have been tested and found to be statistically significant at the 90% confidence level, unless otherwise noted.
The healthcare coverage report itself has some interesting tidbits beyond the 2022 data itself. For instance, in the introductory "What is Health Insurance Coverage?" section, there were a couple of "official definition" surprises:
Health insurance coverage in the Current Population Survey Annual Social and Economic Supplement (CPS ASEC) refers to comprehensive coverage at any time during the calendar year for the civilian, noninstitutionalized population of the United States.* For reporting purposes, the U.S. Census Bureau broadly classifies health insurance coverage as private insurance or public insurance.
Private Coverage
- ...TRICARE: Coverage through TRICARE, formerly known as Civilian Health and Medical Program of the Uniformed Services.
Public Coverage
- ...Medicaid: This report uses the term Medicaid to include the specific Medicaid government program and other programs for low-income individuals administered by the states such as Children’s Health Insurance Program (CHIP) and Basic Health Programs.
- VA and CHAMPVA: Care provided by the Department of Veterans Affairs, the military, and the Civilian Health and Medical Program of the Department of Veterans Affairs.
Additionally, people are considered uninsured if they only had coverage through the Indian Health Service (IHS), as IHS coverage is not considered comprehensive.
I already wrote a separate blog post regarding the Indian Health Service (IHS) bullet, but there's two other interesting things I learned from this:
- TRICARE is considered to be private health insurance coverage even though Veterans Administration healthcare is very much public coverage...and even though the ~9.6 million Americans enrolled in TRICARE and the VA are generally the same people:
Does VA participate in the TRICARE Network?
- Yes, since 1995, all VA health care facilities have participated as TRICARE Network Providers.
- VA can provide care for Active Duty Service Members, military retirees, & family members under their TRICARE benefit - on a space available basis.
- Each VA health care facility can serve as primary care manager for TRICARE beneficiaries, but more often TRICARE referrals are used for specialty care.
- ACA Basic Health Program (BHP) enrollment is apparently lumped in under Medicaid as is the Children's Health Insurance Program (CHIP)...even though BHP enrollees aren't included in official Medicaid enrollment reports to my knowledge (CHIP enrollees are given their own listing, however). I've long griped about BHP enrollees (around 1.2 million strong) never being mentioned in official ACA exchange enrollment reports either...which means apparently these people aren't counted at all as part of either ACA or Medicaid reports? Huh.
In any event, one more takeaway in addition to those already listed above):
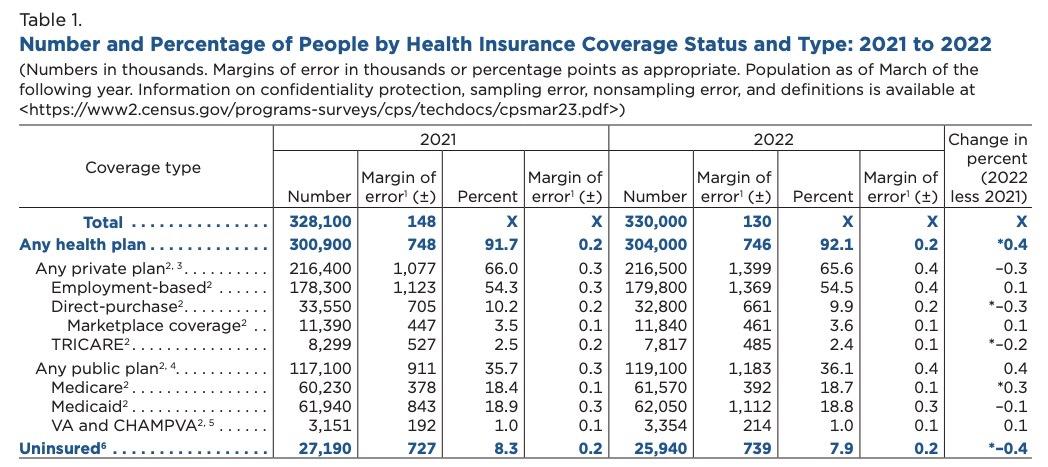
Of the subtypes of health insurance coverage, employment-based insurance was the most common, covering 54.5 percent of the population for some or all of the calendar year, followed by Medicaid (18.8 percent), Medicare (18.7 percent), direct-purchase coverage (9.9 percent), TRICARE (2.4 percent), and VA and CHAMPVA coverage (1.0 percent) (Table 1 and Figure 1).
Now I'm a bit confused, as the first table puts TRICARE enrollment at ~7.8 million and VA/CHAMPVA enrollment at ~3.3 million. Huh. I guess I'll have to modify the Psychedelic Donut again.
In any event, here's the first table breaking out the types of coverage of the entire U.S. population i n 2021 vs. 2022:
The data is, of course, broken out in several different ways: By age group, by race/ethnicity, by income bracket and so forth.
Unfortunately, most of these figures are already outdated as of September 2023 due to the Medicaid Unwinding process which began in April, and which has already resulted in over 6.4 million Americans being kicked off of Medicaid or CHIP to date (4.6 million of whom lost coverage for purely procedural/red tape reasons even though many of them are likely still eligible). Of course, a number of those folks have since gained other types of coverage, such as the ~178,000 who have enrolled in ACA exchange plans and the ~23K who have moved to BHP programs, but still.
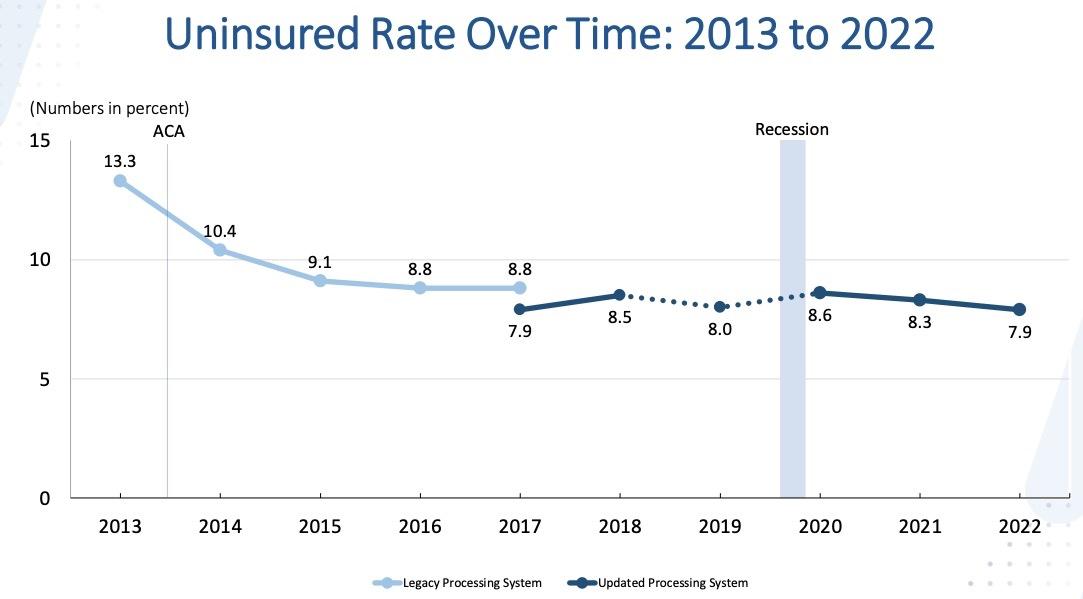
There's also some handy graphs from a slideshow presentation at the U.S. Census Bureau website. Interestingly, it appears that they overhauled & updated their methodology for defining "insured" in 2017, leading to a discrepancy that year. Using their new definition, 2022 actually only matches the lowest-ever uninsured rate of 7.9% that year. Huh.
Advertisement
