

The Psychedelic Donut Returns: Healthcare Coverage Breakout For The Entire U.S. Population In 1 Chart
Wed, 02/08/2023 - 8:47am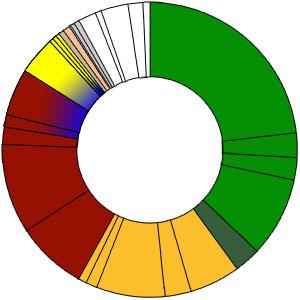
Note: Yes, I'm aware that the upcoming "unwinding" of Medicaid via the end of the Public Health Emergency provisions is about to blow this entire project up, but that's kind of the point, to see where things stand as of this moment.
Nearly 7 years ago, I compiled the best breakout I could estimate of the healthcare coverage status of the entire U.S. population, in a post (and graphic) which gained quite a bit of praise. It even (to my surprise) ended up as a finalist in the National Institute for Health Care Management (NIHCM) Digital Media Awards in 2017.
Seven years, two administrations, one federal insurrection and one global pandemic later, I figured it was time to finally update the breakout of what I've since decided to refer to as the Psychedelic Donut.
It's important to note that while most of the figures below should be accurate, up to date estimates, a few of are fairly rough, while others are a bit fuzzy because many Americans have more than one type of healthcare coverage, such as "dual-eligibles" who are enrolled in both Medicare and Medicaid, veterans who are covered by both the VA and Medicare, those who are only covered for certain services by Medicaid, and so on.
Having said that, I've done my best to account for these overlaps and to make reasonable guesstimates where necessary. I've also linked to my data sources and/or provided my reasoning for updated numbers where the original source is out of date. I've broken the total population out into 10 categories and 29 subcategories. For obvious reasons, I'm rounding each off to the nearest 100,000 people.
TOTAL U.S. POPULATION via the United States Census Bureau:
As the nation prepares to ring in the new year, the U.S. Census Bureau today projected the U.S. population will be 334,233,854 on Jan. 1, 2023. This represents an increase of 1,571,393 (0.47%) from New Year’s Day 2022, and 2,784,573 (0.84%) since Census Day (April 1) 2020.
OK, that's our starting point: 334.2 million people. Remember, this includes all 50 states, DC, Puerto Rico and the other U.S. territories like Guam, the U.S. Virgin Islands, American Samoa and the Northern Mariana Islands.
MEDICARE via the Centers for Medicare & Medicaid Services (CMS):
As of October 2022, 65,236,564 people are enrolled in Medicare. This is an increase of 132,757 since the last report.
- 35,022,974 are enrolled in Original Medicare.
- 30,213,590 are enrolled in Medicare Advantage or other health plans. This includes enrollment in Medicare Advantage plans with and without prescription drug coverage.
- 50,666,744 are enrolled in Medicare Part D. This includes enrollment in stand-alone prescription drug plans as well as Medicare Advantage plans that offer prescription drug coverage.
- Over 12 million individuals are dually eligible for Medicare and Medicaid, so are counted in the enrollment figures for both programs.
This was as of October 2022. I looked back at the historical data and found that total Medicare enrollment increased by an average of roughly 80,000 people per month throughout 2022, so it likely stood at around 65.4 million as of January 2023.
Within Medicare as a whole, I've broken it out into six subcategories based on type (Original vs. Medicare Advantage); age (65+ vs. under 65 w/disabilities); and whether or not they also have MediGap coverage (Original Medicare only).
The CMS report breaks out Original vs. Medicare Advantage. Not only has Med Advantage been gradually increasing as a percentage of total Medicare enrollment for years now, the historic data says that enrollment in Original Medicare has actually been decreasing each month. In other words, that ~80K monthly increase is actually composed of Medicare Advantage increasing by ~100K/month + Original Medicare dropping by ~20K/month.
This gives a January 2023 estimate of:
- Original Medicare: 35.0 million
- Medicare Advantage: 30.4 million
Next, we have to break each of these out by age and, for Original Medicare only, MediGap status.
The former is easy. Again, the historical data via Data.CMS.Gov breaks it out as of October at 57,408,061 age 65+, plus another ~60K/month and 7,828,053 under 65, plus another ~20K/month. As of January 2023, that would be:
- 65 and older: 57.6 million
- Under 65: 7.9 million
According to this Kaiser Family Foundation report from 2016 (using data from 2012, I'm afraid):
A smaller share of beneficiaries under age 65 with disabilities than older beneficiaries have...Medigap (2% and 17%, respectively), or are enrolled in a Medicare Advantage plan (27% and 31%, respectively).
Obviously much has changed since that point, especially with the rapid growth of Medicare Advantage as a portion of total Medicare enrollment. Overall Medicare Advantage now makes up around 46.5% of total Medicare enrollment, but I'm assuming that this percent is still a few points lower among those under 65 than among seniors. Assuming 47.1% of those 65+ and 42.2% of those under 65 gives the following breakout:
- 65+ Original: 30.5 million
- < 65 Original: 4.6 million
- 65+ Advantage: 27.1 million
- < 65 Advantage: 3.3 million
As for MediGap, that gets trickier. Again, via the Kaiser Famiily Foundation (KFF), around 34% of Original Medicare enrollees had MediGap supplemental coverage as of 2018, or twice as high a percent as in 2012. As for the tiny number of those under 65 who have Medigap:
The small share of beneficiaries under age 65 with disabilities who report having a supplemental Medigap policy may be largely due to the fact that federal law does not require insurance companies to sell Medigap policies to people under age 65, and while some states do impose this requirement, others do not.11 Insurers also may use medical underwriting in deciding whether to issue a Medigap policy to people with disabilities and how much to charge
As far as I can tell, Medigap enrollees under age 65 appear to be fewer than 100,000 people, so I'm not bothering to list them at all.
This therefore suggests the total Medicare breakout as of January 2023 to be something like:
- 65+ Original: 20.1 million
- 65+ Original + Medigap: 10.4 million
- < 65 Original: 4.5 million
- 65+ Advantage: 27.1 million
- < 65 Advantage: 3.3 million
Next up...
MEDICAID via the Centers for Medicare & Medicaid Services (CMS):
As of October, 2022, 91,342,256 people are enrolled in Medicaid and CHIP. This is an increase of 462,322 since the last report.
- 84,374,871 are enrolled in Medicaid
- 6,967,385 are enrolled in CHIP
As I noted recently, total Medicaid/CHIP enrollment is actually closer to 94 million as of today, mostly because the 91.3M figure doesn't appear to include the U.S. territories. Around 1.57 million residents of Puerto Rico, American Samoa, Guam, the N. Mariana Islands & the U.S. Virgin Islands had Medicaid coverage as of a year ago; I assume it's a bit higher as of today. Meanwhile, even the official total increased by nearly 4.4 million enrollees from January - October 2022, averaging around 487,000 per month. Interestingly, CHIP enrollment has actually remained pretty much consistent over the past year, inching up & down from month to month.
While the pending end of the COVID pandemic Continuous Coverage requirement is about to lead to a massive Medicaid "Unwinding" starting in April, as of this moment I'm assuming that total Medicaid/CHIP enrollment has gone up by at least another million since October.
The official data (which, again, are only as of October and which don't include the U.S. territories) break out as:
- Medicaid (adult): 49,913,017
- Medicaid (children): 34,461,854
- Children's Health Insurance Program (CHIP): 6,967,385
Since CHIP enrollment has remained essentially flat, I'm tacking on ~1.0M to the Medicaid tally, split ~60/40 between adults & children:
- Medicaid (adult): 50.5 million
- Medicaid (children): 34.9 million
- Children's Health Insurance Program (CHIP): 7.0 million
How about those ~1.6 million in the territories? Well, I don't know the exact split between Adult Medicaid, Child Medicaid & CHIP, but according to this MACPAC report, as of January 2021 Puerto Rico's split was roughly 94% Medicaid / 6% CHIP...pretty close to the 92/8 split in the 50 U.S. States +DC.
With that in mind, I split the territory enrollees similarly, giving this grand estimated total as of January 2023:
- Medicaid (Adult): 51.4 million
- Medicaid (Children): 35.5 million
- CHIP: 7.1 million
The other major factor here is ACA Medicaid expansion (aka "Group VIII" enrollees according to CMS). As far as I know, all of these enrollees are part of the Adult Medicaid population...but also see below. Interestingly, around 700,000 of these "Group VIII" enrollees can be found in Puerto Rico, Guam and the U.S. Virgin Islands.
As I noted a week ago, ACA Medicaid expansion stands at roughly 23.4 million people nationally as of today (including the territories). This further breaks out between newly eligible enrollees (who are only legally eligible for Medicaid thanks to ACA expansion) and those who were previously eligible for the program before the ACA, but who are only enrolled now thanks to ACA expansion:
Most children in families with low incomes were eligible for Medicaid before the ACA, but Medicaid eligibility for parents was limited and varied considerably across states. The median pre-ACA income eligibility limits were just 61 percent of the poverty line for working parents and 37 percent for unemployed parents.
Medicaid expansion produces a “welcome mat” effect, research has found, so that extending coverage to adults increases children’s coverage as well. Children in states that extended Medicaid coverage to parents before the ACA, for instance, participated in Medicaid at a rate that was 20 percentage points higher than children in states with no such extensions. The ACA’s Medicaid expansion has had a similar impact, with enrollment increasing disproportionately among children of parents who became newly eligible.
Over 700,000 children who were previously eligible for Medicaid gained coverage from 2013 to 2015, and the gains were twice as large in expansion states as in non-expansion states. Coverage gains for parents, and the associated gains for children, also improve children’s access to care, with a 2017 study finding that children are 29 percentage points likelier to have an annual well-child visit if their parents are enrolled in Medicaid.
According to Medicaid Enrollment Data via the Medicaid Budget & Expenditure System (MBES), ACA expansion ("Group VIII") enrollees are split roughly 4:1 (80% / 20%) between newly eligible & previously eligible enrollees. Around 20% are in the "previously eligible" category (~4.7M). Again, these should all be adults, but the language above makes it sound like some of them might be children? Since I'm not sure about this, I'm just listing them all as "previously eligible" and leaving it at that:
- Medicaid (Adult) Non-ACA related: 28.0 million
- Medicaid (Adult) ACA expansion newly eligible: 18.7 million
- Medicaid ACA expansion previously eligible: 4.7 million
- Medicaid (Children): 35.5 million
- CHIP: 7.1 million
The grand total between Medicare, Medicaid & CHIP comes to around 159.4 million people, although "over 12 million" are dual-eligibles; they're enrolled in both Medicare and Medicaid at the same time. That knocks their combined enrollment down to ~147.4 million, or 44.1% of the total U.S. population.
OK, next we get into my bread & butter: The ACA individual market. This one is fairly easy thanks to the recent 2023 Open Enrollment Period (OEP) report released by CMS along with some additional data & estimates from state-based ACA exchanges which had later OEP deadlines. QHPs = on-exchange Qualified Health Plans; BHPs = Basic Health Plans, available only in Minnesota and New York at the moment.
- Semifinal QHP selections: 16,306,448
- Likely additional QHP selections via SBMs: ~40K - 80K
- Confirmed BHP enrollments: 1,217,515
Historically, in recent years, roughly 6% of those who "enroll" in QHPs don't end up actually being effectuated--they either never pay their first monthly premium, get rejected due to issues with their legal residency paperwork, and so on. This means on- exchange effectuated QHP enrollment is likely a bit lower, perhaps 15.4 million.
Last year, 89.4% of all on-exchange QHP enrollees received financial assistance in the form of Advance Premium Tax Credits (APTC) and/or Cost Sharing Reductions (CSR). Assuming roughly the same breakout this year, that would mean:
- QHPs, on-exchange, subsidized: 13.9 million
- QHPs, on-exchange, unsubsidized: 1.5 million
- BHPs (MN/NY only): 1.2 million
What about the off-exchange, ACA-compliant individual market? This one is tricky, as many insurance carriers consider their enrollment data to be trade secrets (or just lump all their enrollees together regardless of what category they are). Last October KFF estimated total off-exchange individual market enrollment to be roughly 3.1 million people...as of March 2022. Further complicating this is that the 3.1M figure includes some non-ACA compliant policies such as "grandfathered", "transitional" and the dreaded "short-term, limited duration" (STLD) plans. Another analysis I ran last fall also based on Mark Farrah Associates data put the total off-exchange market at around 4.1 million as of June 2022, but again, the breakout is a bit muddy, so take this one with a grain of salt:
- QHPs, on-exchange, subsidized: 13.9 million
- QHPs, on-exchange, unsubsidized: 1.5 million
- BHPs (MN/NY only): 1.2 million
- QHPs, off-exchange: ~1.5 million
Grandfathered, Transitional and STLD plans: As noted above, this gets a bit fuzzy. I'm pretty sure these three combined come to perhaps 2.6 million total. A 2020 investigation by the House Energy & Commerce Committee found that around 3 million Americans were enrolled in STLD plans...but again, this was prior to the dramatic ACA subsidy upgrade & expansion to middle-income households; I'd imagine this number has dropped considerably since then.
Similarly, while the Kaiser Family Foundation put combined Grandfathered + Transitional plan enrollment at 2.1 million as of 2017, this has also dropped dramatically since that point--I pegged it at perhaps 1.7 million combined a year later, and grandfathered plan enrollment specifically has continued to plummet each year as people either die, age off of it into Medicare, gain employer-based coverage, shift to Medicaid, or switch to ACA-compliant plans which are now dramatically more affordable thanks to the enhanced subsidies than they were prior to 2021.
In addition, some carriers have simply chosen to force the issue over the years as their grandfathered policy market becomes too small to bother continuing to support--for instance, in 2017 Blue Cross Blue Shield of North Carolina announced they were discontinuing theirs with 50,000 people still enrolled at the time.
With all that in mind, I'd estimate perhaps:
- STLD plans: ~2.0 million
- Grandfathered individual market plans: ~300,000
- Transitional individual market plans: ~300,000
Health Care Sharing Ministries:
According to this article from Becker's Payer from July 2022,
Membership in these organizations soared during the 2010s after passage of the ACA. In 2014, there were about 160,000 people involved in healthcare-sharing ministries, according to PBS. By 2018, that figure rose to 1 million. In 2014, the ACA granted ministry enrollees exemption from the law's penalty for not having health insurance.
...There are now 1.5 million Americans who belong to healthcare-sharing ministries, according to data from the Alliance of Health Care Sharing Ministries, a trade group representing seven of the nine largest organizations.
Interestingly, when I visit the link provided in the article, it claims Sharing Ministry enrollment is down to just 865,000 Americans, although a footnote says that "previous versions of the national enrollment number included a few other ministries" which aren't part of the Alliance. The list of state enrollment also says that the data was as of 2021, so I'm a bit confused by this. Even so, I'm willing to accept the 1.5 million number for the moment.
Student Health Plans (Colleges, Universities, etc):
This one is a bit vague as well. So far I've only been able to find two estimates...both are from 2011, both are from the Health & Human Services Dept. (one from HHS, one from CMS), and both give wildly different estimates.
Over a million students are covered through student health plans offered by colleges, universities, or other institutions of higher education. However, not all student health plans are the same. Some plans are comprehensive but others offer limited benefits, which can put students and their families at risk for catastrophic medical bills. In addition, these plans are currently regulated by a patchwork system that makes it difficult for students and their families to understand what their plans cover and their rights as consumers.
According to some estimates, as many as 3 million students are covered through student health plans offered by colleges, universities, or other institutions of higher education. Student health plans are often purchased when family coverage is not available. However, not all student health plans are the same. Some plans are comprehensive but others may offer limited benefits, which can put students and their families at risk for catastrophic medical bills. In addition, these plans are treated differently depending on how and where they’re offered, which has created a patchwork system of regulation for these plans that makes it difficult for students and their families to understand what their plans cover and their rights as consumers.
Huh. Neither of these are particularly useful; not only is that an absurdly wide range, but 2011 was several years before most ACA policy regulations were even implemented, making much of the rest of the paragraphs moot today. I'll split the difference & put 2.0 million in as a placeholder for the moment, but will revise this estimate if I'm able to acquire more reliable/more recent data.
Indian Health Service: According to the official IHS website (as an aside, I'm a bit surprised that the IHS hasn't been renamed the Native American Health Service in recent years?), the IHS served 2.56 million American Indians (Native Americans?) and Alaska Natives across 574 federally recognized Tribes in 37 states as of January 2020. I presume this is slightly higher as of today; call it an even 2.6 million.
TriCare/Veterans Administration:
According to this slide from the official VA website, as of December 2021, there were a total of 9.6 million enrollees in the VA Health Care System. Meanwhile, this infographic from TriCare.mil also says they had 9.6 million beneficiaries at the same time. This confused me because I always thought that TriCare was the U.S. military healthcare system for active duty service members & their families, while the VA was specifically for retirees, but apparently the 9.6M figure covers both:
Does VA participate in the TRICARE Network?
- Yes, since 1995, all VA health care facilities have participated as TRICARE Network Providers.
- VA can provide care for Active Duty Service Members, military retirees, & family members under their TRICARE benefit - on a space available basis.
- Each VA health care facility can serve as primary care manager for TRICARE beneficiaries, but more often TRICARE referrals are used for specialty care.
Let's see where things stand as of now:
- Medicare (all categories): ~65.4 million
- Medicaid/CHIP (all categories): ~94.0 million
- Subtract dual-eligibles from double-counting: -12.0 million
- QHPs + BHPs (On + Off-exchange): ~18.1 million
- Grandfathered, Transitional, STLDs, Student, Sharing Ministry: ~6.1 million
- Indian Health Service: ~2.6 million
- TriCare/VA: ~9.6 million
Subtotal: ~183.8 million people
That leaves roughly 150.4 million Americans split across the following categories:
- Large Group Market
- Small Group Market
- Public Employees
- Uninsured
Small Group Market: According to this Urban Institute brief from January 2022:
...Since the implementation of the Affordable Care Act (ACA), the small group market has been characterized by relative stability, rather than a sudden decline as some policy analysts predicted. The main findings of our study are as follows:
- The rate at which small firms offer health insurance coverage decreased by just 2.6 percentage points from 2013 to 2020. For comparison, it declined by 10.6 percentage points from 2002 to 2012. Steady offer rates likely reflect consistent demand for employer-sponsored coverage from small-firm employees and greater stability in health insurance costs resulting from ACA reforms.
- Health insurance enrollment among small-firm employees remained relatively stable from 2013 to 2019, hovering between 8.9 and 9.6 million enrollees. Small-firm enrollment dropped to 7.9 million in 2020, likely because of decreases in small business employment resulting from the COVID-19 pandemic.
On the other hand, this report from the National Association of Insurance Commissioners (via AHIP) claimed that the small group market covered 13 million lives as of 2019.
Hmmm...obviously there's a discrepancy here, as well as both of these being outdated (I assume the market has recovered somewhat as the economy has recovered from the pandemic). I'm going to split the difference and assume that the Small Group Market as of early 2023 covers an even 9 million people...again, unless/until I'm able to find more reliable data on it.
Federal Public Employees: According to the U.S. Office of Personnel Management (OPM), as of October 2022, the Federal Employee Health Benefit Program (FEHBP) had roughly 8.2 million covered individuals (which includes both federal employees and their families).
State/Local Public Employees:
According to the U.S. Bureau of Labor Statistics:
The BLS identifies approximately 19.5 million employees of state and local government as of January 2023. Local governments, which include most school districts, account for nearly three-quarters of total state and local employment, with state governments accounting for around one-quarter of the total. Overall, state and local employment accounts for approximately 13 percent of the nation's workforce.
If you assume an average of 1.5 lives covered by state/local municipal group policies per state/local employee (remember, while the average U.S. household size is 2.5 people, that doesn't necessarily mean that everyone in those households has the same type of healthcare coverage), that'd be roughly 29.3 million Americans total. I assume that the vast majority of these would fall into the large group category, but I suppose some smaller municipalities would utilize small group plans. Again, I'll modify this if someone can correct me on my assumptions here.
A NOTE REGARDING SELF-INSURED COVERAGE:
19.5 million is 13% of right around 150 million workers total. Regarding self-insured health insurance plans, the Employee Benefit Research Institute said that 73 million Americans (including both employees and their dependents) were in self-insured health plans as of 2007...roughly 55% out of 132.8 million individuals in plans governed by ERISA that year.
This is the same 55% reported by Statista.com, which shows this percentage rising to 65% as of 2022. This suggests that roughly 97.5 million Americans were enrolled in self-insured coverage as of last year.
However, I have no idea how this 97.5 million figure breaks out between private firms and government employee policies, so I'm not including that on the donut graph for the time being.
LARGE GROUP COVERAGE: This is The Big One: Employees (and their dependents) who receive health insurance via large private employers (ie, those with more than either 50 or 100 full-time employees, depending on the state)...although, once you subtract all the other categories above, as well as the "uninsured" portion of the population broken out below, it's not as large as you might think: Around 77.5 million people. This is smaller than you'd expect because I've broken out federal, state & local employees and their dependents; if they were included, it would total more like 115 million.
As noted above, I thought about breaking Large Group coverage out between self-insured and not, but there's too many variables for me to consider so I'm leaving that off the graph for now.
Finally...
UNINSURED: Again, this gets tricky due to the data being outdated. In November 2021, KFF estimated that there were roughly 27.4 million uninsured Americans...as of 2020. At the time, they broke this population out as roughly:
- 25.7% eligible for Medicaid/CHIP (~7.0 million)
- 7.5% caught in the Medicaid Gap (~2.1 million)
- 38.1% eligible for ACA subsidies (~10.4 million)
- 28.6% ineligible for financial assistance (~7.8 million)
The 7.8 million ineligible for financial assistance is mostly broken out between those who earn too much to be eligible for subsidies and undocumented immigrants, who aren't eligible for federal subsidies regardless of income. According to another KFF study from just two months ago, 46% of undocumented immigrants are uninsured. The same study put the total uninsured rate at 27.5 million in 2021 and estimated that 23% of these are "noncitizens," which would come to 6.3 million....except that "noncitizens" includes plenty of Green Card and other documented immigrants.
As of today there's perhaps 12 million undocumented immigrants total nationally (I'm assuming this has gone up a bit since the 11.4 million estimate last February). 46% of that would be around 5.5 million uninsured undocumented immigrants, leaving just ~2.3 million who simply earn too much to qualify.
The problem with that 27.5 million figure is that it's as of 2021; the uninsured rate has dropped a bit more since then thanks to Medicaid expansion continuing to ramp up in Missouri & Oklahoma, among other states; ACA exchange enrollment increasing by ~1.8 million during the 2023 Open Enrollment Period; and the ongoing drop in unemployment. Not all of that came from the uninsured, but some did. For the moment, I'm going to shave perhaps 900K off of the 1st & 3rd of the categories below and assume it's around 26.5 million as of today:
- Uninsured (Medicaid/CHIP eligible): 6.5 million
- Uninsured (Medicaid Gap): 2.2 million
- Uninsured (ACA subsidy eligible): 10.0 million
- Uninsured (Undocumented Immigrants): 5.5 million
- Uninsured (Earn too much for ACA subsidies): 2.3 million
Put these all together and you get the following:
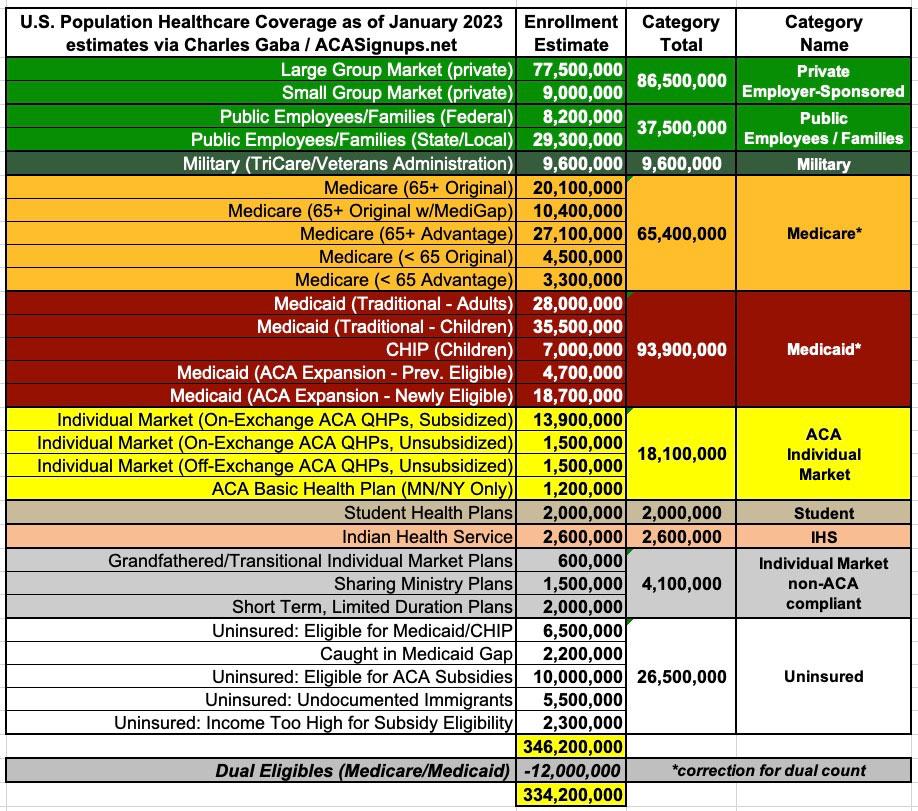
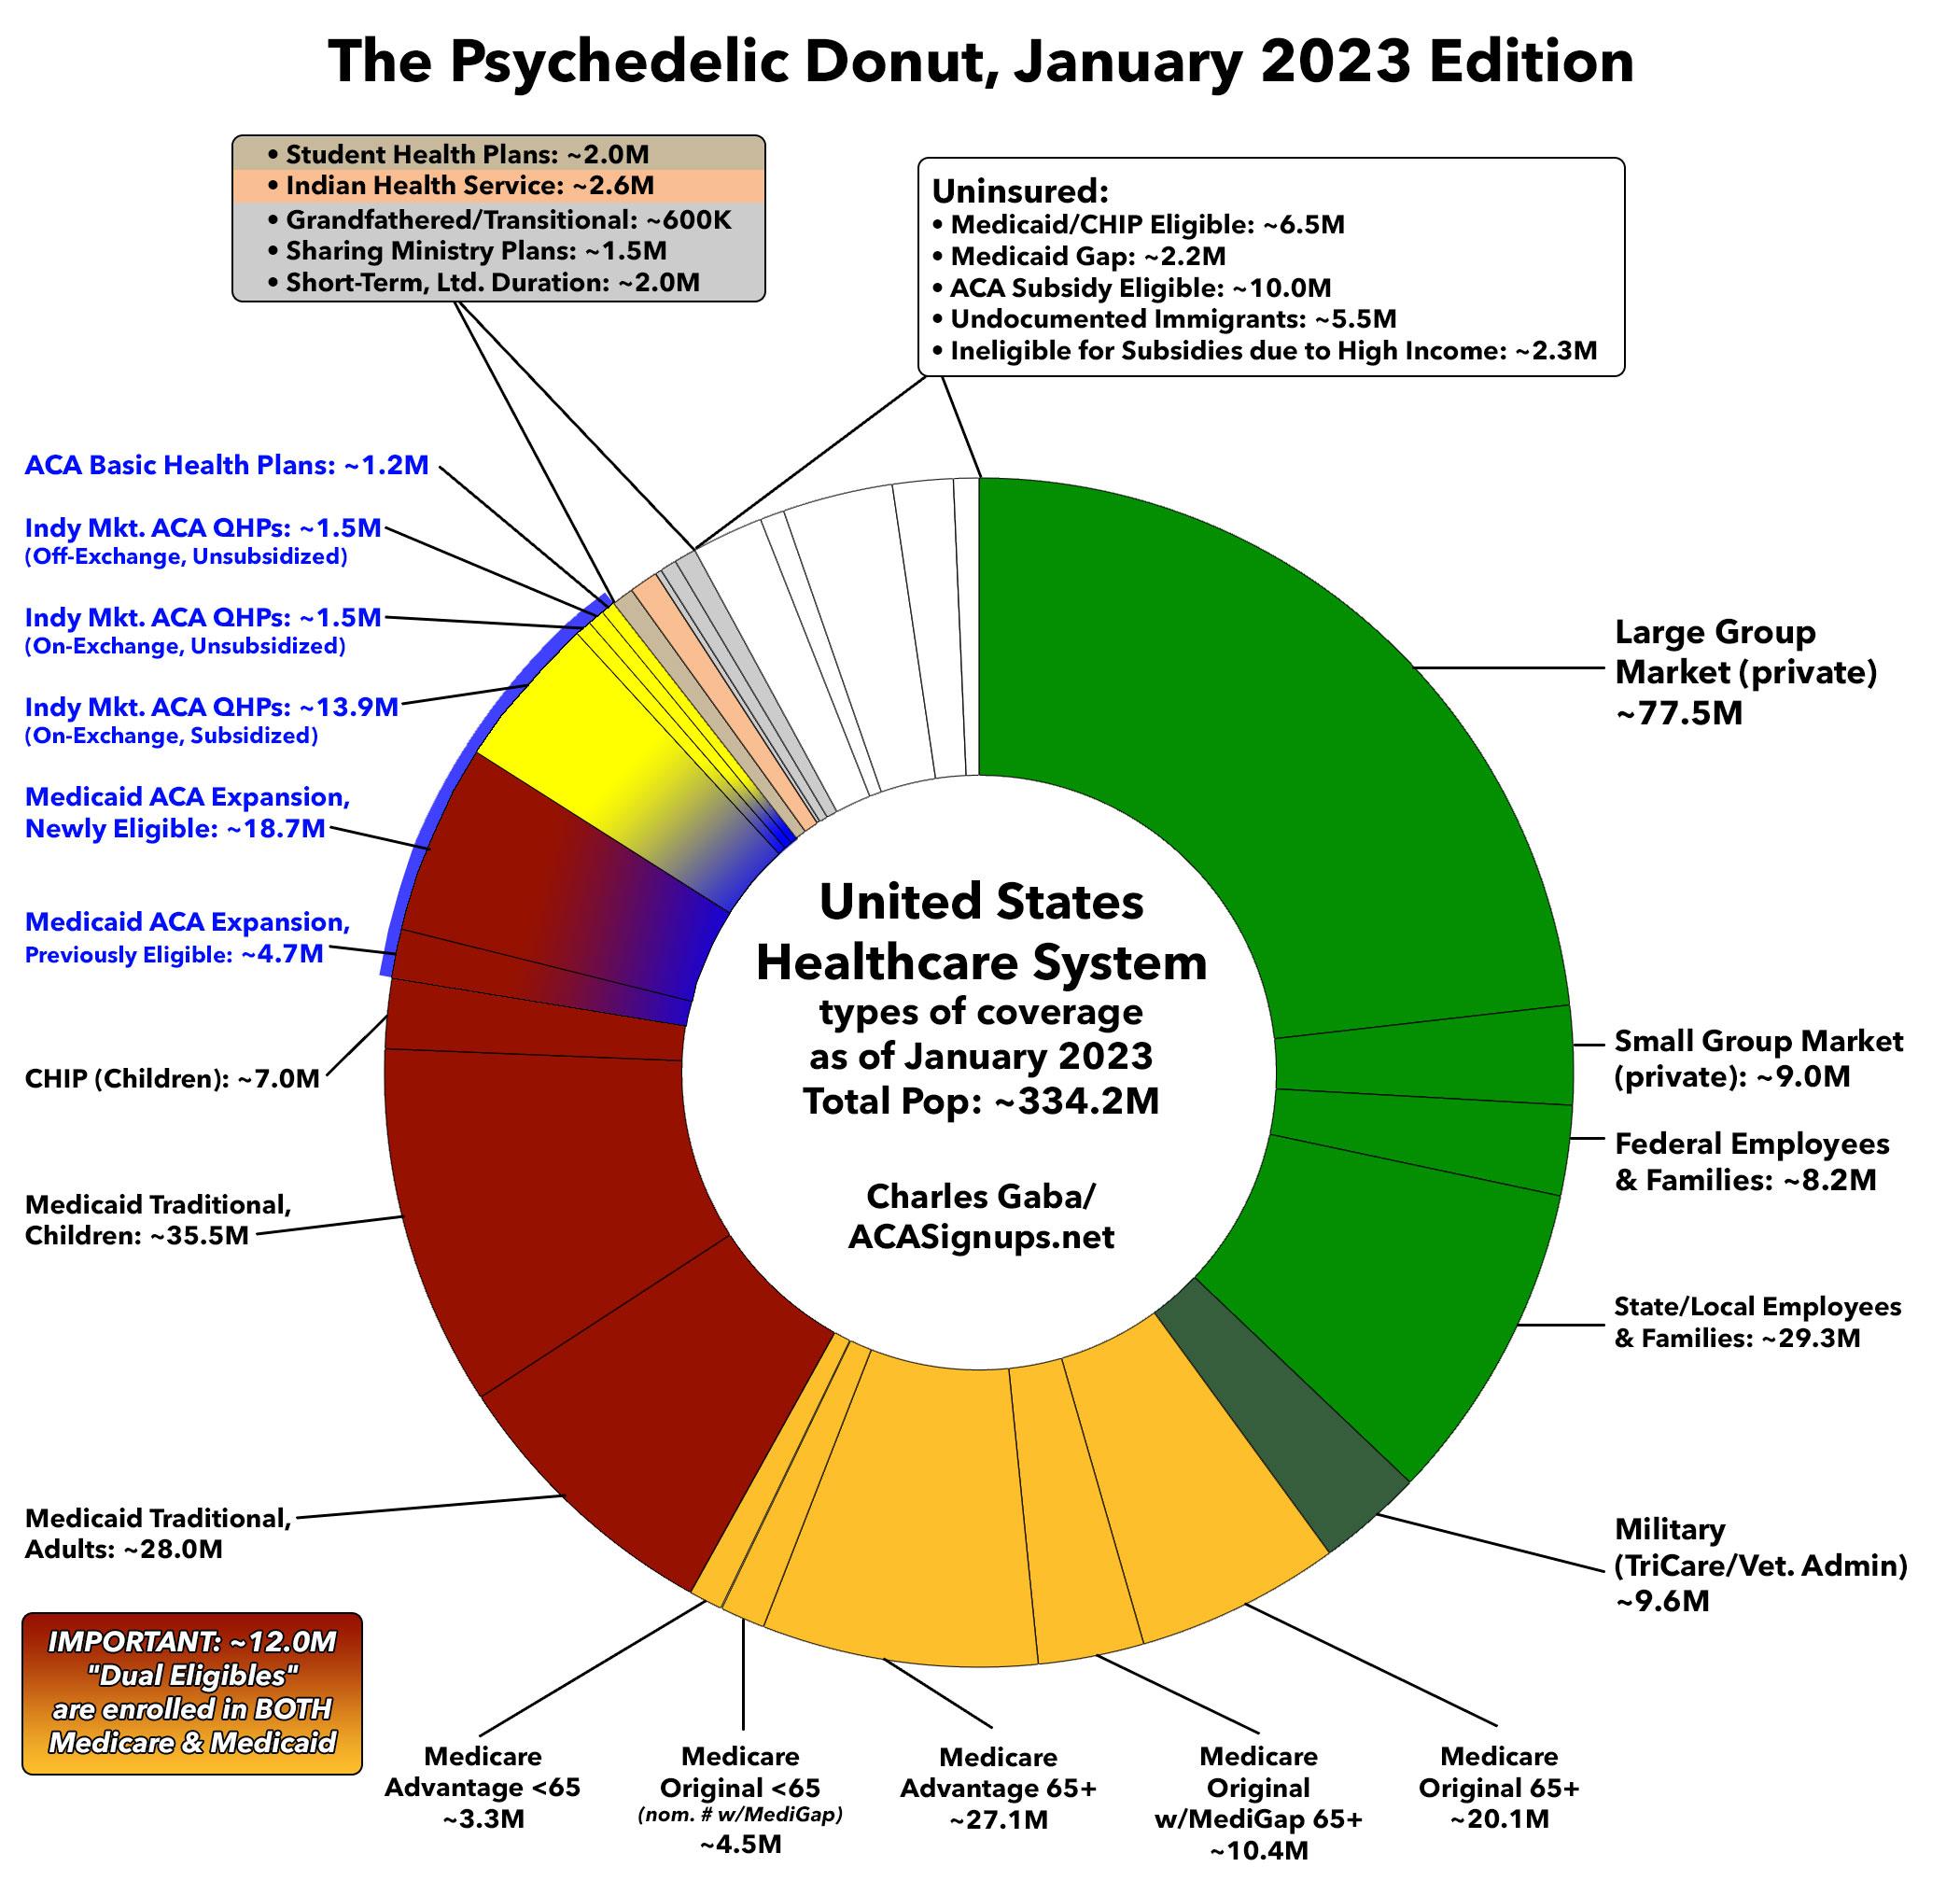
Advertisement
