

CMS Report: ~178K of those kicked off of Medicaid enrolled in #ACA exchange plans thru May
Thu, 09/07/2023 - 10:23am
Over at Inside Health Policy, Amy Lotven has an excellent scoop from a new CMS report which was hiding in plain sight:
New CMS data, quietly released in late August, show about 178,000 consumers chose a qualified health plan (QHP) through a state or federal exchanges after losing Medicaid and CHIP coverage in the first two months of the Medicaid unwinding. Those sign-ups through the end of May are more than three times the 54,000 enrollments that CMS reported in July, which reflected only the April numbers.
As a reminder: Normally, states will review (or "redetermine") whether people enrolled in Medicaid or the CHIP program are still eligible to be covered by it on a monthly (or in some cases, quarterly, I believe) basis. However, the federal Families First Coronavirus Response Act (FFCRA), passed by Congress at the start of the COVID-19 pandemic in March 2020, included a provision requiring state Medicaid programs to keep people enrolled through the end of the Public Health Emergency (PHE). In return, states received higher federal funding to the tune of billions of dollars.
As a result, there are tens of millions of Medicaid/CHIP enrollees who didn't have their eligibility status redetermined for as long as three years.
With the end of this continuous coverage as of March 31st, 2023, healthcare advocates have been warning that millions of people would lose coverage, including many who are still actually eligible...and sure enough, as of this week, at least 5.7 million Medicaid enrollees have lost coverage so far, of whom a stunning 73% (4.1 million) were kicked off the program for purely procedural reasons--that is, failure to return a form or, in some cases, state administrations either mistakenly or deliberately sweeping entire families off the programs if a single member is no longer eligible.
...CMS and other stakeholders have been working to make sure that as the states disenroll people from Medicaid over the next year, eligible consumers can easily transfer to other coverage, including through the ACA exchanges: Healthcare.gov currently has a special enrollment period through July 2024 and many state exchanges have followed suit. Healthcare.gov is also linking navigators to people who lost Medicaid/CHIP for enrollment assistance, and recently launched a nationwide ad campaign encouraging people to respond to information requests from their state agencies and to visit the federal marketplace if they’ve lost coverage.
According to CMS’ data, 151,000 people chose an ACA plan through one of the 33 states using healthhcare.gov, which reflects about 65% of the 233,000 marketplace consumers who previously had Medicaid/CHIP; another 26,000 people selected a plan through a state-exchange, or about 10% of the 265,000 state exchange consumers who lost Medicaid/CHIP.
At first the wording of this paragraph confused me: If "233K marketplace consumers previously had Medicaid/CHIP" how can only 151K of them "have chosen an ACA plan?" If they're a "marketplace consumer" that means they "chose an ACA plan" by definition. The same applies to the 265K state-exchange enrollees.
However, after looking at the report itself, I think I understand the breakout:
- For HC.gov, across 23 states, ~233K people who were kicked off of Medicaid/CHIP applied for ACA exchange coverage
- Of those, ~35.5K (15%) were determined by HC.gov to still be eligible for Medicaid/CHIP and presumably were re-enrolled
- The remaining ~197K (85%) were determined by HC.gov to be eligible for an ACA exchange Qualified Health Plan (QHP), whether with subsidies or without them
- Of those, only ~151K (65%) actually enrolled in a QHP
The state-based exchange report is a little different and a bit confusing, but out of ~265K who applied, only 176.4K were determined to be eligible for a QHP (66%); of those, only 26.7K actually enrolled in one, plus another 22.5K who enrolled in a BHP. Combined, that's actually around 49.1K, or 28% of the 176.4K who were eligible or 18.5% of the 265K who applied.
The thing is, major of a problem as the entire Medicaid Unwinding debacle is overall, I can't blame all of it on the federal or state governments--according to these reports, there were at least ~173,000 people who were kicked off of Medicaid/CHIP for what appear to be legitimate reasons (income too high/etc), who actively applied for ACA coverage and were approved for ACA coverage, but then chose not to enroll in that coverage for whatever reason.
Some of them may have gotten employer-sponsored insurance or some other type of coverage between applying and opting out of enrolling, but whatever their reasons, for this particular subset there's no fingers to be pointed at anyone.
In any event, it may seem surprising at first that there are more people in state-based exchange states who lost coverage given that only 40% of the total U.S. population lives in those states, but it's important to note that the report is missing data for 2 state-based exchange states and 10 HC.gov states. Also keep in mind that all of the state-based exchange states have expanded Medicaid under the ACA, while 10 of the HC.gov states haven't done so (including huge states like Texas and Florida), meaning they generally had a higher portion of their residents in Medicaid/CHIP in the first place.
It's also important to note that the combined number (233K + 265K) does not mean that only ~500,000 Americans had lost Medicaid/CHIP coverage through the end of May. For starters, it's missing 11 states + DC, including AL, CA, IL, LA, MI, MS, MO, NC, OR, TN & WI (although some or possibly all of these states didn't even start redeterminations until after May to begin with); for another, it only includes those who actually applied for coverage to begin with.
...The dataset for the federal and state exchanges includes: the number of people who previously had Medicaid/CHIP, the number deemed eligible to enroll in a QHP, the number eligible for subsidies, and number who selected a plan. It also includes data on the number of accounts that states without integrated exchange and Medicaid systems sent to CMS, and people who were automatically enrolled in coverage by their state.
While the overall Medicaid and CHIP-QHP conversion rate for SBMs was about 10%, data show that it ranged significantly -- from 1% in Kentucky to 69% in New Mexico.
This is hugely important. I'm assuming that much of this is thanks to New Mexico having a robust/aggressive outreach program to encourage eligible Medicaid disenrollees to move to ACA exchange plans, but I'm also guessing it's largely thanks to New Mexico's extremely generous state-based subsidy program (the "Healthcare Affordability Fund") which adds additional savings on top of the federal ACA subsidies. While some other state-based exchanges have similar programs (CT, CO, NJ, WA...California's goes into effect soon), New Mexico's is likely the most generous of them for lower-income enrollees.
Lotven's article also goes into the transfer data for the Basic Health Programs in New York and Minnesota.
...The report also finds that only 66% of people who reported previous Medicaid or CHIP coverage when applying for a QHP through a state exchange were eligible to enroll, compared to 85% of those who applied through healthcare.gov. Most consumers who were eligible to enroll in a QHP also qualified for tax credits, 75% in health care.gov and 44% from the state exchange.
These gaps may make sense if you again consider that every state-based exchange has expanded Medicaid while ten of the federal exchange states haven't done so (half of which, including Texas and Florida, are included in the report).
This means that the state-based exchange states are more likely to have so-called "able-bodied" adults without minor children who have been kicked off of Medicaid for various reasons; I'm assuming that this population is more likely to have moved, seen their income increase beyond 138% FPL and so forth, thus making them less likely to qualify for either subsidies or even to enroll at all (assuming they've since gotten a job which has offered them employer-sponsored insurance).
UPDATE: I've pored over the actual report itself and have reformatted and simplified the data to the best of my ability into a single table for all 50 states +DC. There are 5 state-based exchanges which included a separate number labeled "Consumers on Account Transfers Associated with a Medicaid/CHIP Coverage Denial or Termination Following Renewal." However, since this doesn't include people who actually applied to the exchanges (and it's only listed for 5 of the 15 SBM states anyway), I haven't included that number as a separate column. I've highlighted those five states in tan, however.
I'm also ignoring "Automatic QHP Selection" since only 5 SBMs have this function and only 793 people were enrolled into QHPs via this feature nationally anyway:
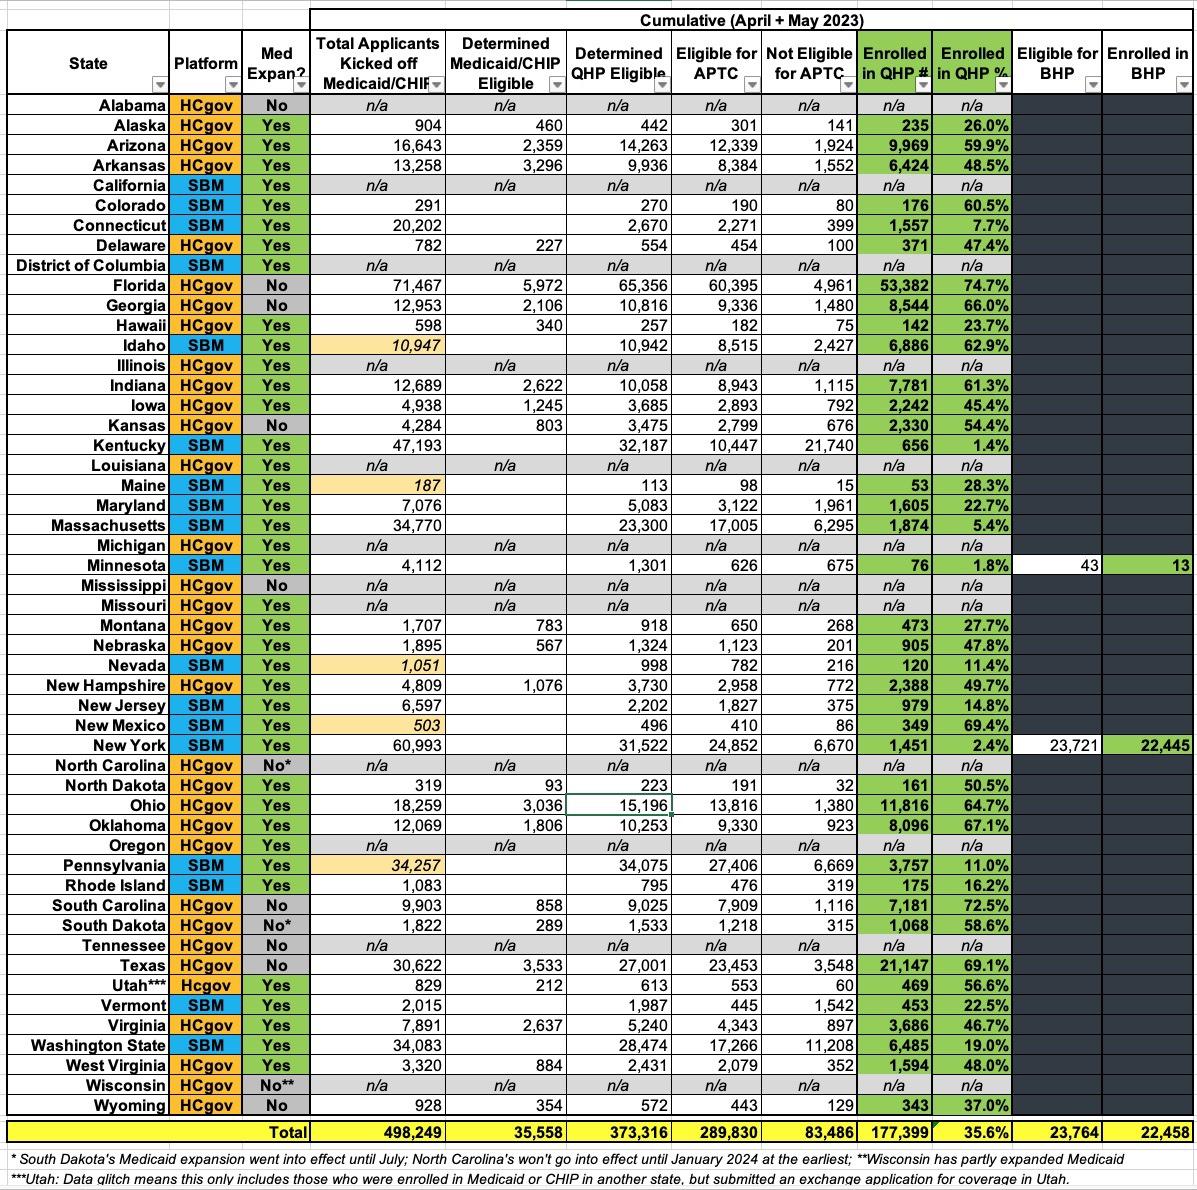
If you eliminate the 12 states without any data, the remaining 39 states are all over the place, ranging from just 1.4% enrolling in QHPs in Kentucky (656 people out of 32,187 supposedly eligible for QHPs) to as high as 74.7% in Florida (53,372 enrolled out of 65,356 eligible for QHPs).
Honestly, I don't know what to make out of this. Florida doesn't have any supplemental state-level ACA subsidies like New Mexico, but it does have by far the largest per capita ACA enrollment in the country to begin with. On the other hand, South Carolina supposedly has enrolled 73% of their QHP-eligible unwinding applicants, and they have neither.
It's also worth noting that for Minnesota and New York, the report doesn't clarify whether or not the BHP-eligible numbers are included with the QHP-eligible total or if they're separate. I suspect they're included as part of the larger number; if so, that would move New York up from just 2.4% enrolled to 75.8% (23,896 enrolled out of 31,522 eligible). However...that's not entirely clear.
The footnotes aren't terribly helpful in clearing any of this up either:
1. This table represents applications for consumers whose Medicaid/CHIP coverage was denied or terminated following renewal that were received by SBMs through an integrated Medicaid, CHIP, and Marketplace eligibility system or through an account transfer process in which the Medicaid or CHIP agency sends applications to the SBM. It may also include applications submitted by the consumer to the SBM that are matched to Medicaid/CHIP data or on which the consumer attests to a Medicaid or CHIP loss or denial. SBMs report on all applicable applications received and not on the Medicaid-defined cohorts of individuals whose renewal is due in a given month. State-specific variations are:
- Maine and Nevada report all applications with Medicaid/CHIP denials or terminations, not only those part of the annual renewal process.
- Connecticut, Massachusetts, and Washington also report applications with consumers determined ineligible for Medicaid/CHIP due to procedural reasons.
- Minnesota and New York report on eligibility and enrollment for their Basic Health Programs.
- Idaho’s April data on consumers eligible for a QHP with financial assistance does not depict a direct correlation to consumers with a QHP selection.
- New Mexico’s April submission was updated to reflect a revised submission.
The notes do help clarify that extra "Transfer" field for 5 states, however...and it looks like I was smart not to include it since it looks like there'd be some double-counting going on if I did:
- Only SBMs with a non-integrated system have and report account transfers, which are counted when a transfer is not considered a complete application. An account transfer that becomes a complete application within the same reporting month will also be counted in the application metric, although some SBMs will only count it in the application metric.
It also notes that several states have the automatic QHP enrollment tool, which I'm not including either:
- Only SBMs with an automatic plan assignment process have and report automatic QHP selections. These SBMs make automatic plan assignments into QHP for a subset of individuals and provide a notification of options regarding active selection of an alternative plan and/or, if applicable, making the first month’s premium payment.
However, again, the SBM data seems to be a complete mish-mash:
2. The data in this table is not cumulative and counts unique Marketplace activities during the reporting period month in which the relevant activity occurs. As such, activities by any one consumer may be included across reporting months. For example, a consumer who submits an application and receives a determination of QHP eligibility may be counted in one month but his/her plan selection could be counted in a later month. Thus, the percentages do not necessarily depict a direct correlation to the count of consumers on applications received during the current reporting month. Total counts represent activity across the reporting months and is not cumulative as of the latest reporting month. Updated applications in the reporting month are only counted once. Updated applications in a following month may be counted again in that applicable month only if the consumer obtains a new Medicaid/CHIP renewal.
3. SBMs have different operational processes and eligibility systems for handling QHP, Medicaid and CHIP eligibility determinations. While CMS works with SBMs to align the metric definitions across the Marketplaces there can be limitations and anomalies among the SBM data due to different SBM system capabilities. Additionally, variances in the data may be attributable to differences in how states are conducting unwinding renewals including processing timelines and whether states are staging applications for population cohorts (e.g., over age 65).
So...I really don't know what to say.
As for my Medicaid Expansion theory, I think that still holds up pretty well: 4 of the 6 states with the highest QHP enrollment levels are non-expansion states. That's not terribly strong evidence, however, since both New Mexico and Oklahoma rank over 65% enrolled as well.
In any event, next month the June report should be out, and that should include more data from more states, which will hopefully clear up the picture and explain some of these massive variances.
Advertisement
