Mazel Tov to the #ACA on its bar mitzvah! #ACA13 (part 2)

Note: I'm breaking this analysis into several sections:
Part 1 / Part 2 / Part 3 / Part 4 / Part 5 / Part 6 / Part 7
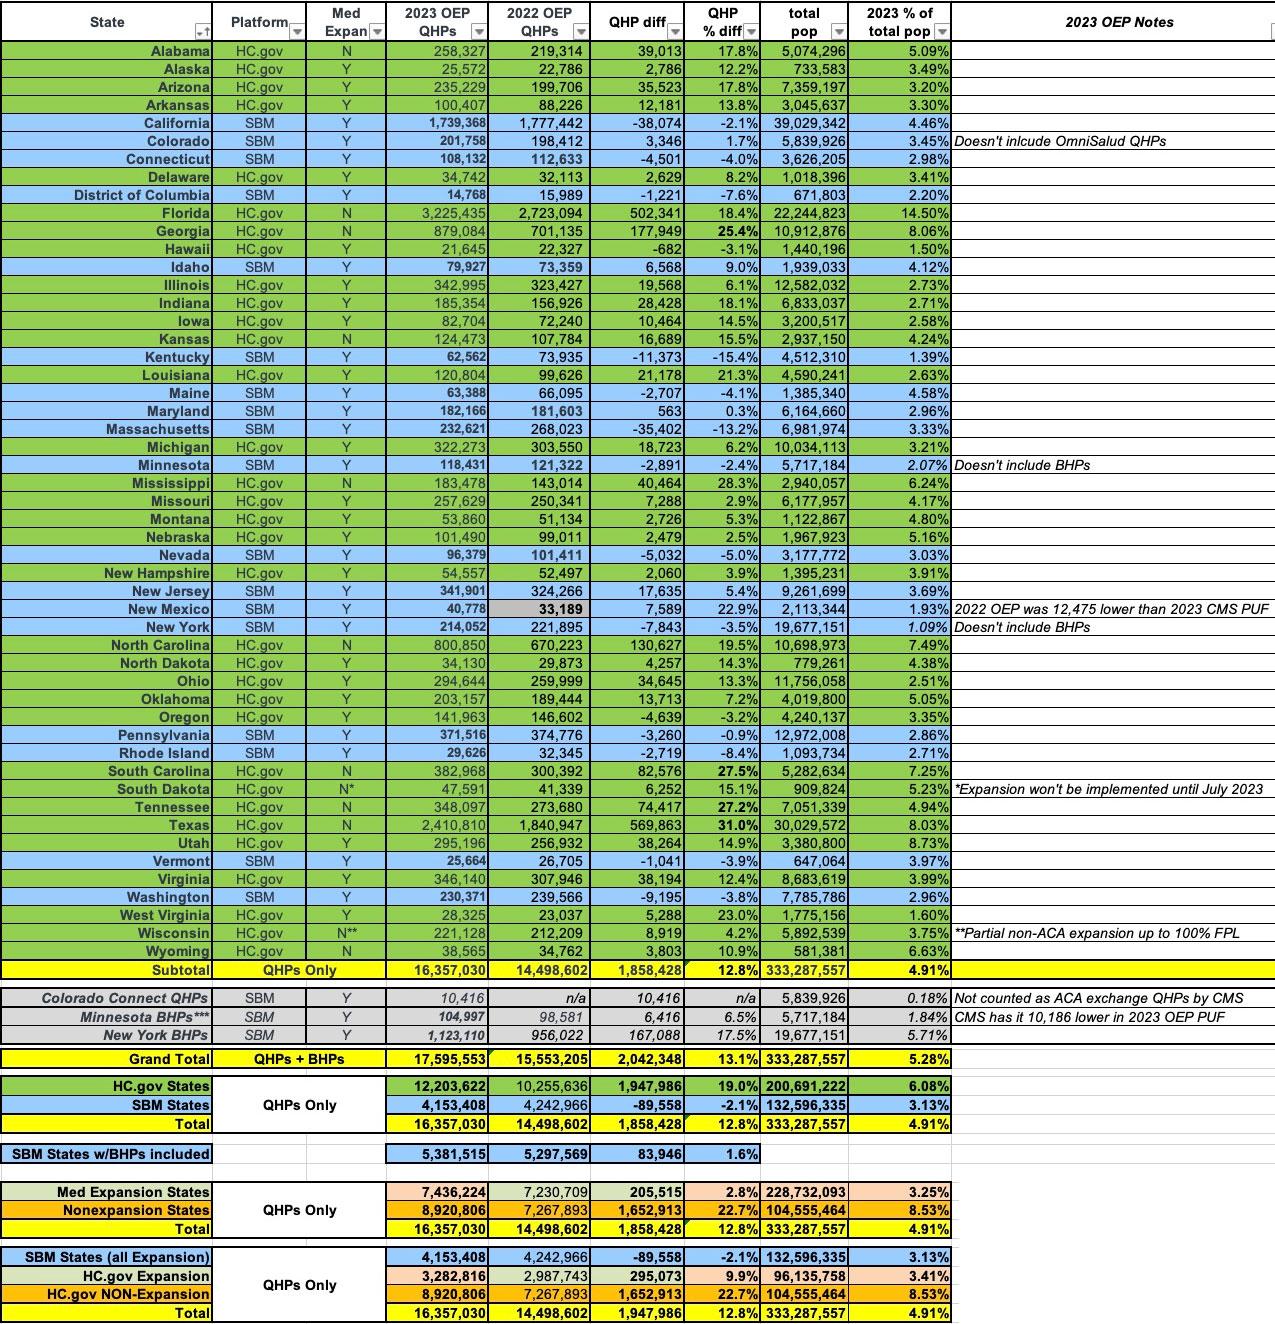
Now that the official press release is out of the way, it's time to dig into the actual final, official state-level data. The table below has the final, official 2023 Open Enrollment Period (OEP) numbers for both Qualified Health Plans (QHPs) in all 50 states + DC as well as Basic Health Plan (BHP) enrollment in Minnesota and New York only, compared to the 2022 OEP.
I've also thrown in around 10,000 "OmniSalud QHP" enrollees in Colorado; this is a special program specifically designed for undocumented immigrants and DACA recipients who aren't eligible to enroll in coverage via the official ACA exchange. It utilizes a separate web portal and separate financial assistance provided entirely by the state, not the federal government. While the insurance policies are the same as QHPs, they aren't counted as part of the official CMS tally,
I've also broken out the numbers by type of ACA exchange (federally facilitated or state-based) and by Medicaid expansion status. The main takeaways are pretty much the same as I've written about earlier this year, with some slight modifications as the final numbers have come in:
- Overall exchange QHP enrollment is up 12.8% y/y, or 12.9% if you include the new OmniSalud enrollees
- Overall BHP enrollment is up over 16% y/y
- Federal exchange enrollment is up 19% y/y
- State-based exchange enrollment is down 2.1% y/y if you only include QHPs; however...
- State-based exchange enrollment is up 1.6% if you include BHPs as well.
- Since most BHP enrollees would otherwise be eligible for QHP enrollment if the BHP program didn't exist, you could argue this either way.
The larger point is that SBM enrollment is basically flat year over year vs. federal exchange enrollment's dramatic 19% increase. However, there's one other important thing to consider before comparing them: Medicaid expansion status. Since Medicaid expansion "cannibalizes" a large chunk of enrollees who'd otherwise be eligible for QHPs (similar to how BHPs do), that's an important factor:
- NON-expansion state enrollment is up 22.7% y/y
- EXPANSION state enrollment is up just 2.8% y/y
Since every one of the states with their own exchange has also expanded Medicaid, this means you have to break it out further:
- State-based exchanges: Down 2.1% (or up 1.6% depending on your BHP categorization)
- Federal exchange EXPANSION states: Up 9.9% y/y
- Federal exchange NON-expansion states: Up 22.7% y/y
So the state-based vs. federal exchange gap is considerably smaller: Up 9.9% vs. down 2.1% (or up 1.6%).
It's important to note that while New Mexico originally appeared to have seen QHP enrollment drop by 11% since the 2022 OEP, it turns out the BeWell NM exchange experienced a serious clerical error last year that was only discovered after the dust settled on the 2023 OEP this year. Actual 2022 OEP enrollment was considerably lower than reported at the time, meaning 2023 OEP enrollment is actually up nearly 23%.
Some key state numbers:
- Texas saw the most dramatic year-over-year QHP enrollment increase: Up a whopping 31%
- Mississippi, South Carolina, Tennessee and Georgia also all saw 25%+ increases. Not surprisingly, not one of these five states has expanded Medicaid.
- At the opposite end, Kentucky saw the largest y/y QHP percentage drop: Down 15.4%.
- Massachusetts, Rhode Island and the District of Columbia also saw QHP enrollment drop by more than 7% each. All four states operate their own exchanges.
- Florida has by far the highest percent of its total statewide population enrolled in ACA exchange QHPs: 14.5%, or more than 1 out of every 7 Floridians. Part of this is due to them not expanding Medicaid, but no other non-expansion state has more than 8% of their populations enrolled in exchange plans.
- At the opposite end is Kentucky again: Just 1.4% of its total population is enrolled in an on-exchange QHP. New York technically only has 1.1%, but again that doesn't include BHP enrollees; throw them in and they're at 6.8% of the state population.
In Part 3, I'll look at some of the other QHP enrollment demographics (income, metal levels, new vs. renewals, etc).


