

2022 Rate Changes
Every year, I spend months painstakingly tracking every insurance carrier rate filing for the following year to determine just how much average insurance policy premiums on the individual market are projected to increase or decrease.
Carriers tendency to jump in and out of the market, repeatedly revise their requests, and the confusing blizzard of actual filing forms sometimes make it next to impossible to find the specific data I need. The actual data I need to compile my estimates are actually fairly simple, however. I really only need three pieces of information for each carrier:
- How many effectuated enrollees they have enrolled in ACA-compliant individual market policies;
- What their average projected premium rate increase (or decrease) is for those enrollees (assuming 100% of them renew their existing policies, of course); and
- Ideally, a breakout of the reasons behind those rate changes, since there's usually more than one.
Unfortunately, there are about a dozen states where due to the carriers and/or the state insurance departments heavily redacting the rate filing documentation, I've been unable to fill in the actual number of people enrolled by some or all of the insurance carriers within that state's individual market. This means that the average premium rate changes listed (shown in grey) are unweighted averages, not weighted.
This can make a big difference in some cases: Let's say you have 2 carriers in a state, one raising rates by 10% and the other raising them by 1%. The unweighted average increase would be 5.5%. However, what if it turns out that the first carrier has 90% of the market share while the second only has 10%? That would mean a weighted average increase 9.1%. The unweighted average is the best I can do for these states without knowing the market share breakout, however.
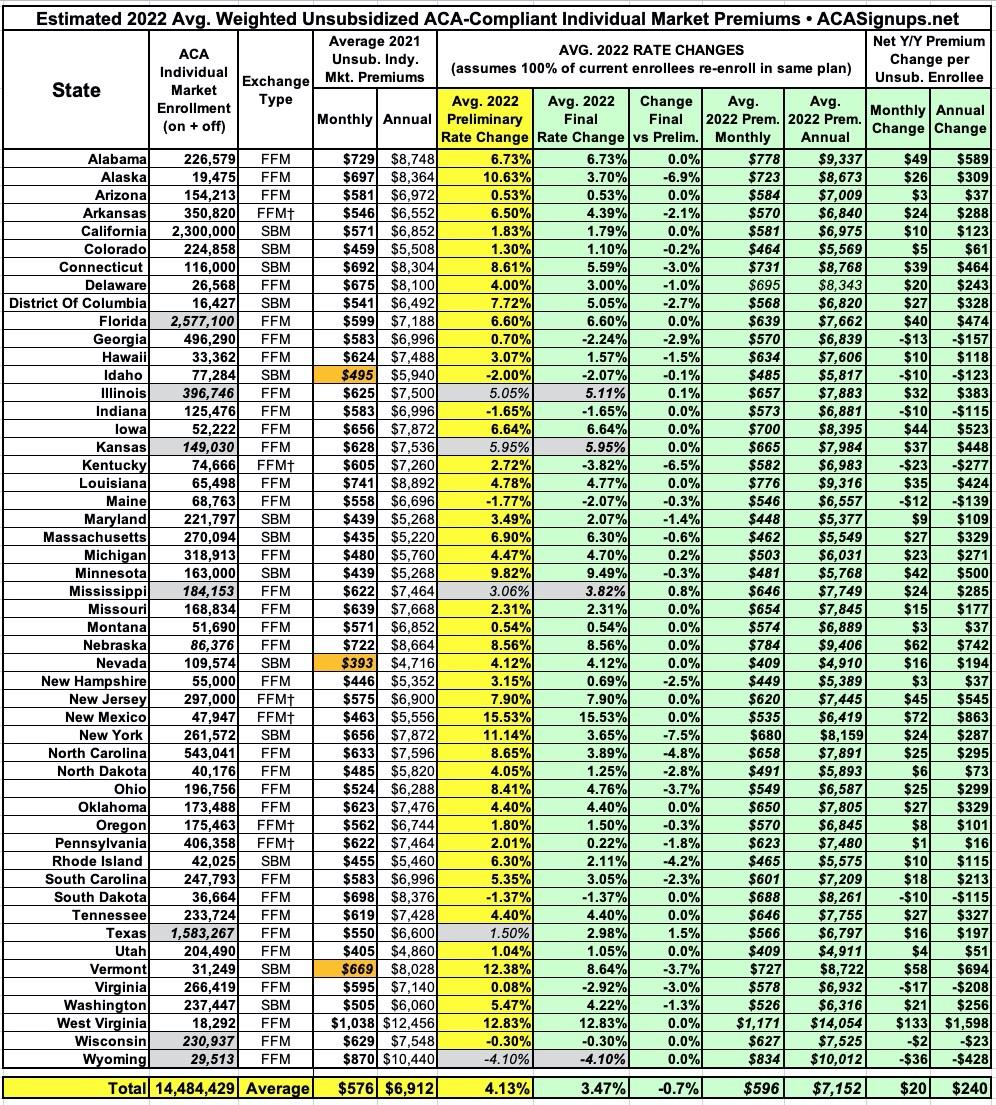
As of this writing, I've plugged in the preliminary (requested) 2022 statewide average rate changes for all 50 states plus the District of Columbia, giving a national average increase of 3.9% overall. I've also entered the final (approved) averages for 19 states so far. For those states, the national weighted average increase is a bit higher, 4.8%. This will likely drop as more final averages are entered in the coming weeks hover; the odds are high that once every state is filled in, the final average increase will be slightly lower than the preliminary average.
UPDATE 10/19/21: I've filled in the final/approved averages for Oregon, Indiana, Delaware, Connecticut and Idaho, which collectively whittle the final national average down from 4.8% to...4.6%.
UPDATE 10/21/21: I've managed to get hard enrollment numbers (allowing weighted changes) as well as approved rate changes for North Dakota, Arizona and South Carolina. In addition, Wisconsin's insurance dept. issued their weighted, approved average as well.
With these updates, the preliminary national average increases to 4.1%, while the approved average (across 29 states) is down to 4.2%.
UPDATE x2 10/21/21: OK, I'm on a roll today: I've also managed to get more accurate enrollment data for Alabama as well as confirming AL's approved rate changes, and have also filled in the enrollment data for Iowa carriers (again, confirming approved changes), which allowed me to run the weighted average statewide. None of these changes moves the needle on either preliminary or approved rate changes, however.
UPDATE 10/22/21: Added approved rate changes for Colorado, Michigan & Montana.
UPDATE 10/27/21: Added approved rate changes for Ohio, Tennessee, South Dakota, North Carolina & Arkansas, along with some updates/corrections to enrollment data & carrier participation for a few other states. Also revised estimated total market enrollment for the 7 states which I don't have hard data available for.
UPDATE 11/02/21: Now that the 2022 Open Enrollment Period has officially launched, the federal Rate Review website has been updated with approved rates for all 50 states + DC, allowing me to fill in the remaining states.
Overall, it looks like the average unsubsidized rate increase is around 3.5% nationally.
(click image for higher-resolution version)

Pages
Advertisement
