

2016 Rate Requests: Where Things Stand: Around 11.9% nationally
Tue, 07/28/2015 - 10:10pm
UPDATE 8/27/15: I've been writing up a whole mess of *approved* state rate updates today; look for this entry to be updated on Friday.
Recently, Richard Simpkins (aka icowrich) gave me the idea to take the known state-wide 2016 rate increase requests and go a step further, by plugging the weighted average rate increases for each state into a spreadsheet and then running a weighted average based on each state's proportion of the total U.S. population, like so (scroll to bottom of this entry for links to analysis for each state):
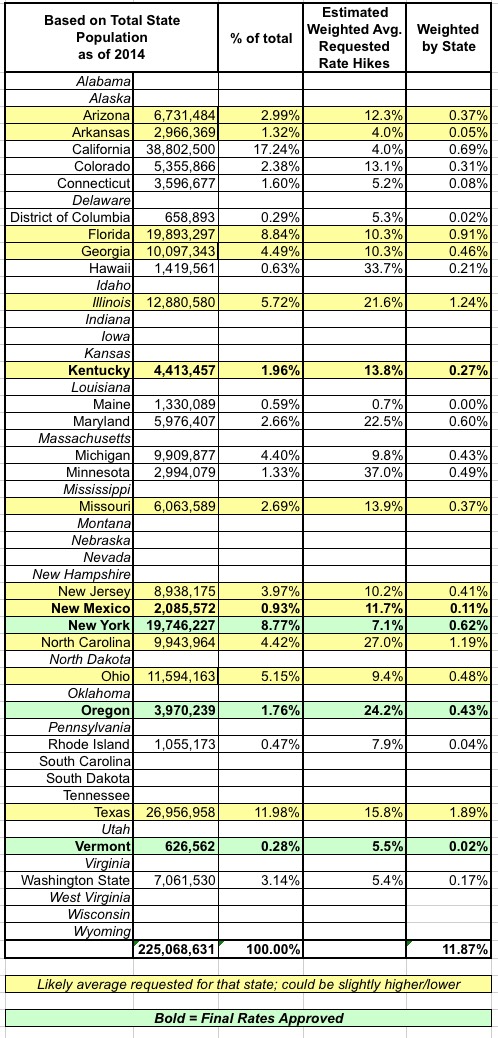
...giving an overall rate increase of about 11.9%, which isn't fantastic but is at the upper edge of the 10-12% annual hike which was typical nationally prior to the ACA.
This is a very partial picture, for several important reasons:
- This only includes 25 states plus DC
- The included states make up about 225 million people...or about 70% of the total U.S. population.
- The remaining states could have higher (or lower, in some cases) average rate hikes, skewing the national average up or down.
- Many of the states listed are only partly weighted, and include certain assumptions about total risk pool size, etc.
- Nearly all states listed are still requested hikes only, not approved; the final, approved rates could be different in many cases.
Still, with all those caveats taken into account, this gives a rough idea of what things look like for most of the country.
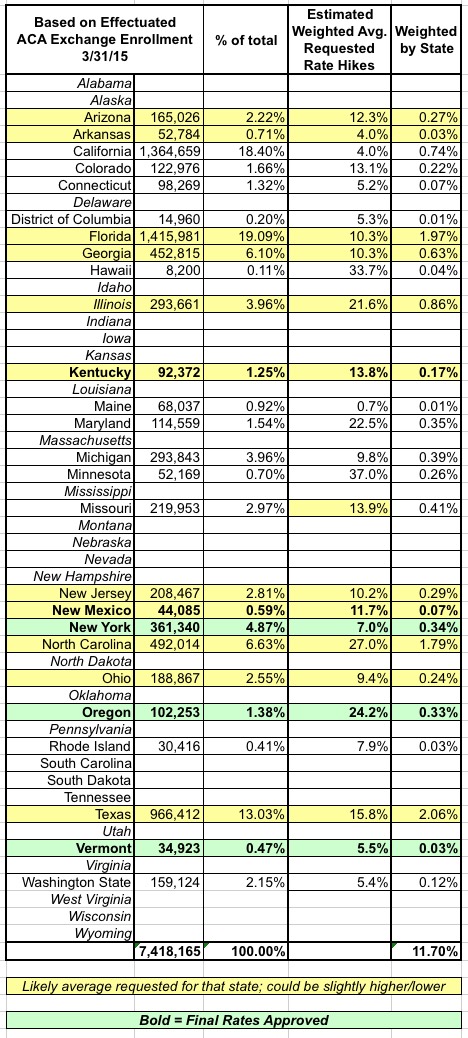
The only other issue I had with running the weighting this way is that the total population of each state probably isn't the best benchmark to use, since these rate hikes are only relevant to the individual market within each state, which can vary widely depending on the local economy, demographics and so on. The ideal number to use would be the total individual markets in each state (both on- and off-exchange), minus any grandfathered/transitional enrollees in each one.
Unfortunately, I don't have that data for 2015 for any state except Florida. The closest to this that I have at the moment are a) currently effectuated exchange-based enrollment as of 3/31/15 and b) the total 2014 individual market size for each state. Neither of these is ideal: The former doesn't include off-exchange ACA-compliant enrollees and is 3 months out of date, while the latter includes grandfathered/transitional enrollees and is 6 months out of date. They'll have to do for now, however.
When I plug in the March 31, 2015 ACA Exchange Only numbers, it's a bit lower (around 11.7% overall):
When I base things on the 2014 total individual market size, however (again, this includes grandfathered/transitional enrollees who are not part of the same risk pool), it's a bit higher than either of the others, at around 12.2%:
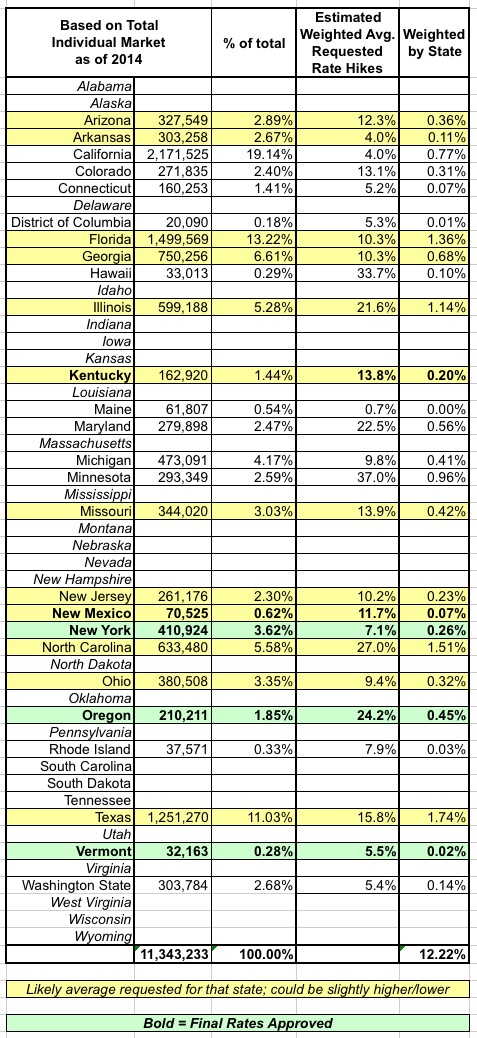
Again, massive caveats surround all 3 of these tables; if one or more of the missing large state not shown ends up with a massive overall hike, that could obviously skew the national average up dramatically. For these states (+DC) however, running the numbers all three ways seems to stay roughly within the same range: Somewhere between 12-13%.
Advertisement
