

CMS: Medicare enrollment over 65.5M as of February; Medicare Advantage reaches 48.3% of total
Fri, 06/09/2023 - 9:56am
Every month for years now, the Centers for Medicare & Medicare Services (CMS) has published a monthly press release with a breakout of total Medicare, Medicaid & CHIP enrollment; the most recent one was posted in late February, and ran through November 2022.
Since December 2022, however, they haven't sent out the normal press release; instead, they included a brief note leading to a Medicaid/CHIP data slideshow , along with another note leading to their new Medicare Monthly Enrollment database.
In any event, according to the spreadsheet I exported, as of February 2023:
- Total Medicare beneficiaries reached 65,644,810...up a mere 8,320 from January.
- Original Medicare beneficiaries stood at 33,957,566...down another 115K from January.
- Medicare Advantage beneficiaries reached 31,687,244...up 124K from January
- Enrollees 65+ reached 57,916,358 (down 3,940)
- Enrollees under 65 (for various disabilities) reached 7,728,452 (up 12,260)
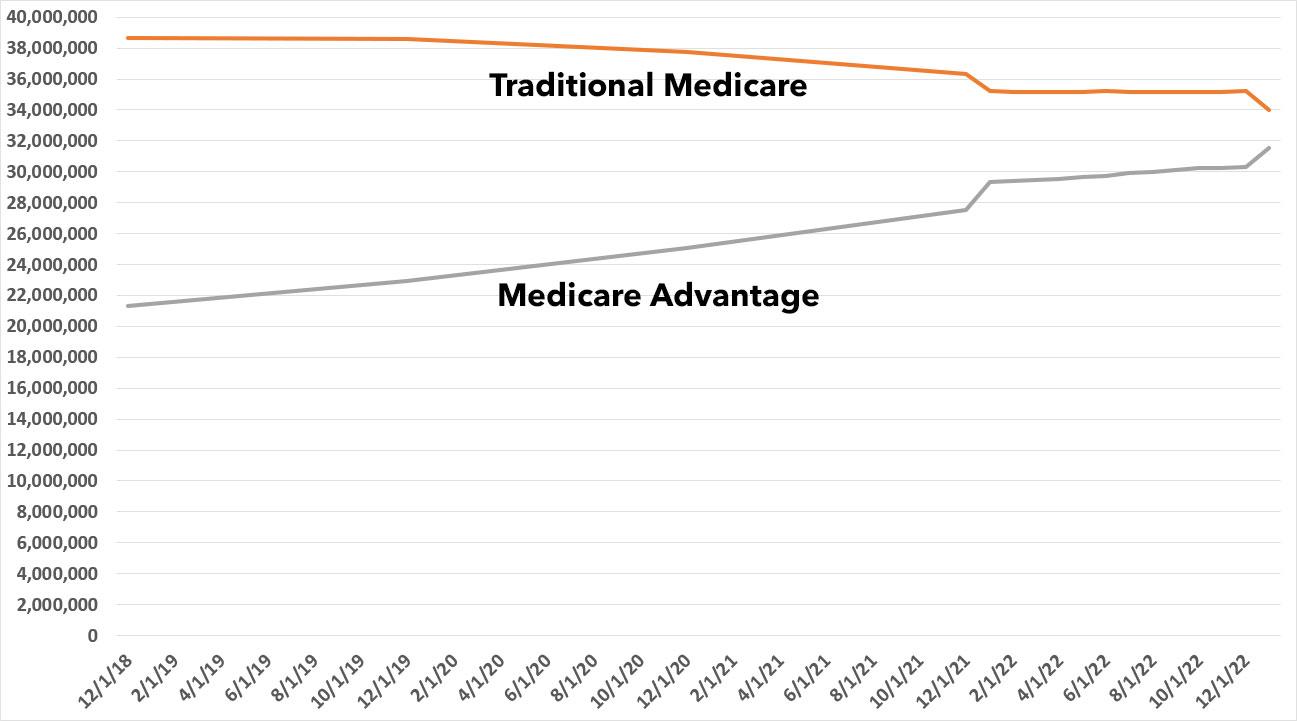
The most significant takeaway here is that traditional Medicare enrollment once again dropped while Medicare Advantage (MA) enrollment increased...putting MA enrollment at 48.3% of the total.
I've put together a simple graph showing how both Traditional Medicare and Medicare Advantage enrollment has changed over the past 4+ years. The trend is gradual for most of the year, but there were sudden jolts in January 2022 and January 2023. I'm assuming these were caused by hundreds of thousands of existing traditional Medicare enrollees choosing to switch to Medicare Advantage.
Medicare Advantage enrollment has increased from 35.5% of all Medicare enrollment to 48.3% as of February, and is clearly set to take over as the default path very soon...likely sometime this year. Obviously whether this is a good or bad thing depends on your perspective, but unless there are significant policy changes to one or both, it's pretty much inevitable.
Advertisement
