

A simple actuarial analysis revisited.
Tue, 10/26/2021 - 3:55pm
Back in early September, I wrote a post which gained quite a bit of attention in which I ran some back-of-the-envelope math to try and answer a question which is cold-hearted and tasteless...but which, nonetheless, many people across the political spectrum have been wondering: What will the real-world impact be on the 2022 midterm elections of the Red/Blue COVID divide?
There's a lot of factors which come into play here, including political messaging, narratives and the like, but let's be perfectly blunt: What people really want to know (whether they admit it or not...some have been cruder in posing the question than others) is whether more GOP or Dem voters are dying of COVID, and how much that will impact the midterms at the ballot box.
Make no mistake: Last year the Trump Administration was CLEARLY, and pretty openly, counting on a lot more Democrats dying to help them win the Presidential race......and even after he lost, in 2021 the vaccination effort has similarly been completely politicized by the Republican Party since the moment President Biden took office as well.
It's been about another 7 weeks since I first ran this analysis, which means we have 7 more weeks of data to work with. In addition, I now have updated 2020 election results for Alaska (at the time I only had the 2016 data), and I now have Florida's county-level COVID death data since June (Nebraska, unfortunately, has still been radio silent at the county level for the past few months).
So, as I noted in September...fine. Let's once again set our moral compass aside for a moment and look at this from an sheer "actuarial analysis" perspective.
Unlike the first time around, I'm not going to bother looking at COVID deaths through November 3rd, 2020...because for purposes of this analysis, they aren't terribly relevant. That doesn't mean those deaths don't matter, of course; it just means that in terms of those likely to vote in 2022, those who died prior to 11/03/20 have already been accounted for.
OK, so what about since 11/03/20?
Well, here's what the COVID death rate looks like from 11/03/20 - 10/24/21 by Trump vote percent. The total population of all 50 states + DC has been broken out into 10 brackets of roughly 33.1 million people apiece (none are exactly that number, but all are within a few hundred thousand). In all, around 495,000 Americans have died of COVID since Election Day 2020 (plus several thousand whose county of residence is unknown, along with some in Puerto Rico and other U.S. territories not included here).
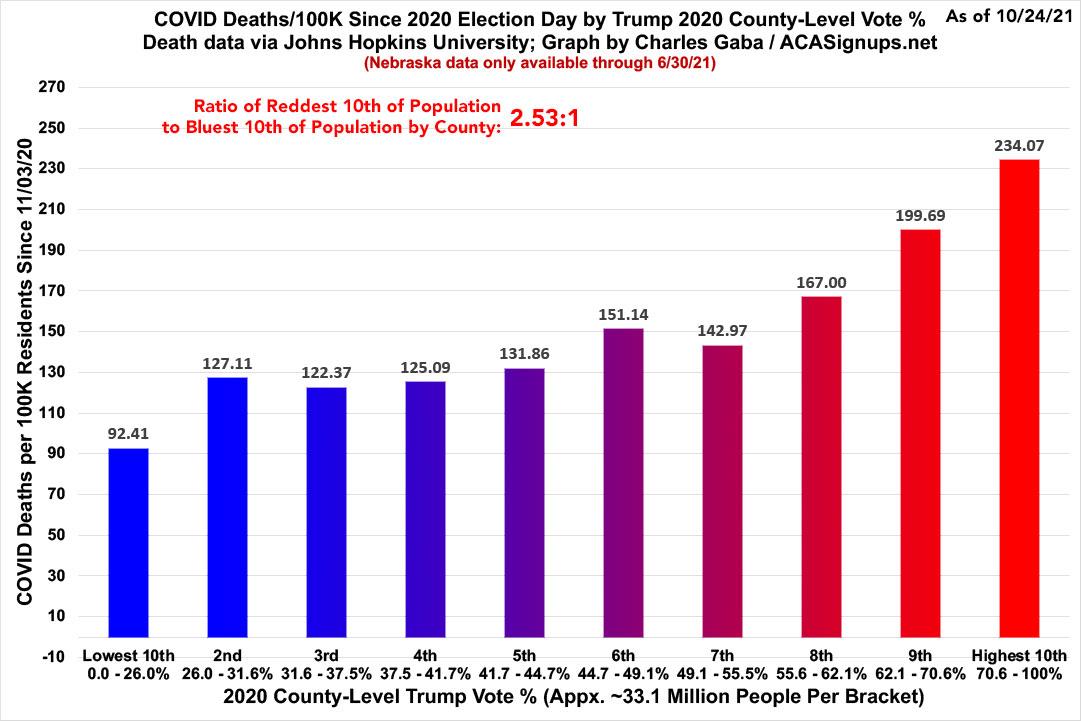
As you can see, since the 2020 election, the COVID death rate in the reddest tenth of the country has run a little over 2.5x higher than in the bluest tenth. The other 80% of the population generally falls in between in a fairly straightforward pattern.
Does this mean that 2.5x as many Republicans have died as Democrats since Election Day? Absolutely not.
First of all, that 2.5x ratio only holds true for the highest vs. lowest bracket. The ratios in between are far less dramatic.
Secondly, not every American who has died of COVID since last November is a voter. A small percentage are either under 18 or aren't U.S. citizens.
Even among those who are registered voters, total voter turnout among eligible voters last November was only around 66%...historically high, but that still removes a good 1/3 from the equation right off the bat (and of course midterm turnout is always lower than in Presidential election years).
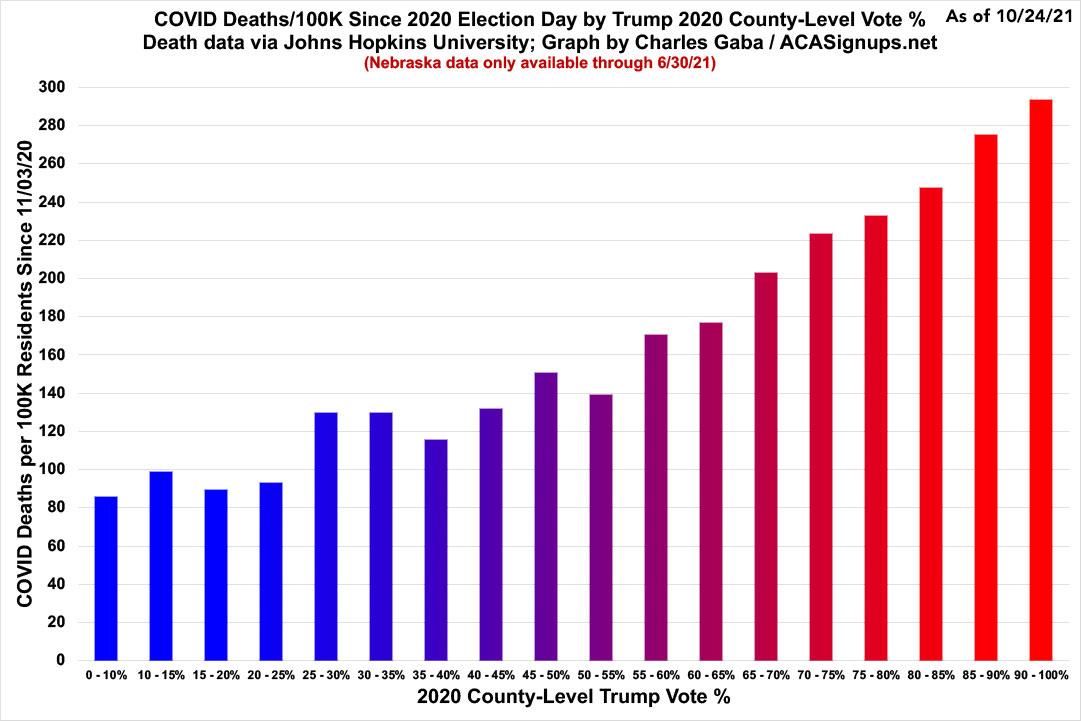
In order to try to estimate the breakout, here's a different version of the same data. There's two important difference here:
- First, I've broken the same ~331M Americans out into 18 brackets instead of 10 to allow for more granular data.
- Second, unlike the graph above, instead of making the population size roughly equal in each bracket, I'm instead splitting it into 5 percent Trump vote increments (I'm using 10% for the lowest and highest since there's barely anyone living in counties where he received under 5% or over 95%).
As a result, the population size of these brackets varies widely: The smallest has just 119,000 people, the largest has over 50 million. HOWEVER, the graph represents per capita data (deaths per 100K), so the bar heights are still accurate regardless of the actual population each represents:
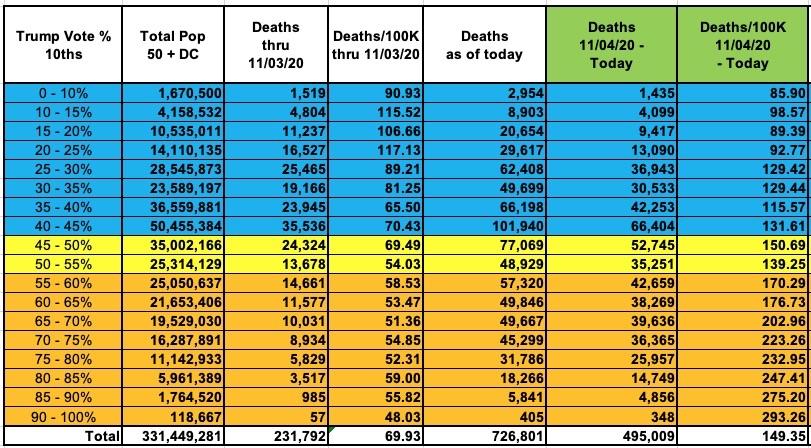
Here's what this data looks like in table format:
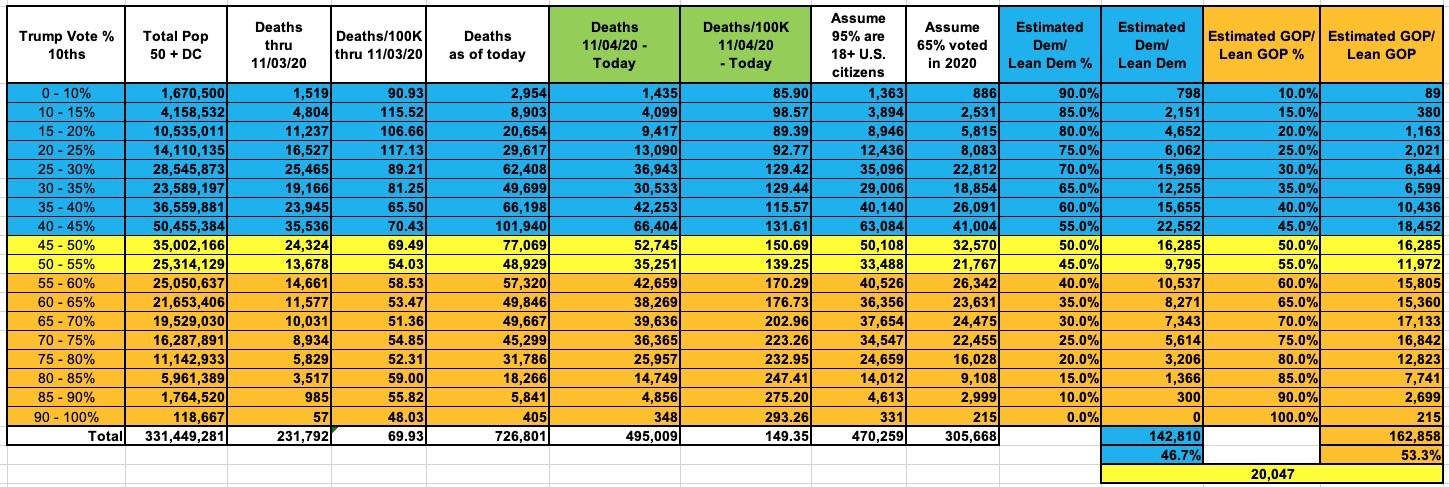
Next, we have to look only at those who voted in 2020. I'm assuming that around 95% were U.S. citizens over the age of 18, and that of those, around 65% voted last year. I know there are likely wide variants in both of these percentages from county to county, but I don't have the resources to dig that deep so this will have to do:
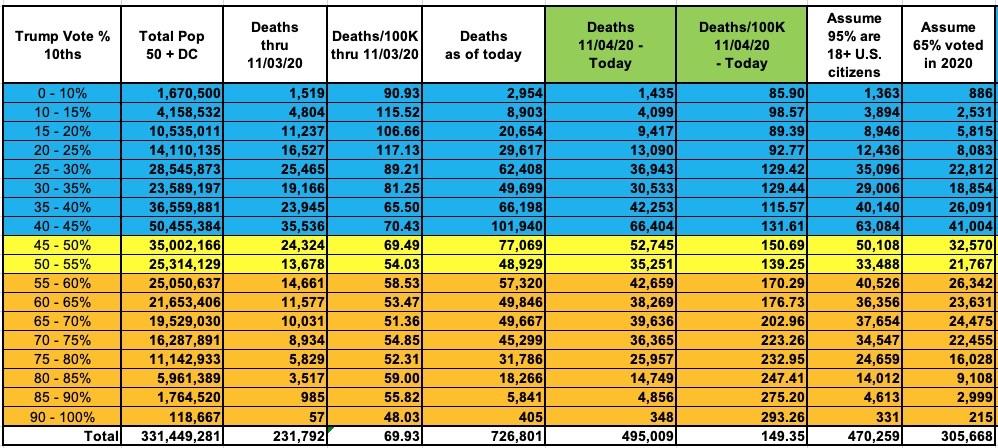
That leaves us with perhaps 306,000 Americans who actually voted last year who have died of COVID since Election Day.
Next comes the trickier part: How many of those ~306K voted GOP vs. Dem last year?
(Yes, I know some of them voted 3rd party and some split their ticket, but let's be honest: Only 1.8% of all Presidential votes went to a 3rd party, ticket-splitting is pretty rare, and the 2020 election represented the clearest contrast between what the major candidates and their respective parties stood for in my lifetime. It was about as clear and obvious a binary choice as I can fathom.)
I'm making two changes from my first attempt at this estimate: First, I'm eliminating the "swing voter" column entirely, since in the end, the vast majority of those voters did end up going with either Biden or Trump regardless. More importantly, I've decided to be more conservative with my estimates (conservative as in "cautious" not ideologically, of course). Here's what that looks like:
Here's what it looks like if I assume the GOP portion within each bracket is 5 points higher:
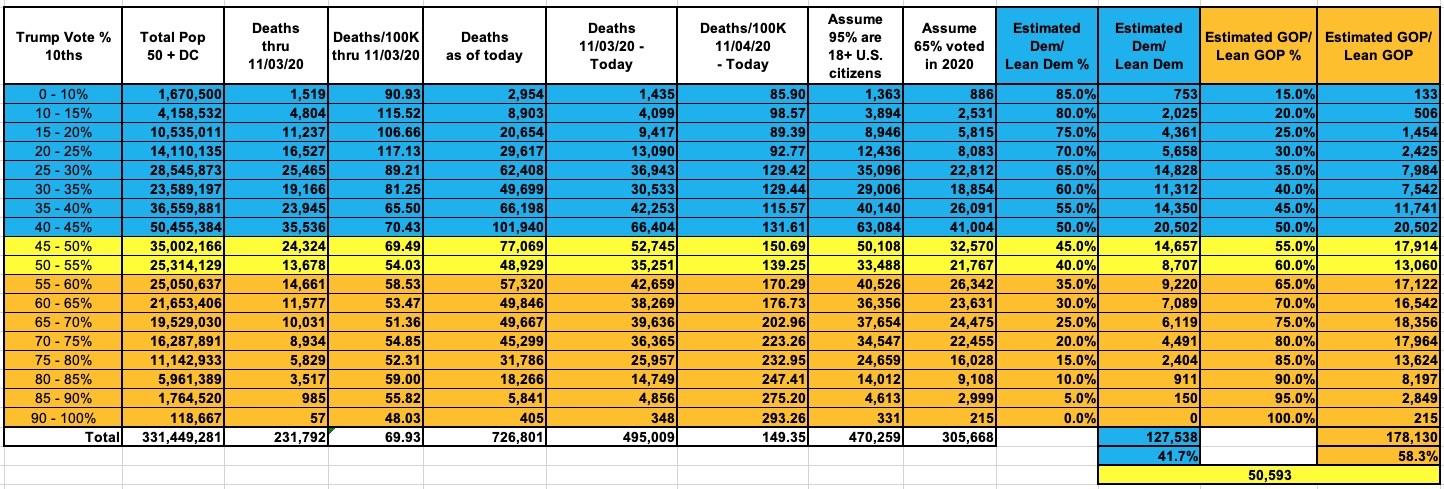
Assuming these are somewhere in the ballpark, it would mean that between 20,000 - 50,000 more Republican voters have died of COVID since Election Day 2020 than Democrats as of 10/24/21.
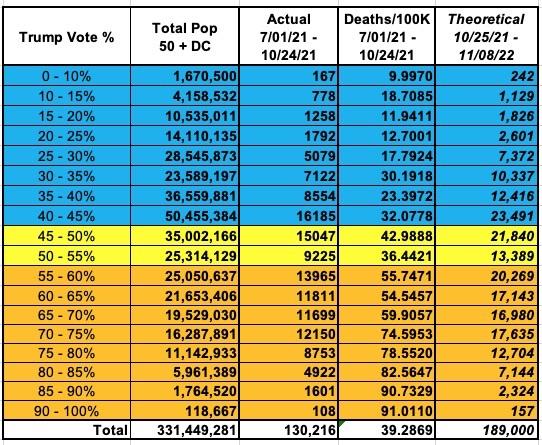
What about going forward between now and November 2022, however?
That's mostly an unknown, of course...but the biggest unknown is the total number of additional COVID deaths the nation is facing between now and then.
As of today, depending on your source, somewhere between 736,000 - 759,000 Americans have died of COVID cumulatively.
189,000 more between now and the 2022 midterms would average around ~500 per day. As depressing as that is to contemplate, it's entirely possible, given that the 7-day moving average is still over 1,100 as of this writing.
Let's further assume that the death rates within each of the 5-point brackets remains the same as it's been throughout the Delta Variant wave since the end of June:
If this proves to be the case...and if you assume the same partisan breakout within each bracket...the full 2-year period from the 2020 election through the 2022 midterms would look something like the following:
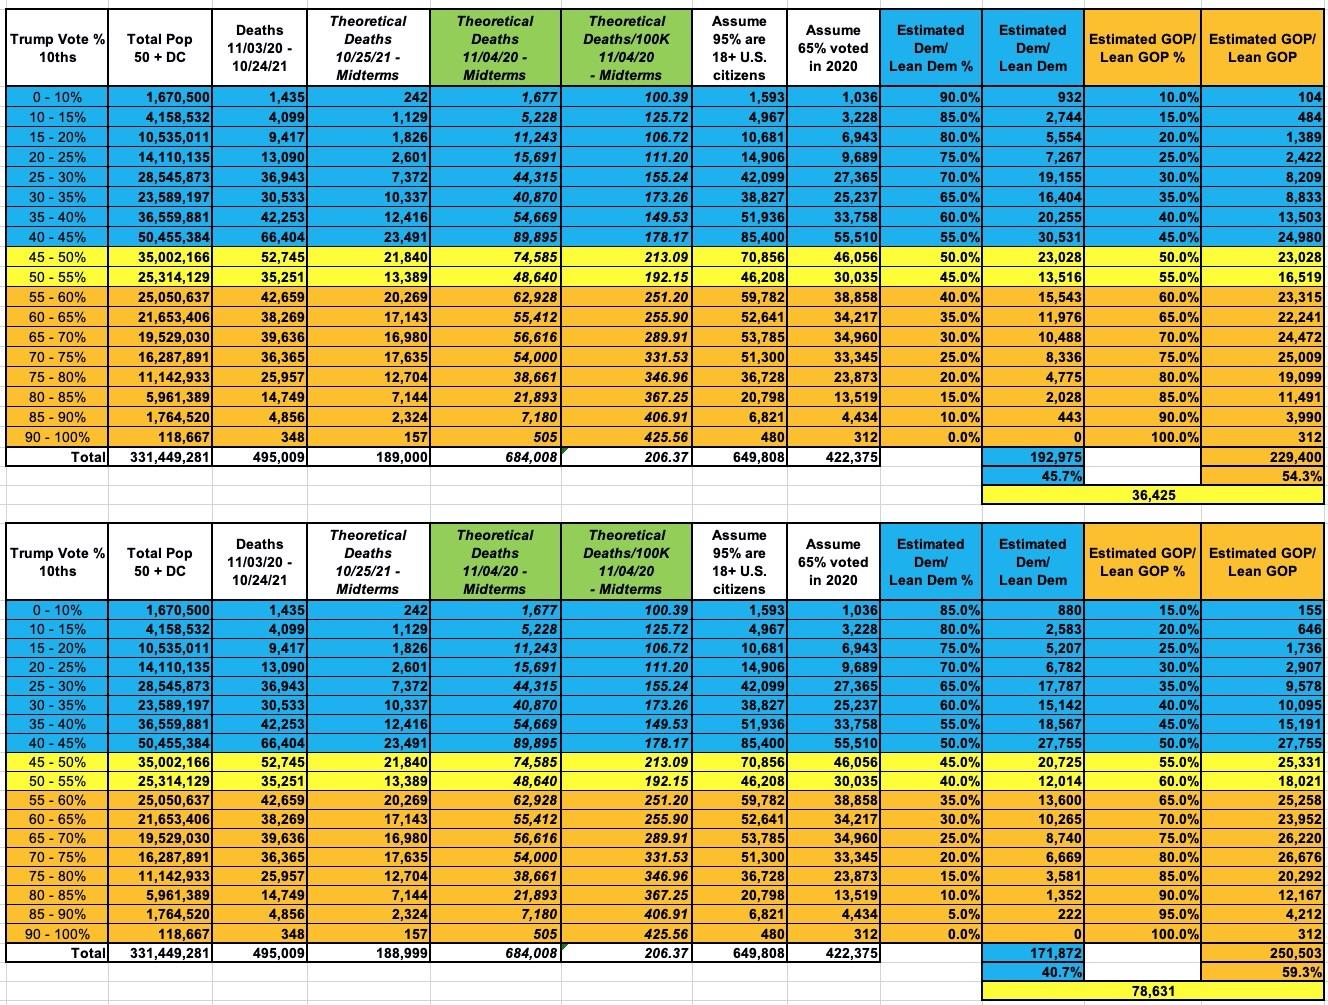
Assuming these are somewhere in the ballpark, it would mean that between 36,000 - 78,000 more Republican voters will have died of COVID since Election Day 2020 than Democrats by the midterms.
The rest of this blog post is basically a repeat of the one from September.
Now, you would think that this would cause Republican leadership to be deeply concerned...but they clearly aren't.
Why not?
In 1991, there was a great little courtroom drama directed by Michael Apted called "Class Action" starring Gene Hackman and Mary Elizabeth Mastrantonio:
The story is about a lawsuit concerning injuries caused by a defective automobile. The suit takes on a personal dimension because the injured plaintiff's attorney, Jedediah Tucker Ward discovers that the automobile manufacturer's attorney is his estranged daughter Maggie Ward.
...The auto manufacturer in the film also utilizes a "bean-counting" approach to risk management, whereby the projections of actuaries for probable deaths and injured car-owners is weighed against the cost of re-tooling and re-manufacturing the car without the defect (exploding gas tanks) with the resulting decision to keep the car as-is to positively benefit short term profitability.
Class Action's plot wasn't technically based on the infamous Ford Pinto scandal, but it sure as hell is analogous to it.
There's a particularly chilling scene in which Mastrantonio's character, who's actually defending the auto company in the lawsuit, privately asks one of the safety test executives at the company (played by Fred Dalton Thompson) why they didn't simply replace the faulty part in the first place:
Maggie: May I ask a question, please?
Getchell: Sure.
Maggie: Why didn't you just change the blinker circuit? It's just a question.
Getchell: I told Flannery about the problem a month or so before he died. He called in his head bean counter.
Maggie: What's that? Risk management expert, right?
Getchell: Yeah. Flannery shows him the data and asks him how much it would cost to retrofit...
Maggie: You mean recall?
Getchell: Yeah, you got it. To retrofit 175,000 units. Multiply that times 300 bucks a car, give or take. You're looking at around $50 million.
So the risk guy, he crunches the numbers some more. He figures you'd have a fireball collision about every 3,000 cars.
That's 158 explosions. Which is almost as many plaintiffs as there are. These guys know their numbers.
So you multiply that times $200,000 per lawsuit. That's assuming everybody sues and wins. 30 million max.
See? It's cheaper to deal with the lawsuits than it is to fix the blinker.
It's what the bean counters call a simple actuarial analysis.
This is perhaps the most cynical thing I've ever typed in a blog entry, but there's no getting around it:
GOP leadership, FOX News, Trump/MAGA etc don't appear to care how many of their own voters die as long as they damage President Biden's approval rating in the process.
While I'm sure they'd much rather every person who dies of COVID be a Democrat, losing another ~250,000 of their own supporters appears to be a small price to pay if it results in them flipping control of the House and/or Senate next year.
Furthermore, while that may sound like a high number, keep in mind that most of those either live in areas which are already pretty Blue or solidly Red to begin with. A GOP Congressperson used to winning with 75% of the vote isn't going to lose much sleep over that number being knocked down to 70% or even 65%.
There may be a handful of swing districts which will be decided by just a few hundred votes where it ends up making a difference...but if losing ~250,000 more GOP voters (mostly in safe red or safe blue districts) results in a couple million independent/swing voters flipping back to the GOP (or at least not bothering to vote at all) because "Biden said he'd stop the pandemic and he hasn't" etc etc, then that would still result in a net gain for Team Red.
And sure enough (via CNN), so far it's playing out exactly as they're hoping:
An ABC News/Washington Post poll conducted at the end of August found 52% of respondents approve of how Biden is handling the pandemic, a 10-point drop from June. Still, more respondents said they approved of his handling of Covid than disapproved.
At the same time, Biden's overall approval has slipped into negative territory amid a chaotic withdrawal from Afghanistan and the Delta variant's drag on the economic recovery. The President's aides view combating the pandemic as the single most important issue of his presidency, and the one that will determine his political fate.
Get vaccinated. Wear a mask.
To retrofit 175,000 units. Multiply that times 300 bucks a car, give or take. You're looking at around $50 million.
So the risk guy, he crunches the numbers some more. He figures you'd have a fireball collision about every 3,000 cars.
That's 158 explosions. Which is almost as many plaintiffs as there are. These guys know their numbers.
So you multiply that times $200,000 per lawsuit. That's assuming everybody sues and wins. 30 million max.
See? It's cheaper to deal with the lawsuits than it is to fix the blinker.
It's what the bean counters call a simple actuarial analysis.
Here's the exact scene in question on YouTube; it's not great quality but it drives home the point. Ironically, former GOP Senator Fred Dalton Thompson plays Getchell:
Advertisement
