

Time to check in on the OFF-Exchange ACA Indy Market...(updated)
Wed, 10/27/2021 - 1:00pm
Back in September, the Centers for Medicare & Medicaid Services (CMS) issued several reports which touted the success of the 2021 COVID Special Enrollment Period. Thanks in part to enrollment being re-opened but mostly to the dramatically expanded financial aid provided by the American Rescue Plan (ARP), over 2.8 million additional Americans signed up for 2021 healthcare coverage via the ACA exchanges nationally.
This came on top of the 12.0 million who had already enrolled during the official 2021 Open Enrollment Period from November 1st, 2020 - January 31st, 2021. All told, that's 14.8 million Americans who selected Qualified Health Plans (QHPs) via the exchanges through mid-August.
Of course, the individual market has a high churn rate; many people also drop their coverage mid-year for a variety of reasons, such as moving to Medicare when they turn 65; moving to employer-based coverage if they get a new job with benefits; moving to Medicaid if they see an income drop (or if they live in Missouri & have an income between 100 - 138% of the Federal Poverty Line, or FPL); moving to their spouse's employer coverage when they get married; and so forth.
As a result, CMS data showed the number of effectuated enrollees in on-exchange ACA-compliant individual market coverage as being 12.2 million as of August 2021.
OK...but there's an important clarifier above: ON-EXCHANGE. This doesn't include OFF-exchange ACA-compliant coverage. In all 50 states (DC is the sole exception), if you want to enroll in an ACA policy, you don't have to enroll on exchange...as long as you're willing to pay full price for the policy.
PRIOR to the American Rescue Plan, there were some people going off-exchange made sense for:
- Those 100% certain that they were gonna earn more than 400% FPL in the coverage year (guaranteeing that they wouldn't be eligible for ACA subsidies) might decide to avoid a bit of additional paperwork by enrolling off-exchange.
- Some carriers in some states offer some ACA-compliant policies which are only available off-exchange, which might be more appropriate for certain enrollees than the on-exchange offerings.
- Since 2018, some people who can afford full price have been better off enrolling in an off-exchange Silver ACA plan in order to avoid the "Silver Loading hit." This is a thing thanks to a special pricing strategy I've dubbed the "Silver Switcharoo."
- Undocumented immigrants aren't allowed to enroll on-exchange at all. I don't just mean that they aren't eligible for financial subsidies; I mean they can't enroll on-exchange even at full price, which I actually find rather strange, but whatever.
- There's also the Individual Coverage Health Reimbursement Arrangement (ICHRA) program, which is an alternative to traditional employer coverage. I'm not gonna get into the details of ICHRAs here (it gets kind of wonky), but in some cases ICHRAs require employees to be enrolled in an off-exchange plan in order to qualify for the financial benefits. This is one of the few healthcare-related programs put into place by the Trump Administration which kind of, sort of makes sense.
SINCE the ARP was signed into law, however--and especially if the expanded subsidies of the ARP are extended beyond 2022 and potentially even made permanent by the Build Back Better Act--enrolling in an off-exchange plan has made no sense at all for most of the folks described above.
Undocumented immigrants still don't have on-exchange as an option, of course...but the expanded ARP subsidies have pretty much mooted the other bullets. The 400% FPL subsidy cliff has been eliminated (at least for 2022, anyway), and the subsidy formula has been dramatically beefed up to the point that it wipes out any "Silver Switcharoo" advantage for the vast majority of enrollees. I suppose it's still possible that some off-exchange-only plans have a very specific provider network or formulary for certain enrollees which isn't available on-exchange, but that's about it.
The off-exchange market was already shrinking long before the ARP was passed. Most of this happened way back in 2014-2015 as millions of people shifted from off-exchange to on-exchange plans (again, in large part to qualify for financial assistance), but as the Kaiser Family Foundation reported, it continued to shrink each year that followed as well, from ~4.9 million in 2015 to just ~2.1 million in 2019.
What about since then? There've been several major developments over the past 2 years, of course: The COVID-19 pandemic completely disrupted the healthcare industry; Joe Biden and his healthcare policies have replaced Donald Trump & his; and of course the passage of the American Rescue Plan, which also included (besides vastly expanded ACA subsidies) other provisions such as the Unemployment Benefit which lets those receiving UI benefits qualify for a $0-premium "Secret Platinum" ACA plan.
To get an estimate of where things stand as of today--including a breakout by state!--I'm gonna use two different sources. The first is Mark Farrah Associates:
Mark Farrah Associates is a leading data aggregator and electronic publisher of business information and analytics for the U.S. healthcare industry.
Mark Farrah recently posted this update about the TOTAL individual market:
Individual, Non-Group
Although the individual market has had its share of challenges throughout the years, the segment has remained relatively stable throughout the pandemic. Some insurers even increased their geographic footprint for ACA-compliant plans. In June 2021, health insurers reported total individual, non-group coverage for over 16.1 million people, this represents a 4.8% increase, or 734,000 members, from 15.4 million in June 2020. This is the second year in a row with a year-over-year increase.
OK, so that's 16.1 million as of June. The on-exchange portion was 12.2 million as of August, so I'm guessing it was perhaps ~11.5 million or so in June. That would make the off-exchange portion roughly ~4.6 million, a dramatic increase since 2019!
HOWEVER...there's a problem with Mark Farrah's total figure: As they had noted in a prior update in September:
It is important to note that Mark Farrah Associates (MFA) applied enrollment figures for select carriers not required to report health enrollment on a quarterly basis and made other adjustments based on market analysis. Furthermore, individual enrollment includes short term plan enrollees and may include Medicaid programs, such as CHIP, as some states include subsidized lines in the individual segment. These factors may have resulted in moderate understatement or overstatement of enrollment.
The quarterly adjustments likely cancel each other out, but lumping Short-Term, Limited Duration Plans (STLDs) (up to 3 million people?) and some CHIP enrollees (up to 6.9 million children nationally) in with ACA-compliant plans makes this figure pretty suspect.
Let's put a pin in that for a moment and look at Mark Farrah's September report, which breaks the numbers out by state. Oddly, the September report puts the June total market enrollment at 15.9 million total, 200K fewer than the more recent report even though they both refer to June enrollment. Huh:
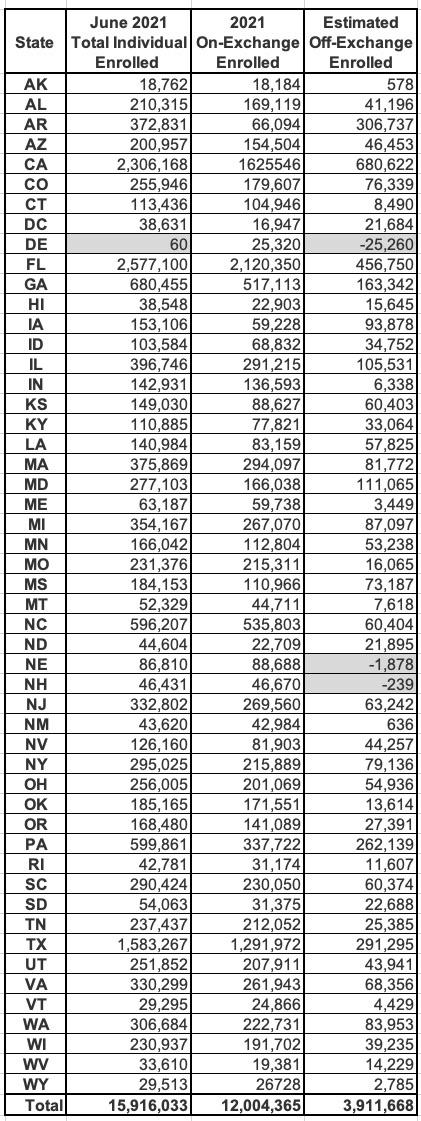
Hmmm...even if you accept that the grand total includes Short-Term Plan and CHIP enrollment in some states, there's another major problem with this table, and I'm not talking about the obvious glitch in Delaware or Farrah's claim that there's negative off-exchange enrollment in Nebraska and New Hampshire.
The problem is this: That second column refers to the total number of QHP selections made during the 2021 Open Enrollment Period, not the number of people actually enrolled. Even then, the 12.0 million on-exchange figure refers to the total as of January 31st, not as of June 30th.
I can't match the dates exactly since the CMS effectuation report was as of August, not June, but that's as close as I can get (I've also sorted the states alphabetically by their full names instead of the abbreviations):
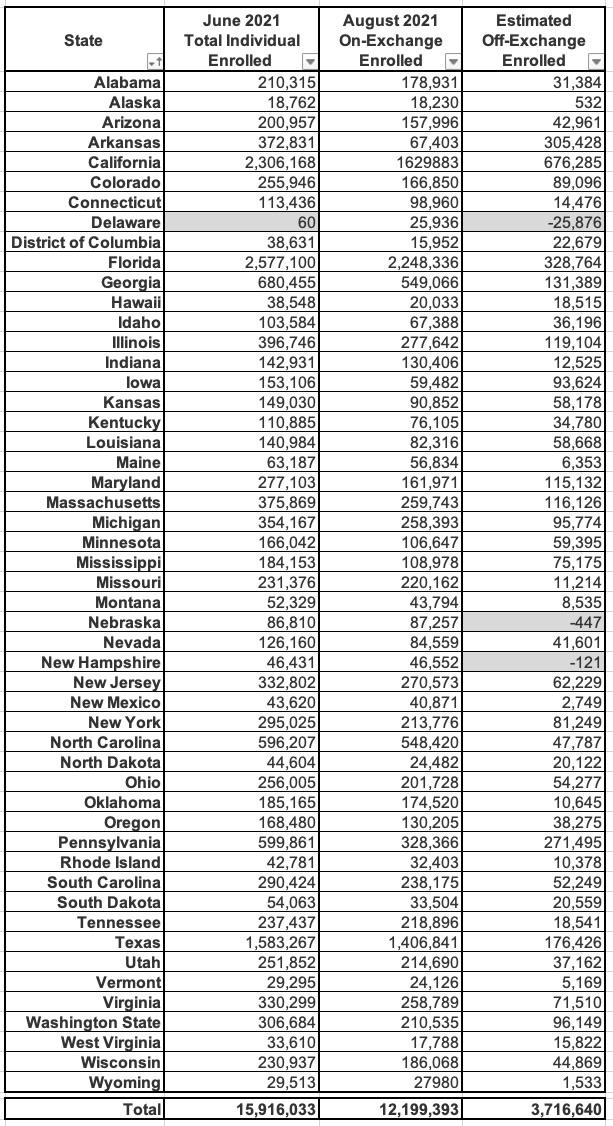
This leaves the total off-exchange number including STLDs and some CHIP enrollees at around 3.72 million. Again, without knowing what portion of the total is made up of those groups, this still isn't terribly helpful.
Instead, let's look at this from a different angle. Every summer/fall I dig through the annual rate filings for every carrier offering ACA individual market plans the upcoming year. As part of this process, they're required to submit paperwork which gives the number (or a close estimate) of just how many people were currently enrolled in their ACA policies as of a certain point during the current year. I use this number in order to run weighted averages for the preliminary and approved annual rate changes.
This isn't an exact thing, unfortunately, for several reasons: First, the data is usually as of March or April 2021, not June or August. Also, some states protect the carrier enrollment data as a trade secret; some states (or the carriers? I'm not sure who to blame) may not actually redact the data but make it difficult to track down even in the "public" SERFF database. Some carriers leave out current enrollees if the rate changes don't apply to certain plans, and if a carrier drops out of a state entirely I don't think their filing forms will be listed at all.
However, in 2022, the trends have been completely the opposite direction: Most carriers are expanding the number of counties and states that they're participating in, and I'm pretty sure the vast majority of them are making some sort of change to all of the plans they offer, so this should be pretty close to a comprehensive look.
Finally, there's seven states where I simply couldn't get ahold of the hard enrollment numbers at all due to redactions/trade secret protection. For those states (which unfortunately include three of the largest...Florida, Texas & Illinois, as well as Kansas, Mississippi, Wisconsin & Wyoming), I've had to bite the bullet and rely on Mark Farrah's estimates.
This method has a longer list of caveats & gaps than Mark Farrah's data, but at least it eliminates the STLD/CHIP issues. Here's what it looks like:
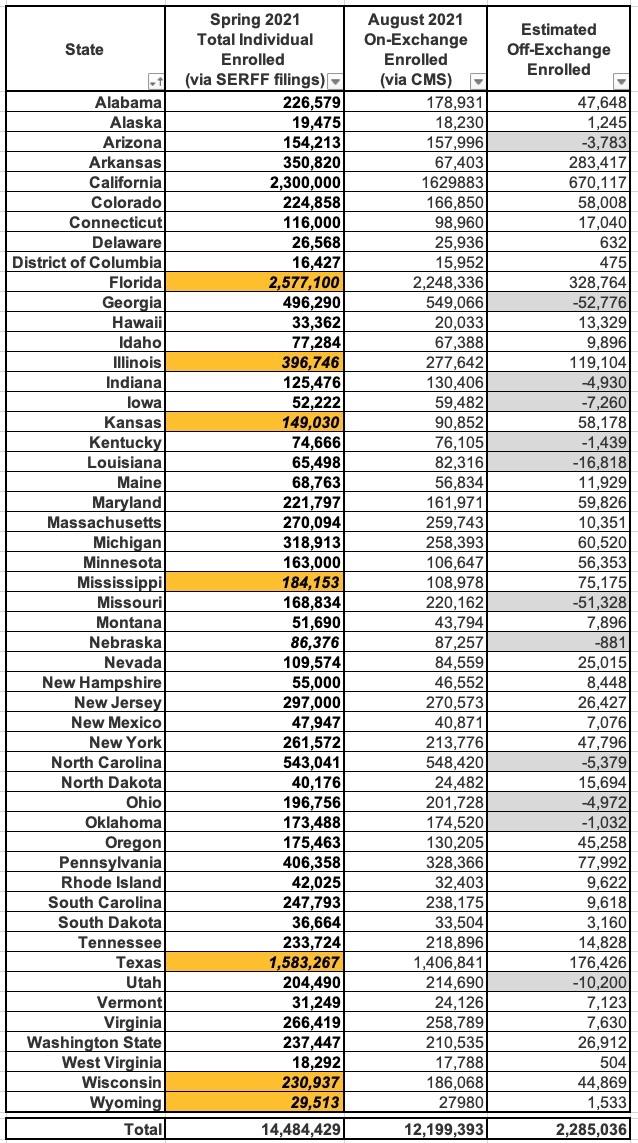
I've highlighted the states which rely on Mark Farrah estimates in orange. As you can see, this cuts the total ACA-compliant market estimate down from 15.9 million to 14.5 million, and the off-exchange estimate from 3.7 million to 2.3 million, which seems a lot more likely given the ~2.1 million estimate by Kaiser two years ago.
It also resolves the "negative off-exchange" data glitch for Delaware and New Hampshire...but simultaneously creates this problem for a bunch of other states (in gray).
The best way I can think of to square this circle is to use the Mark Farrah estimates for those states as well, which gives a sort of blended overall estimate between the two:
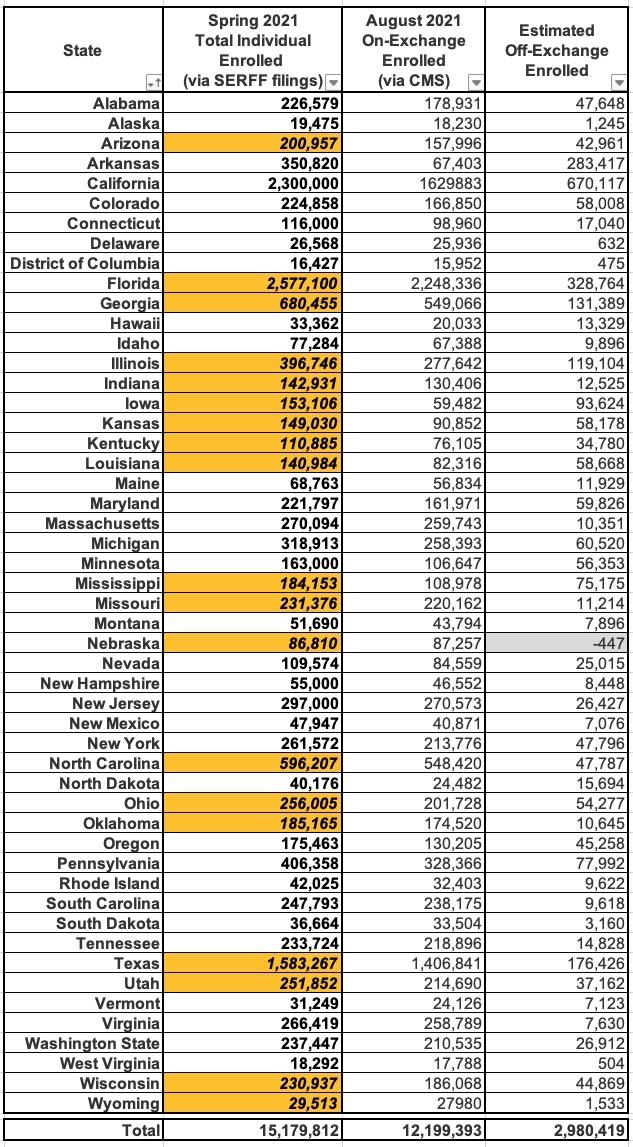
Assuming this is fairly accurate, it puts the total ACA-compliant individual market as of Summer 2021 at 15.2 million people, with 12.2 million on-exchange and around 3.0 million off-exchange nationally.
My best guess is that the actual total number of off-exchange enrollees as of the June - September 2021 period is likely somewhere in between the 3rd and 4th estimates above: 2.3 - 3.0 million. Interestingly, no matter where it stands along that range it would still be higher than Kaiser's 2019 estimate of 2.1 million. This suggests that:
- Silver loading has stopped and/or possibly even reversed the drop in off-exchange enrollment over the past couple of years; and/or...
- ICHRA enrollment has ramped up more than I thought, or...
- OFF-exchange enrollment also saw a small spike during the Special Enrollment Period, which doesn't make any sense to me given that subsidies are only available on-exchange and have been vastly expanded, but I suppose it's possible.
If anyone has better data for any of the states, by all means, feel free to let me know.
UPDATE 10/28/21: Hmmmm...judging from some responses by various trusted health insurance industry folks, it sounds like ICHRAs picking up steam may indeed account for a major chunk of the recent uptick. This is all anecdotal so far; no hard numbers as of yet, but it's definitely something to keep an eye on.
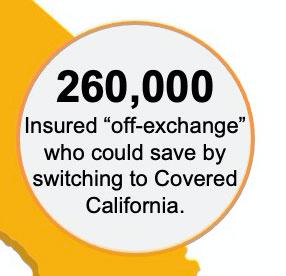
UPDATE 11/02/21: Just a quick note...in their powerpoint presentation touting the 2022 Open Enrollment Period and dramatically expanded financial subsidies, Covered California says that of the ~670K off-exchange indy market enrollees statewide, around 260,000 would be eligible for those subsidies if they shifted to an on-exchange plan, or around 38% of them.
Advertisement
