

Breaking: 528,000 new HC.gov #ACA enrollees via COVID SEP thru 3/31; 3x higher than avg.
Wed, 04/07/2021 - 10:25am
Note: A few weeks ago, I ran a rough back-of-the-envelope extrapolation of partial data from the first 2 weeks of the ongoing COVID Special Enrollment Period and concluded that IF enrollment via the 36 HealthCare.Gov states was representative nationally, and IF the pace of the last 2 weeks of February held perfectly steady, it would mean around 666,000 new enrollees via HC.gov and 832,000 nationally by the end of March. Those were two pretty big caveats, of course, and as you'll see below, the reality wasn't quite as eyebrow-raising, though it's still pretty impressive.
This just in via the Centers for Medicare & Medicaid Services (CMS):
2021 Marketplace Special Enrollment Period Report
February 15 – March 31, 2021
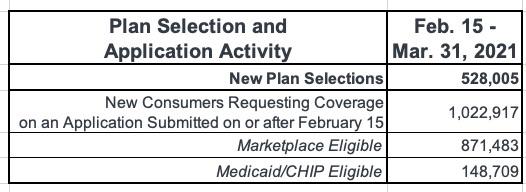
The Centers for Medicare & Medicaid Services (CMS) report that over 528,000 Americans signed up for health insurance from the start of the 2021 Marketplace Special Enrollment Period (SEP) for consumers in HealthCare.gov States through March 31, including approximately 322,000 signups from March 1 to March 31.
The number of people signing up for health insurance from the start of the SEP opportunity on February 15 through March 31 represents a substantial increase from 2020 and 2019, when 209,000 and 171,000 consumers signed up for health insurance respectively.[1] In previous years, SEPs were available only for qualifying life events, whereas this year the Biden Administration opened a SEP to all Americans in response to the COVID-19 Public Health Emergency.
Data suggest a more diverse set of American consumers are enrolling in health insurance coverage through the SEP. Of enrollees who identified a race from February 15 through March 31, 17% identified as Black, compared to about 11% during the same period in both 2020 and 2019. In addition, lower income Americans represent a larger percentage of new plan selections so far during the SEP compared to prior years. Among consumers requesting financial assistance, 41% have a household income between 100% and 138% of the federal poverty level, compared to 38% in 2020 and 33% in 2019.
Definitions and details on the data are included in the glossary at the end of the report.
It's important to keep in mind, as noted in the footnotes at the link, that Nevada moved to their own state-based ACA exchange ahead of the 2020 Open Enrollment Period, and both Pennsylvania and New Jersey moved to their own exchanges ahead of the 2021 OEP. Those three states are therefore not included for any of the 3 years listed.
Here's the data across all 36 HC.gov states:
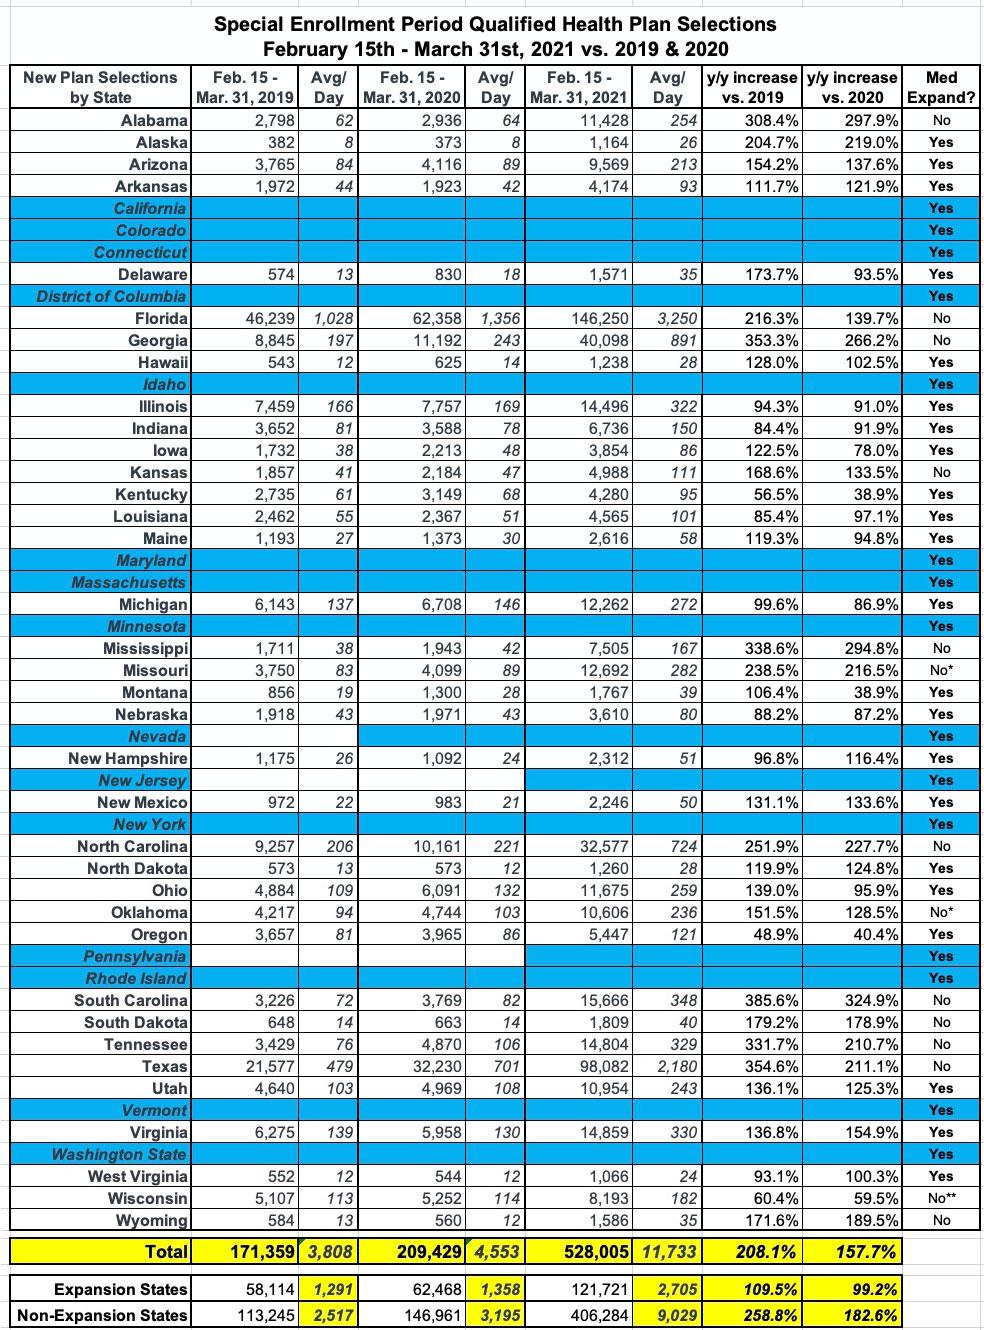
As you can see, total SEP enrollment for the full 2/15 - 3/31 period for the same states averaged 3.1x higher compared to 2019, and 2.6x higher compared to 2020. 2019 is the more accurate year to compare against if you're looking at the pre-COVID era, since the last 2 weeks of March 2020 almost certainly included a significant spike in traditional SEP enrollment due to people starting to lose their jobs as pandemic shutdown policies started to take hold.
Technically, 2021 SEP enrollment is running 2.8x higher than the average of 2019 & 2020 combined, but if you take that late-March COVID surge from last March into account, it's more like 3x higher than under normal circumstances, or roughly 11,700/day across the 36 HC.gov states.
There's some other important things to keep in mind:
- First: As clearly noted in the press release, these 528,005 enrollees are new to ACA exchange coverage. This does not include "switchers"...that is, current exchange enrollees who switched to a different exchange plan.
- Second: Again, this only includes 36 states, which only represented around 69% of total 2021 OEP enrollment. If you extrapolated this out evenly to include the other 15 states, it'd come to more like 765,000 nationally.
- However, since all 15 of the states which operate their own ACA exchange also expanded Medicaid, the odds are that they saw a significantly smaller SEP enrollment (since anyone below the 138% FPL threshold would be moved onto Medicaid instead). If you assume HC.gov comprises ~80% of all SEP enrollments this year, the national total is likely closer to 660,000 through 3/31.
- Third: Remember, everyone who enrolled through 3/31 did so before the American Rescue Plan-expanded subsidies went live via HC.gov. The ARP wasn't even signed into law until March 12th, and while lots of people no doubt heard about the expanded subsidies prior to 4/01, they didn't actually appear on the HC.gov subsidy tool until April 1st.
- In addition, while HHS/CMS did start advertising the COVID SEP back in mid-February, they didn't really start ramping it up until 4/01 either (which makes sense...it wouldn't be wise to advertise improved savings when those savings weren't actually available at the website yet).
In other words, I strongly suspect that while the first six weeks of the 2021 COVID SEP saw 3x as many people #GetCovered as you'd typically expect during the same time period, the second six weeks could easily be 4x - 5x higher.
Oh yeah, one more thing: Last summer I debunked the Trump Administration's defense of not opening up a COVID SEP by noting that...
CMS is bragging about how normal SEP enrollment is still up 188,000 people from 2019 even without an "open" COVID-19 SEP being offered, so everyone should STFU and leave them alone already.
The problem with this is that, as I noted earlier, if CMS had offered a 60-day "open" COVID SEP this spring, they likely would have enrolled up to 630,000 more people. There's some overlap between these numbers, of course, since some of those who are eligible for a normal SEP would have "used" the COVID SEP instead if one had been offered...but even if every one of those 188,000 people did just that, I'd estimate that at least 440,000 more would have utilized the COVID SEP on top of this.
Today's HC.gov SEP report only includes 45 days. If you take my 630K estimate from a year ago and lop it down from 60 to 45 days, it'd be roughly 473,000 new HC.gov enrollees over the same time period. Just saying.
UPDATE: I've gone back and broken the 36 HC.gov states out by Medicaid expansion status as well. As I expected, states which have expanded Medicaid only saw 2021 SEP enrollment increase by 2.1x over 2019 and 2x over 2020, but SEP enrollment in non-expansion states is 3.6x higher than in 2019 and 2.8x higher than in 2020.
The HC.gov state with the highest increase over the pre-COVID era is South Carolina, which saw SEP enrollment increase by 4.8x and 4.2x respectively, while the states with the lowest increase are Oregon (49% increase over 2019) and Kentucky (39% increase over 2020). Needless to say, both of these are expansion states.
Wisconsin is, as always, a special case: They haven't technically expanded Medicaid under the ACA, but they have expanded traditional Medicaid up to the 100% FPL threshold.
Advertisement
