Colorado releases further 2019 OEP data; adds 1,100 to their official enrollment total
Back in mid-January, Connect for Health Colorado released their semi-final 2019 Open Enrollment Period report:
By the close of this year’s Open Enrollment, Coloradans had selected 169,672 medical insurance plans, which compares to 165,777 medical plan selections for the 2018 Open Enrollment period.
Hmmm...I'll have to look into these numbers a bit further. Colorado's 2018 Open Enrollment total was indeed 165,777 according to C4HCO...but according to CMS's official report it was only 161,764 QHP selections. This is the same thing which happened last year, when C4HCO reported 172,361 QHPs vs. CMS's 161,568. It's therefore possible that the final/official 2019 CMS report will put Colorado's total around 4,000 enrollees lower than my own numbers.
However, either way, Colorado joins Massachusetts in increasing their ACA open enrollment numbers every year for five years straight, bucking the national trend!
It's also worth noting that Colorado's final total may still increase by a few hundred more (?) due to their "in line by midnight" policy announced yesterday.
Among the 2019 plan selections, 21 percent are by customers who are new to Connect for Health Colorado and 79 percentare renewing customers.
Well, apparently it was more than "a few hundred more". They posted this update a week or so ago:
Now that our sixth Open Enrollment Period has closed, we are excited to share data about who enrolled and from what part of the state. Our staff are busy crunching numbers. We will release our official Open Enrollment Report by mid-March.
While we are doing all of our calculations, this week, we shared some high-level data with our Board of Directors that you may find interesting:
- 170,741 medical plan submissions for the 2019 Open Enrollment Period – up 2% from 2018 Open Enrollment Period
- 22% new customers and 78% renewing customers
- 77% of customers applied for and will receive financial assistance – up from 69% in 2018
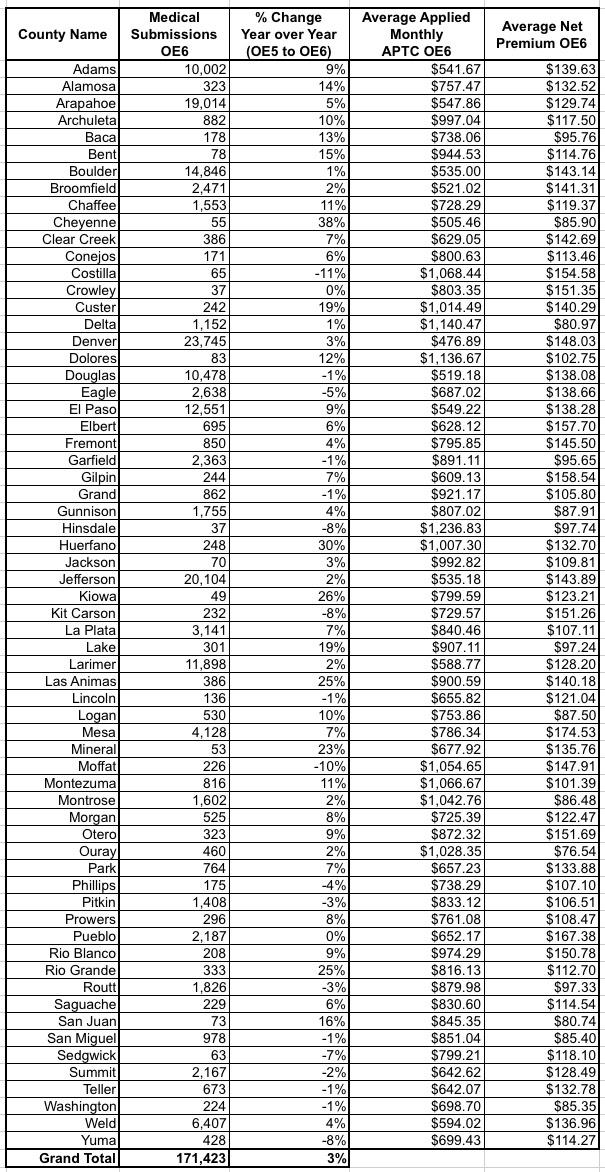
We also shared specific county-by-county data.
Yup, that's 1,069 higher than the prior tally. In addition, the new/renewal ratio shifted slightly, from 21/79% to 22/78%. The new total is actually 5.5% higher than CMS's official 2018 OEP total, but until they release the 2019 report I don't know how close that'll be.
Here's the county-level breakout referred to above:
How to support my healthcare wonkery:
1. Donate via ActBlue or PayPal
2. Subscribe via Substack.
3. Subscribe via Patreon.


