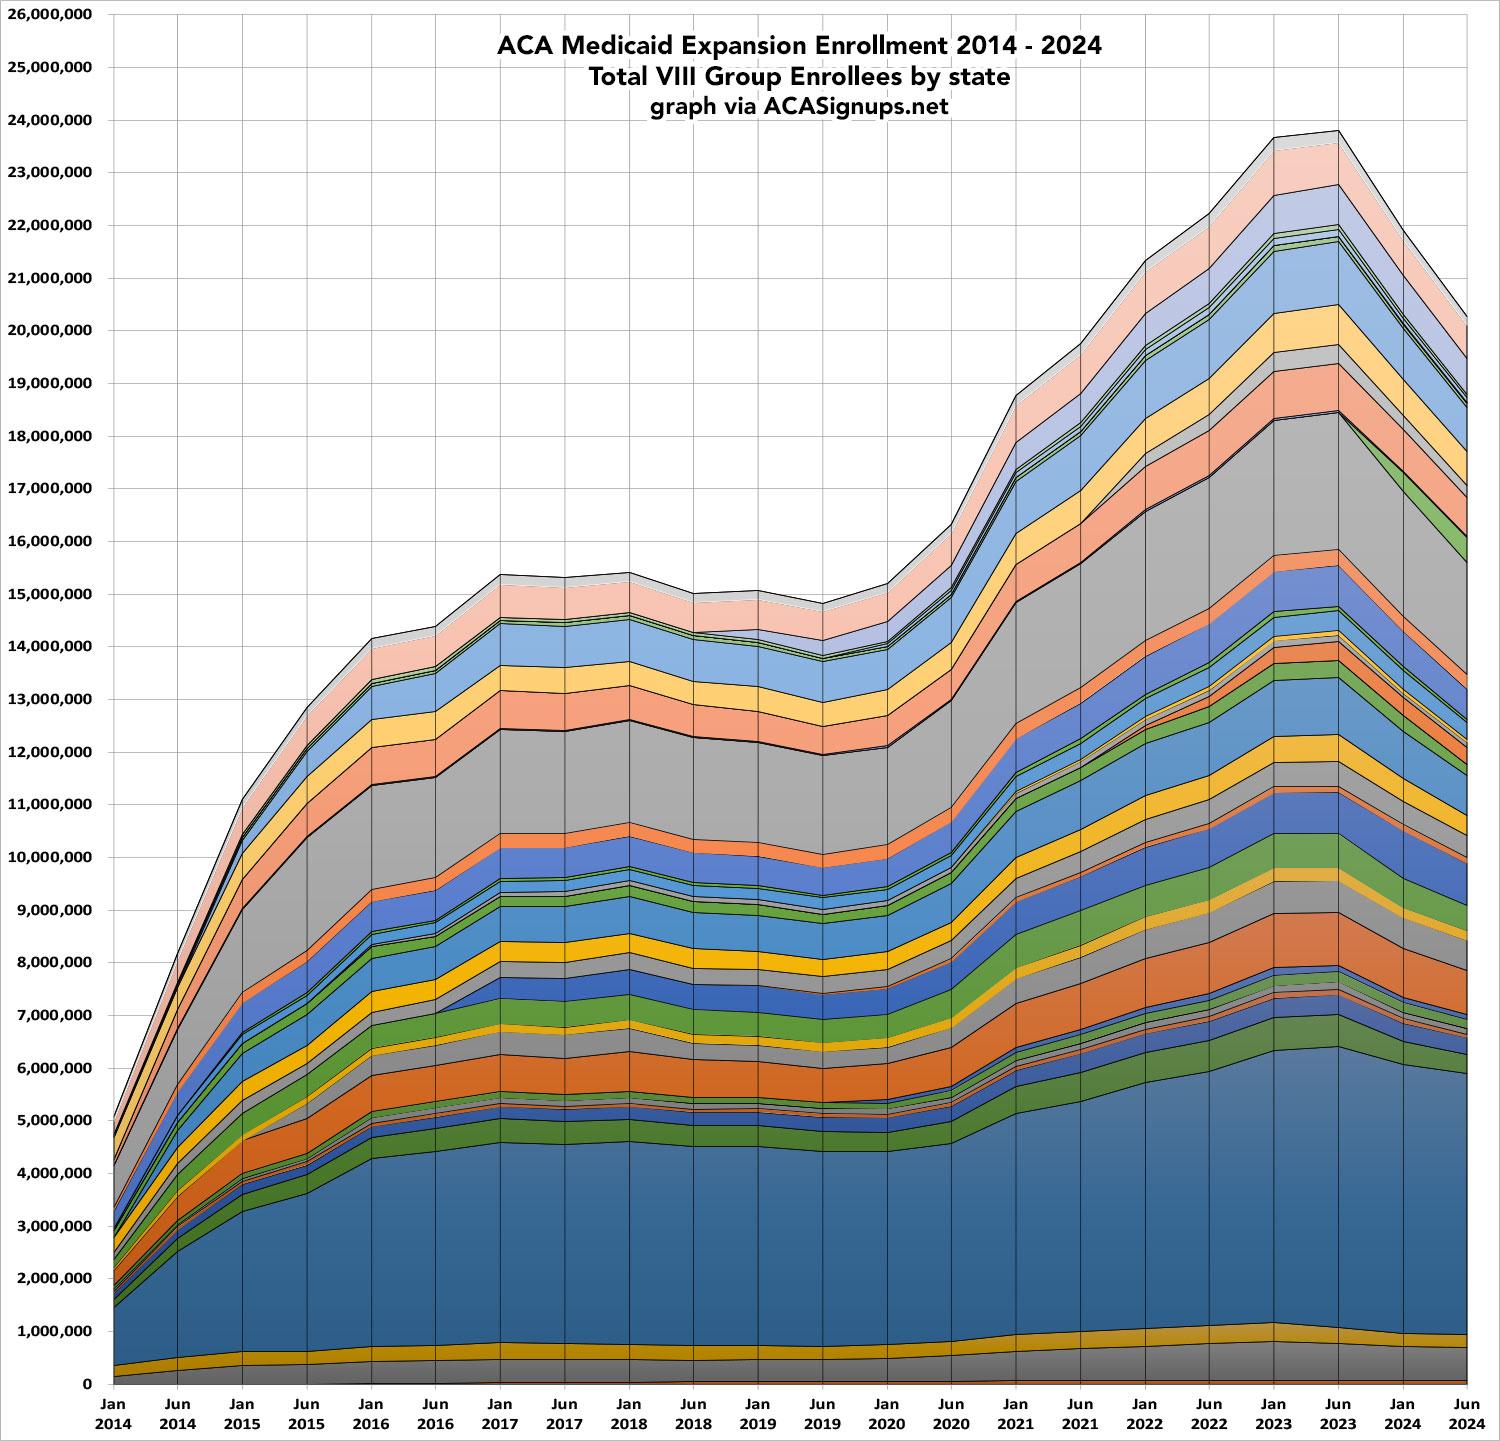
Twelve* Years of #ACA Medicaid Expansion in One Image

Earlier today I posted a colorful graph which broke out ACA exchange enrollment by state from January 2014 - January 2025.
Below I'm posting a similar breakout of total ACA Medicaid Expansion enrollment from January 2014 - June 2024, via the Centers for Medicare & Medicaid Services quarterly Medicaid Budget & Expenditure System reports (warning: That link could be broken or blank by the time you read this under the Trump Administration).
Unfortunately, the MBES reports currently only run through June of last year, so the last half of the year is missing.
No further analysis or comment here; I just think this is a pretty cool graphic...and keep in mind that most of the people represented here would have been utterly screwed from early 2020 - early 2023 without the Affordable Care Act being in place when the pandemic hit.
Click the image for a higher-resolution version. I'm not bothering to include the state labels since some would be too difficult to make out, but it starts with Alaska at the bottom and works its way up to West Virginia at the top (remember, neither Alabama nor Wisconsin or Wyoming have expanded Medicaid under the ACA). It also includes Guam, Puerto Rico and the U.S. Virgin Islands.
How to support my healthcare wonkery:
1. Donate via ActBlue or PayPal
2. Subscribe via Substack.
3. Subscribe via Patreon.


