

How has grandfathered enrollment dropped since the ACA was signed?
Thu, 06/16/2022 - 10:29am
Every summer I root through a mountain of health insurance policy premium rate filings, mostly by using the SERFF (System for Electronic Rates & Forms Filing) database from the National Association of Insurance Commissioners (NAIC).
Depending on the state & carrier, some of these can be found easily; others are either heavily redacted, partial, not available until later in the year; and some are never made available at all.
In addition to the filings for the upcoming year, however, the SERFF database also includes a mountain of other filing forms, from non-ACA compliant insurance policies (short-term, indemnity, etc.) and from previous years (I have no idea how far back they go, but I'm guessing it's at least since the turn of the century). This also includes "grandfathered" and "grandmothered" policies.
"Grandfathered" plans, as you may recall, are major medical healthcare policies which had enrollees prior to the Patient Protection & Affordable Care Act being signed into law by President Obama in March 2010. Under the ACA, these policies could continue to remain active for those already enrolled in them prior to that date for as long as the carrier decided to keep them active or until the enrollees themselves decided to terminate their coverage voluntarily (or until they died), although premiums could be increased over time, of course.
It's important not to confuse grandfathered plans with grandmothered plans, which are non-ACA compliant major medical policies which were in place between March 2010 and December 2013 (just before ACA plans went into effect).
The critical point about both grandfathered & grandmothered policies is that neither of them could take on any new or additional enrollees; their enrollment was frozen at however many were enrolled as of the freeze date. This means that over the past 8 - 12 years, enrollment in each has gradually dwindled.
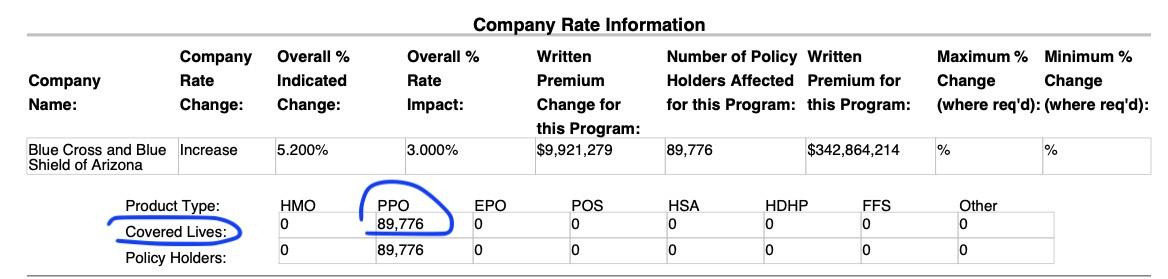
Arizona's 2023 ACA filings aren't available yet, but I was able to find a rate filing for Blue Cross Blue Shield's "Grandfathered" policies, so I decided to take a look at how enrollment in this pool has shrunk over time.
The earliest filing I was able to find is from 2011. At that time, BCBSAZ had nearly 90,000 Arizonans enrolled in their grandfathered policies (they also bumped up premiums by 3% that year). The total number of covered lives was identical to the number of policies, which seems odd, since that would mean every one of them was enrolled separately, but whatever:
Since 2011, BCBSAZ's grandafthered enrollment has been:
- 2011: 89,776 (3.0% rate increase)
- 2012: 63,445 (9.0% rate increase)
- 2013: 54,793 (11.5% rate increase)
- 2014:
- 2015:
- 2016:
- 2017:
- 2018: 24,424 (11.2% rate increase)
- 2019: 17,857 (3.0% rate increase)
- 2020: 16,306 (4.0% rate increase)
- 2021:
- 2022:
- 2023: 12,840 (7.6% rate increase)
Unfortunately some years are missing, but there's enough data points to make the trend pretty clear:
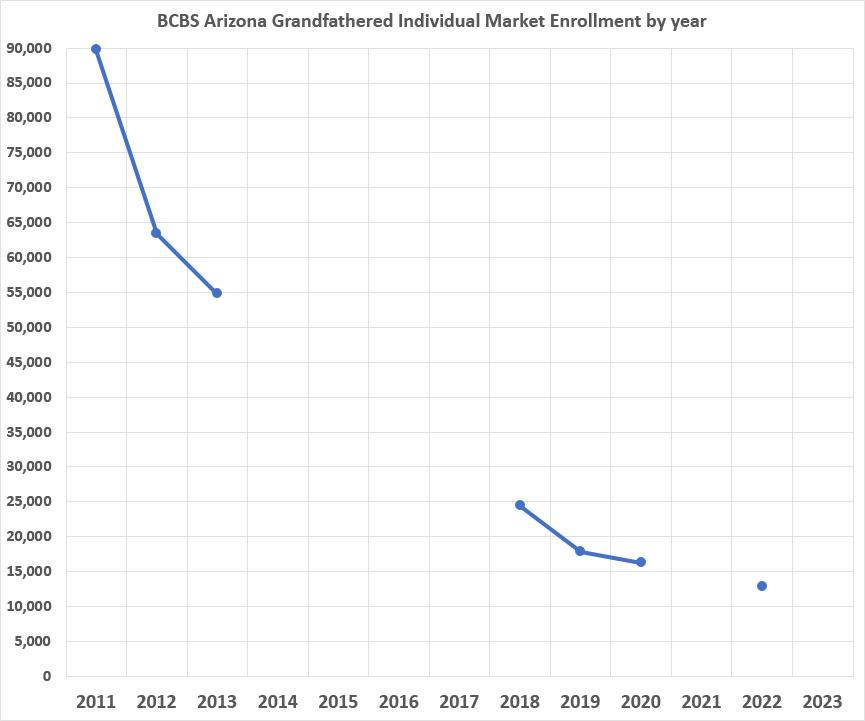
From what I can tell, BCBSAZ enrollment should dwindle down to fewer than 5,000 enrollees by around 2027. At some point or another I assume the carrier will decide to discontinue these plans entirely.
Of course, this is just a single example; there's no way of knowing whether BCBS AZ's experience is representative of other carriers in Arizona or nationally; some carriers haven't sold grandfathered plans for years. But the trendline above is pretty much where I'd expect it to be in general: Down around 85% from pre-ACA levels.
The Kaiser Family Foundation had the total pre-ACA individual market at around 10.7 million back in 2011. Assuming a similar 85% drop nationally, that would put total grandfathered enrollment at around 1.6 million at the very most, though I strongly suspect it's actually well below 1 million.
I'll plug in a few other numbers if I find them to see if there's a pattern or if it varies widely.
UPDATE: I've also put together the annual enrollment in Michigan's Golden Rule grandfathered individual market plans as well:
- 2011: 14,149
- 2012: 11,235
- 2013: 8,998
- 2014: ?
- 2015: 5,580
- 2016: 4,584
- 2017: 3,915
- 2018: 3,416
- 2019: 2,888
- 2020: 2,417
- 2021: 2,041
- 2022: 1,710
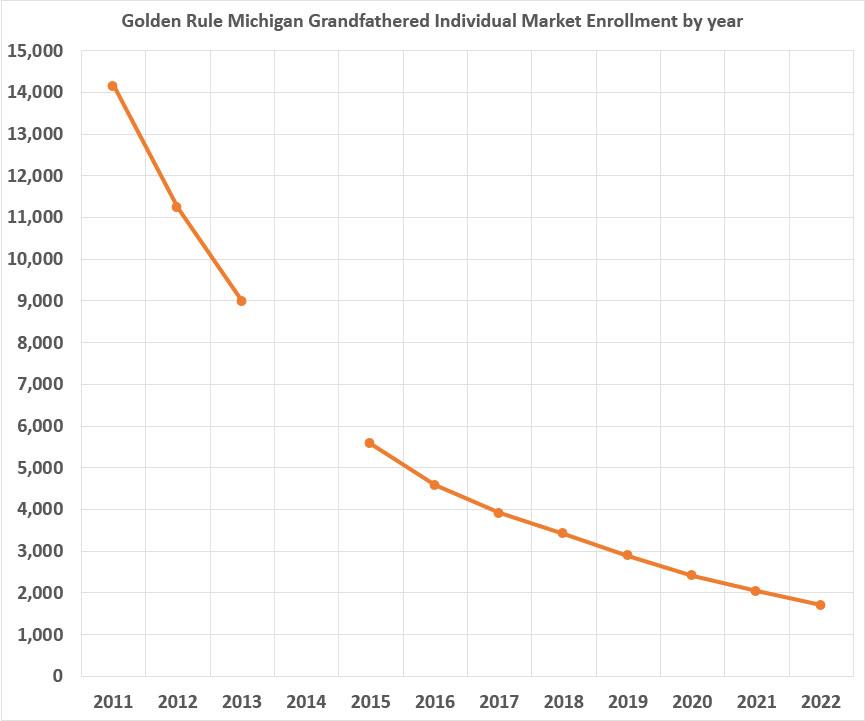
Similar pattern, although in this case 2022 enrollment is just 12% of what it was in 2011.
Advertisement
