

Update: Elephant in the Room Redux, Part 2: The GOP's COVID Death Cult didn't make a *decisive* difference in any House races after all.
Fri, 11/11/2022 - 9:09pm
A couple of days ago, in Part 1, I looked at whether or not the massive COVID death rate divide between Republicans & Democrats between the 2020 and 2022 elections ended up being enough to be a decisive factor in any statewide races.
My conclusion was that there's likely to only be one statewide race* where a Republican candidate loses by less than the COVID death margin: The Nevada Senate race where, as of this writing, incumbent Democrat Catherine Cortez Masto is trailing Republican challenger Adam Laxalt by less than 800 votes. I estimate that somewhere between 900 - 2,400 more Trump voters than Biden voters died of COVID-19 over the past two years, so if Laxalt ends up losing by less than 2,400 votes, I'd say it's pretty likely that yes, the partisan gap in COVID deaths did indeed play a small but critical role.
*Caveat: It's also conceivable that the Arizona Governor or Arizona Attorney General races could fall into this zone as well; as of this writing, Democrat Katie Hobbs is leading by around 26,000 votes for AZ Governor while Democrat Kris Mayes is leading by roughly 16,000 votes.
So, that's statewide races. What about U.S. House races, however?
This gets a bit trickier for two major reasons:
- I'm unable to adjust CD-level estimates by age since the exit polling I used for my statewide estimates (which already has enough methodology issues) can't be extrapolated down to the county or Congressional District (CD) levels.
- My estimates are based on county level data, not CD data...and of course many CD borders don't run perfectly along county borders; they slice through county lines, including anywhere from a few small towns to major metropolitan areas.
The only way I can see of reconciling the county/district issue is to use this handy tool from the Missouri Census Data Center (h/t to Adam Conner-Sax of Blue Ripple Politics for the heads up!), which lets me know exactly what percentage of each county's total population lies within each Congressional District.
I realize that this is far from perfect, but it's the best I can do without a) zip code- or precinct-level COVID data to work with, and b) knowing exactly which of those zip codes/precincts are part of which CDs. Seeing how there's over 40,000 zip codes and over 175,000 precincts in the United States, neither of these are practical for me to attempt.
WITH ALL OF THIS IN MIND, let's take another look at the big picture:
NOTE: The county-level estimates below are smaller than my statewide estimates because statewide data includes deaths in which the county of residence is unknown. On the other hand, I also have the additional 7 weeks of data from 9/10/22 - 11/07/22 for this post.
According to official CDC data, around 822,000 Americans whose county of residence is known died of COVID-19 between 10/31/20 - 11/07/22. Of those, I estimate that perhaps 502,000 had actually voted for Biden or Trump.
Nationally, Joe Biden received 81,283,501 votes to Donald Trump's 74,223,975 votes. If COVID impacted both voting blocs at identical rates, you'd normally expect roughly 9.5% more Biden voters to have died of COVID over the past 2 years than Trump voters...or roughly 25,000 more Biden voters.
Instead, however, I estimate that nationally, around ~125,000 more Americans who voted for TRUMP in 2020 had died of COVID-19 between the 2020 general election and the 2022 midterm election than those who voted for Biden.
Several obvious caveats apply here:
- "Voted for Trump" or "Voted for Biden" isn't a perfect overlap with Republicans and Democrats
- It also isn't a perfect overlap with how those ~569K people would have voted this year.
- Finally, the odds are that some of them wouldn't have voted this year at all; election expert/vote tracker Michael McDonald estimates that the 2022 turnout was around 112 million people, or around 30% lower than in 2020.
HOWEVER, this is the best I've been able to do with the resources I have available to me.
I used two different assumptions for County Level (and from that, CD Level) estimates:
- My "Base Assumption" didn't take anything into account other than the county-level election results and the post-11/04/20 election COVID death toll in each county. If you stopped there, there'd be around 22,000 more Trump voters than Biden voters who died since the 2020 election...a 47,000 swing from what a simple national popular vote count would give you.
- My "Assume 20% Lean" estimate attempted to account for other factors I've written about several times before: Misreported COVID deaths by MAGA coroners, the impact of refusal to wear masks/socially distance and so forth. Assuming this is reasonably accurate, it adds up to around 125,000 more Trump voters (roughly a 150,000 swing from popular vote expectation).
If accurate, the high-end estimate would mean roughly 68% more Trump voters than Biden voters have died of COVID since the 2020 election.
As it happens, just a few weeks after I published this crude estimate, there was a major study published by the National Bureau of Economic Researchers--which used much more sophisticated methodology than I did--to conclude that:
We estimate substantially higher excess death rates for registered Republicans when compared to registered Democrats, with almost all of the difference concentrated in the period after vaccines were widely available in our study states. Overall, the excess death rate for Republicans was 5.4 percentage points (pp), or 76%, higher than the excess death rate for Democrats. Post- vaccines, the excess death rate gap between Republicans and Democrats widened from 1.6 pp (22% of the Democrat excess death rate) to 10.4 pp (153% of the Democrat excess death rate). The gap in excess death rates between Republicans and Democrats is concentrated in counties with low vaccination rates and only materializes after vaccines became widely available.
Well I'll be damned.
Before I proceed, it's important to review my overall conclusion in September:
The net gap between Trump & Biden COVID deaths will likely continue to increase slightly more between now and November 8th, but aside from a handful of extremely close races, I doubt that will be enough to make the difference in who ends up winning.
I'm going to start with the House race which seems to have gotten the most attention lately: Colorado's 3rd district, where incumbent Republican Lauren Boebert faced a surprisingly strong challenge from Democrat Adam Frisch. As of this writing (at 9:30pm Friday evening...what can I say, I'm a nerd), Boebert leads Frisch by 1,122 votes, or just 0.34%, with over 95% of the vote counted.
Colorado's new (post-redistricting) 3rd House District includes the following 27 counties: Alamosa, Archuleta, Conejos, Costilla, Delta, Dolores, Eagle, Garfield, Gunnison, Hinsdale, Huerfano, La Plata, Las Animas, Mesa, Mineral, Moffat, Montezuma, Montrose, Otero, Ouray, Pitkin, Pueblo, Rio Blanco, Rio Grande, Saguache, San Juan, San Miguel
Of those, only one of them, Eagle County, is actually split across more than one CD; part of it belongs to Colorado's 2nd district. This makes CO-03 about as solid of a CD as there is for me to analyze.
Here's what it looks like if I assume 100% of Eagle County's total population lies within CO-03:
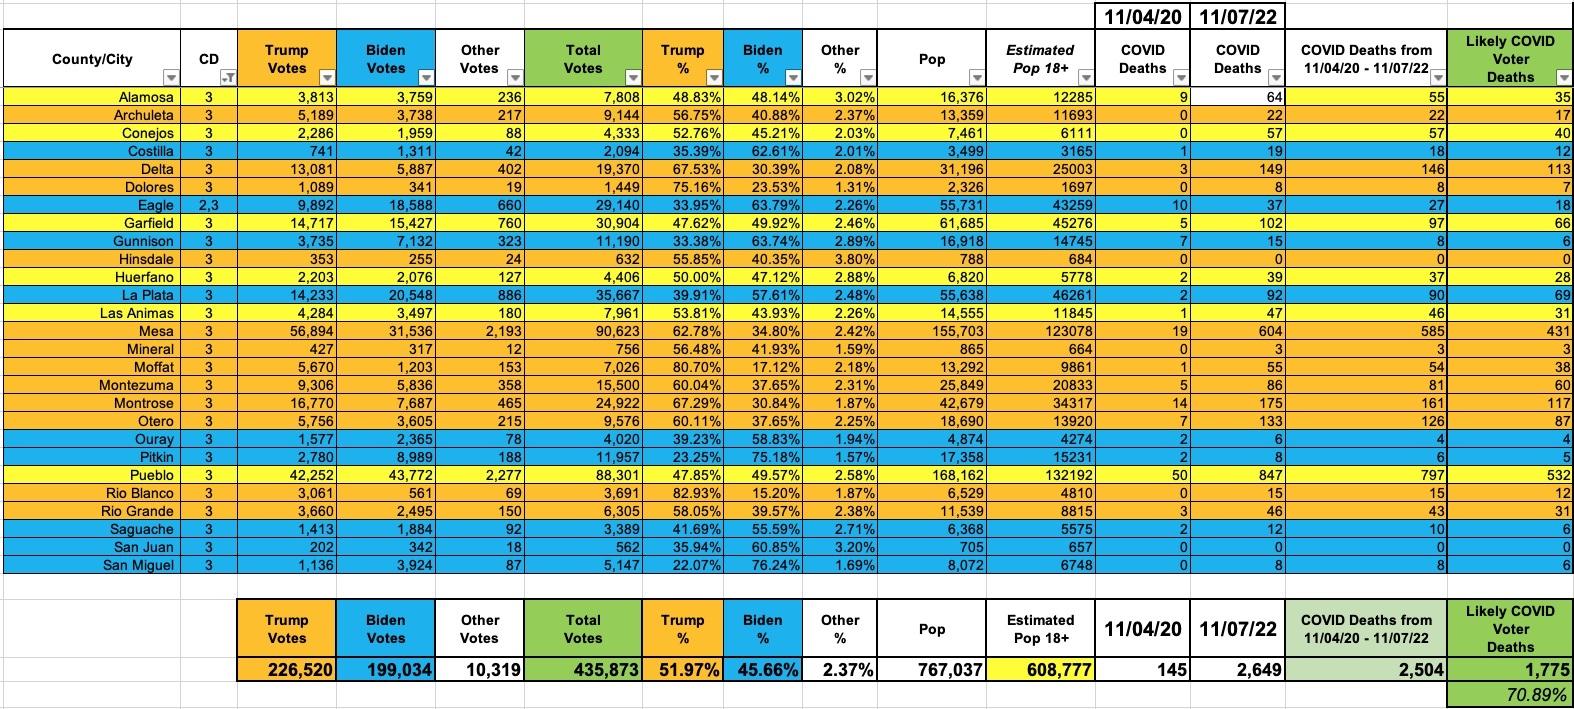
In 2020, if you include all of Eagle County, Donald Trump received around 226.5K votes to Biden's 199K, winning it 52.0% to 45.7%. There were a total of around 767,000 residents as of April 2020 (via the U.S. Census Bureau), of which around 2,500 died of COVID between the 2020 and 2022 elections (via Johns Hopkins University data). Of those, I estimate that roughly 1,775 actually voted in the 2020 election.
Next, I look at the county-level breakout of those COVID deaths, assuming either a straight Trump/Biden proportion (baseline) or a 20% Trump lean:
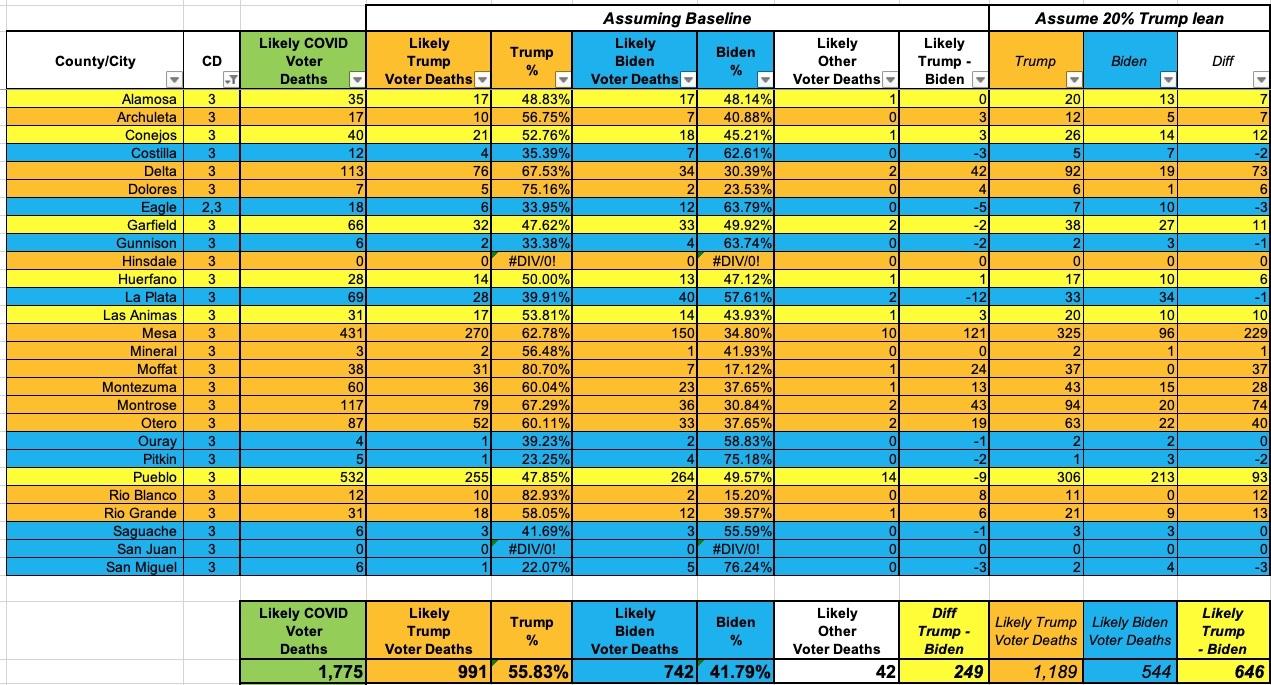
The baseline estimate, which doesn't adjust for anything other than each county's partisan lean, suggests that of the 1,775 voters who died of COVID since the 2020 election, around 991 likely voted for Trump, 742 likely voted for Biden, and 42 likely voted for someone else...a Red/Blue gap of 249. The 20% Trump Lean estimate comes in at 1,189 Trump voters & 544 Biden voters, or a partisan gap of 646.
OK, but what about Eagle County? Well, according to the MCDC tool, only 18.7% of Eagle County is part of CO-03. I estimate that only 18 Eagle County voters died of COVID total during this timeframe, so the odds are that only around 3-4 of them lived within the CO-03 border, making for a nominal impact at most.
In other words, if Lauren Boebert ultimately ends up losing by less than around 600 votes, I'd say there's a strong argument to be made that the GOP COVID Death Cult was what made the decisive difference.
I'll be adding other close districts which run along county lines to this entry over the next day or two, so stay tuned.
UPDATE: Next up is Washington's 3rd Congressional District, where Democrat Marie Gluesenkamp Pérez is facing Republican Joe Kent.
As of this writing, again via the NY Times, Perez is currently up by 4,959 votes.
WA-03 includes 6 red/swing counties (Clark, Cowlitz, Lewis, Pacific, Skamania & Wahkiakum) and just 11.3% of Thurston, a solidly blue county.
Here's what it looks like assuming you include all of Thurston:
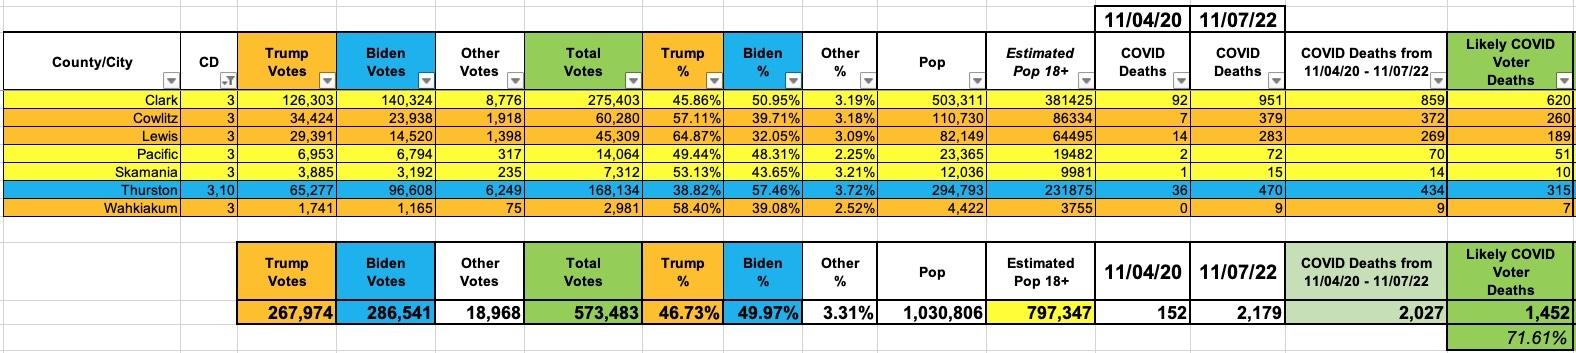
With all of Thurston included, you get around 1,450 COVID voter deaths, with a low-end gap estimate of 20 and a high-end estimate of 305.
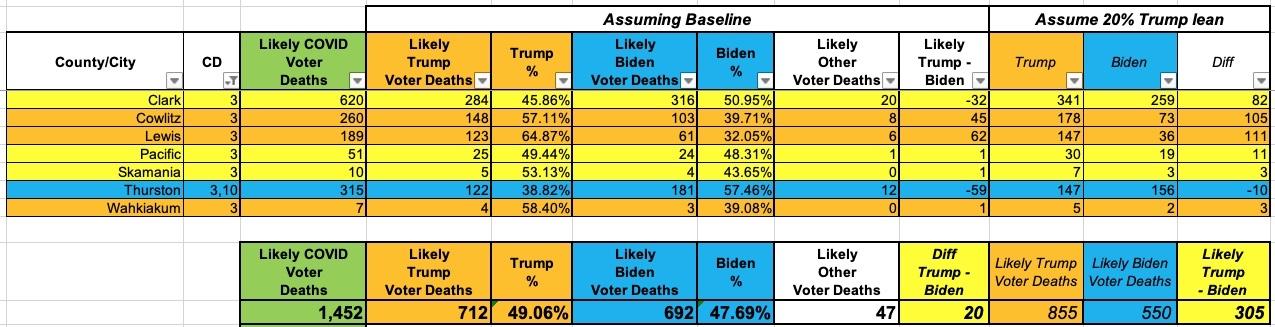
If, however, you adjust to only include 11.4% of Thurston County, you get this:
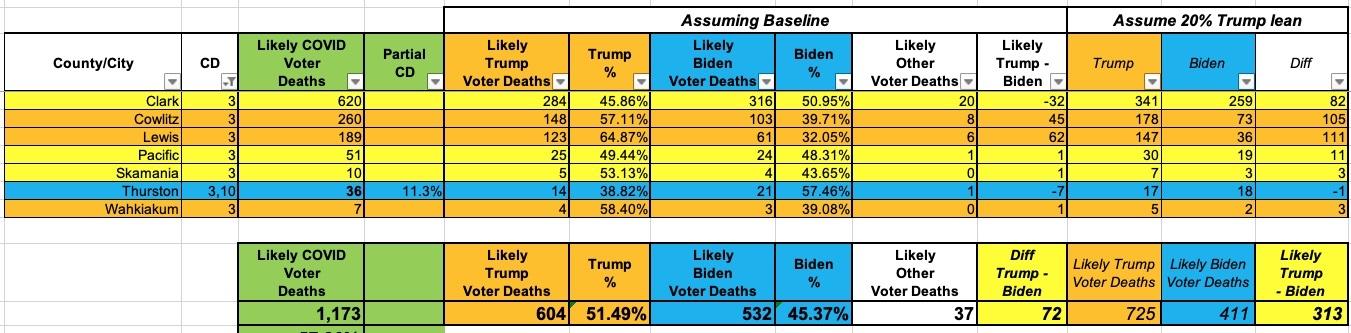
Both the low- and high-end estimates increase, since Thurston County is pretty blue and has a considerably lower COVID death rate than the other 6 counties.
Bottom line: If Kent loses by less than around ~300 votes, I'd put him in the zone.
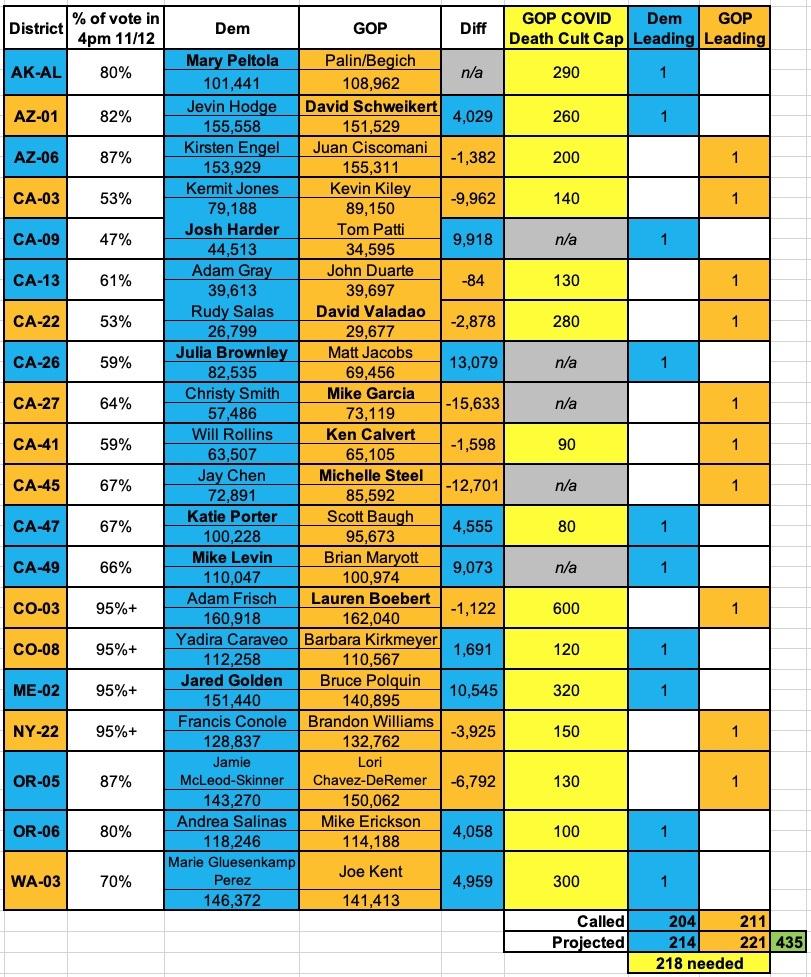
UPDATE 8:20pm: The two examples above should give you the idea. I've compiled the 20 House races which haven't been called yet (the other 415 presumably were decided by much higher margins). There's five districts (CA-09, CA-26, CA-27, CA-45, CA-49) where my upper-end estimate is less than 50 votes; I'm basically not even counting those given the uncertainty factors. Alaska is a special case, of course, due to their unusual Instant Runoff Voting system; Mary Peltola technically has fewer votes than her two Republican opponents combined, but is expected to win fairly easily once it goes to the second round of voting.
That leaves 14 districts (see below) where the Red/Blue COVID Death Gap could potentially play a decisive role. Notice, however, that of these, CO-03 has the highest estimate at 600 votes.
This is exactly what I meant when I said that it would only be enough to actually swing a House race from Red to Blue if the margin was already extremely small to begin with.
UPDATE 10am Tuesday: OK, the House field has narrowed considerably, mostly in the GOP's direction. It looks like they're going to end up flipping control of the House after all, just barely (most likely 220 R to 215 D).
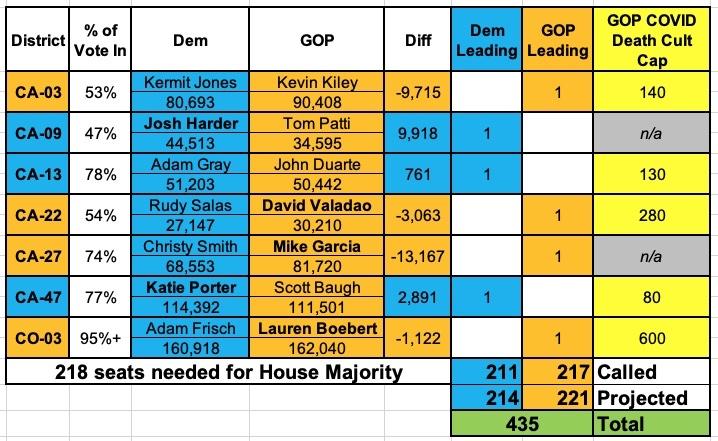
Here's the races which haven't been called by major outlets yet (or which have but where there's a recount likely). Unless there's some dramatic last-minute update or correction to any of the other 428 races, it looks like there's only five where the red/blue COVID death factor could end up making a decisive difference...and that would still only be if the Democrat ended up winning by a few hundred votes at most.
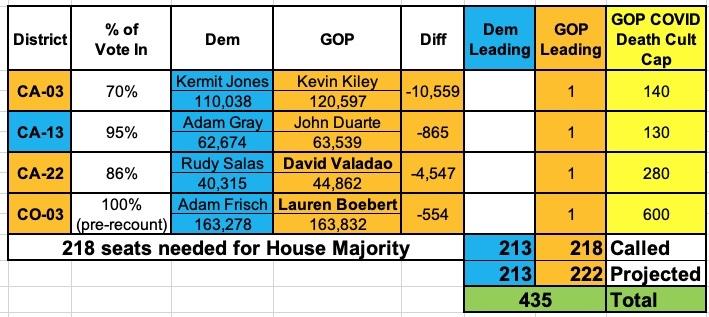
UPDATE 9pm Sunday: Welp. There's only 4 races left uncalled at this point, all of which the Republican candidate is leading in, so unless one of these very narrowly flips to the Democratic candidate, I'd say no, the GOP Covid Death Cult factor wasn't decisive in any House races:
That doesn't mean it didn't have any impact, mind you--it absolutely did. It's just that the largest red/blue COVID death gaps happened in the districts where it also made the least difference in election results, as I first predicted over a year ago:
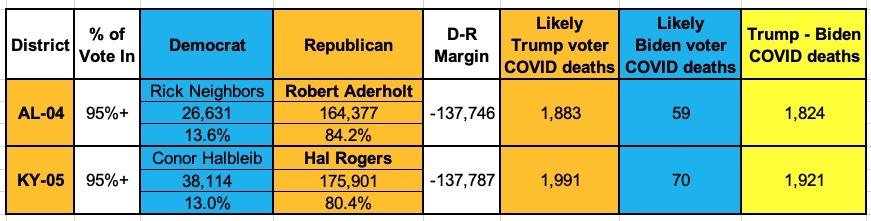
Furthermore, while that may sound like a high number, keep in mind that most of those either live in counties (and therefore, indirectly, districts) which are already pretty Blue or in counties/districts which are solidly Red to begin with. A GOP Congressperson used to winning with 75% of the vote isn't going to lose much sleep over that number being knocked down to 70% or even 65%.
Sure enough, here's two perfect examples of this. AL-04 and KY-05 are two of the reddest House districts in the country...and also two of the districts with the highest GOP/Dem COVID death gap. As you an see, while I estimate that around ~1,900 more Trump voters died of COVID since the 2020 election than Biden voters in each district, it's barely a rounding error compared to the ~137,000 vote difference between the Republican and Democratic candidates in each race:
FINAL UPDATE: In the end, all of the remaining CA/CO races ended up with the Republican candidate winning narrowly anyway, so I've concluded that no, the COVID death gap factor was not decisive in any of them.
Advertisement
