

Yes, someone did the math for Trump (actually, several people did).
Wed, 01/19/2022 - 12:06am
Donald Gerard McNeil Jr. is an American journalist. He was a science and health reporter for The New York Times where he reported on epidemics, including HIV/AIDS and the COVID-19 pandemic. His reporting on COVID-19 earned him widespread recognition for being one of the earliest and prominent voices covering the pandemic.
A few days ago, Mr. McNeil posted an essay on Medium:
Trump Backs Boosters. Clearly, Someone Did the Math for Him.
- Trump is losing hundreds of voters a day to Covid — far more than the margins in the swing states.
Math is not Donald Trump’s strong point.
Example: In 1988, he paid $408 million for the Plaza Hotel and spent millions making it gaudier. Seven years later, his creditors sold it for $325 million. And yet he styles himself a business genius.
Genius or no, he is suddenly doing something very smart: in interview after interview, he endorses vaccines and boosters. He’s even called political rivals who refuse to admit they’ve been boosted “gutless.”
Why?
My guess is that somebody has done the math for him.
The math that says: “Uh, sir? Your voters are dying in droves.”
McNeil goes on to cite various studies, surveys and analyses...including one which is pretty familiar to me:
Recent C.D.C. data cited by Kaiser Health News shows vaccine-resistance highest among whites. Earlier polls showed growing divisions along party and even religious lines (86 percent of Democrats vaccinated vs. 60 percent Republicans; 90 percent of atheists vs. 57 percent of white evangelicals). By September, the pattern was clear, according to David Leonhardt of The New York Times: Covid death rates were about three times higher in counties that had voted for Donald Trump in 2020.
The Leonhardt piece, of course, includes its own links to various data analyses, including one by yours truly:
Since Delta began circulating widely in the U.S., Covid has exacted a horrific death toll on red America: In counties where Donald Trump received at least 70 percent of the vote, the virus has killed about 47 out of every 100,000 people since the end of June, according to Charles Gaba, a health care analyst. In counties where Trump won less than 32 percent of the vote, the number is about 10 out of 100,000.
To be clear, I'm not the only one who's been tracking this particular trend, but I think I'm the only one who's been doing so a) at the county level and b) consistently on a weekly basis since almost the beginning of the pandemic (albeit with some major methodological changes since then).
Leonhardt rounded things off a bit, but taken at face value the COVID death toll from June - September ran around 4.7x higher in the > 70% Trump counties than the < 32% Trump counties.
I kept using June 30th as my starting date until the end of December; more recently I started using December 15th as my starting point now that we're well into the Omicron wave.
However, for purposes of comparison with the September study, let's see where things stand since June 30th again:
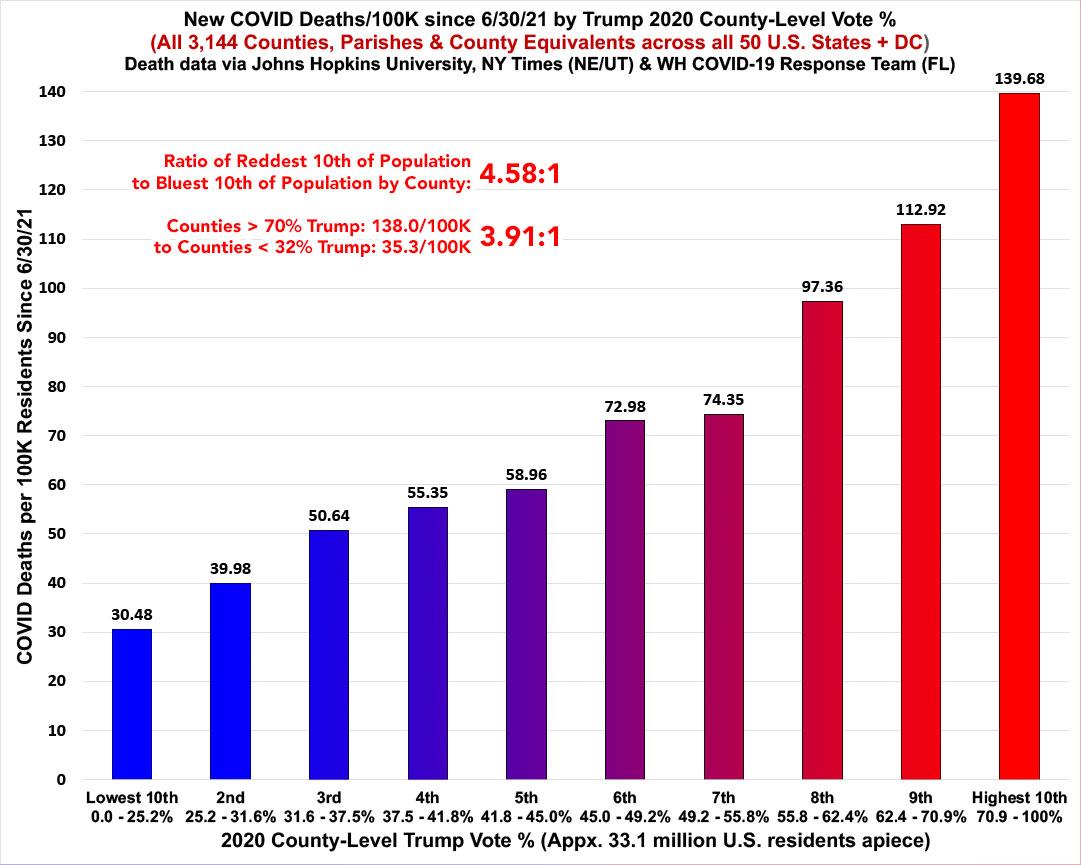
The 4.6x ratio compares the reddest decile vs. the bluest one; the first month of the Omicron wave has cut the 7-month ratio down significantly from the 5.7x higher ratio we saw during the Delta wave.
The updated version of Leonhardt's figures is also down from 4.7x higher in the counties Trump received over 70% of the vote in vs. the counties where he received 32% or less...but it's still over 3.9x higher since the end of June.
As I noted on Monday in my latest Omicron-era update, I predict that the death rate will continue to shift more towards Blue America for another 2-3 weeks, at which point I suspect it will then reverse course and once again push COVID death rates higher in the redder counties again. I don't think it'll ever reach the ~6:1 ratio we saw at the height of the Delta wave again, but the cumulative June 2021 - May 2022 ratio could end up being 3:1 or somewhere along those lines.
Having said that, neither December 15th nor June 30, 2021 are really the best start dates to use for this sort of comparison if you're interested in knowing how the red/blue divide will impact the 2022 midterms. For that, you'd have to start as of November 4th, 2020...because that's the date of the last major general election.
(There's not much point in starting at the beginning of the pandemic itself, mind you, since any registered voters who died prior to 11/04/20 were already accounted for, as they didn't vote in the 2020 election either).
Back on December 30th I took a crack at trying to estimate what this might look like so far. Here's an updated version of the partisan breakout since 11/04/20, broken out into 20ths instead of 10ths:
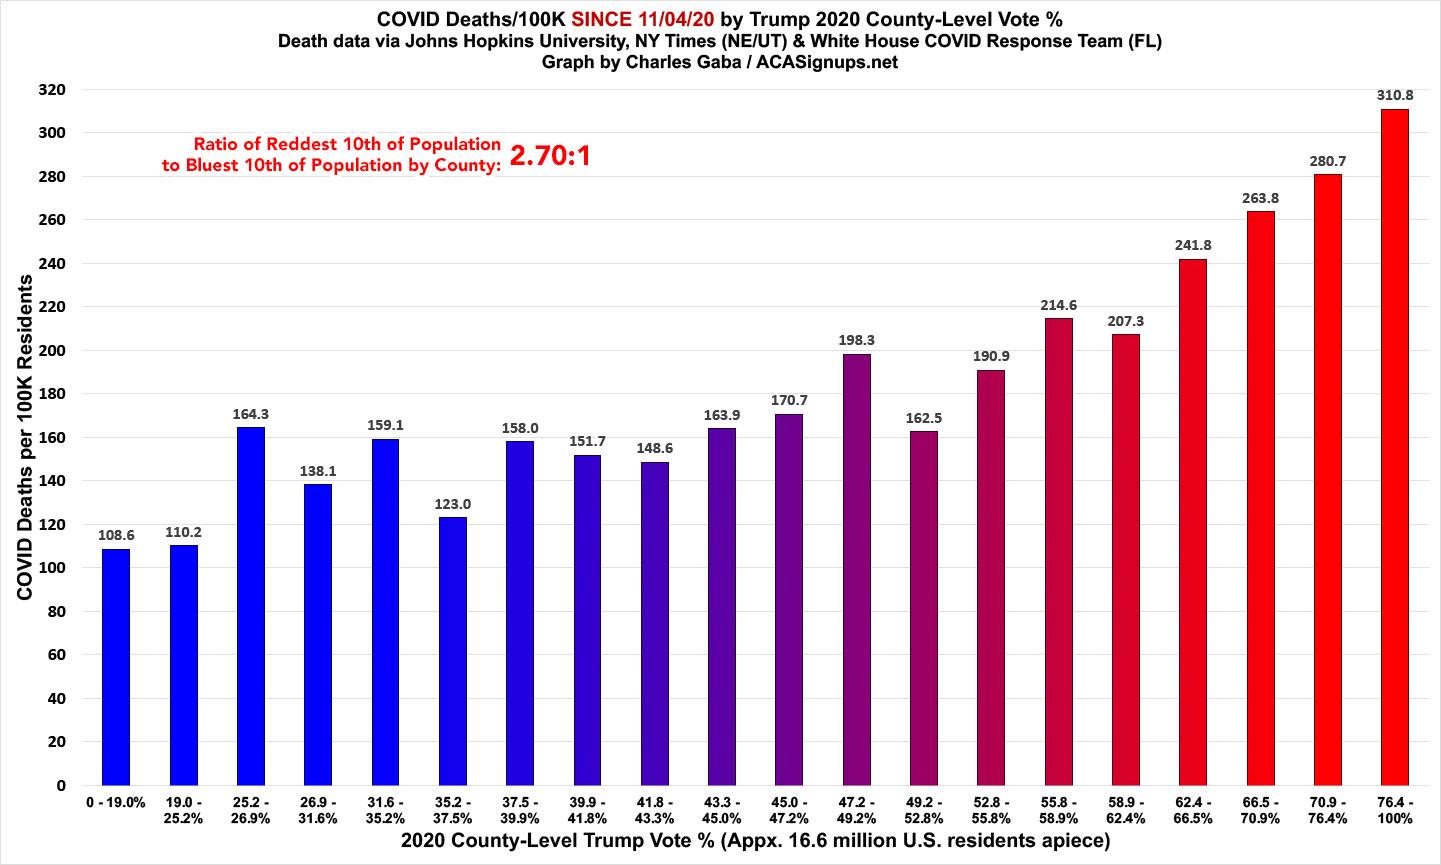
If you start with November 2020, the ratio is even less extreme, since it includes the massive 3rd wave from around October 2020 - March 2021 in which the death rate still leaned slightly higher in the bluer parts of the United States or where it was pretty much evenly spread across the partisan county spectrum. Even so, the death rate from 11/04/20 - today is still 2.7x higher in the reddest decile of the country than the bluest...with a fairly steady trend line in between.
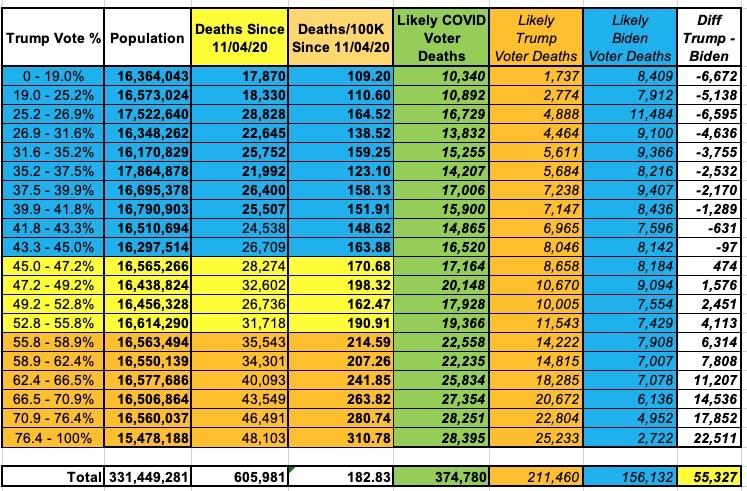
So, what's that look like in terms of actual Democratic & Republican voters? As I noted in December, of the ~600,000 Americans who have died of COVID since November 2020 (yes, I know it's higher; I'm going by official estimates), assuming the COVID death rate is roughly proportional between voters and non-voters (it probably isn't, but I don't have the data to adjust for that), only around 375,000 of them actually voted in the 2020 election; the rest were mostly unregistered or registered but didn't bother voting at all.
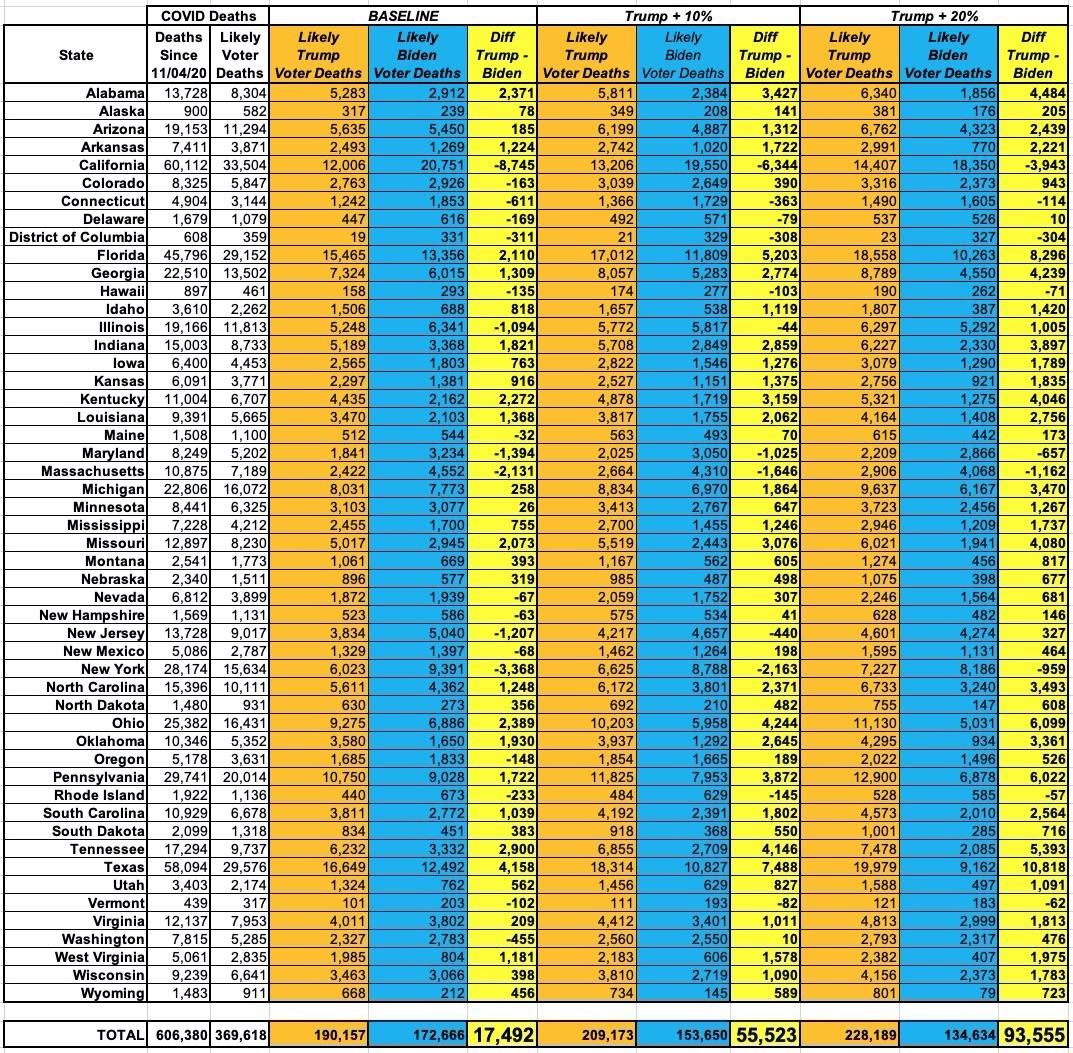
And what's the breakout among those who did vote (whether for Trump, Biden or a 3rd party)? Well, I've run the numbers three different ways: The default assumes the death rate is exactly proportional to the number of deaths by county multiplied by the percent of the total vote received by Trump, Biden or someone else. That looks like this:
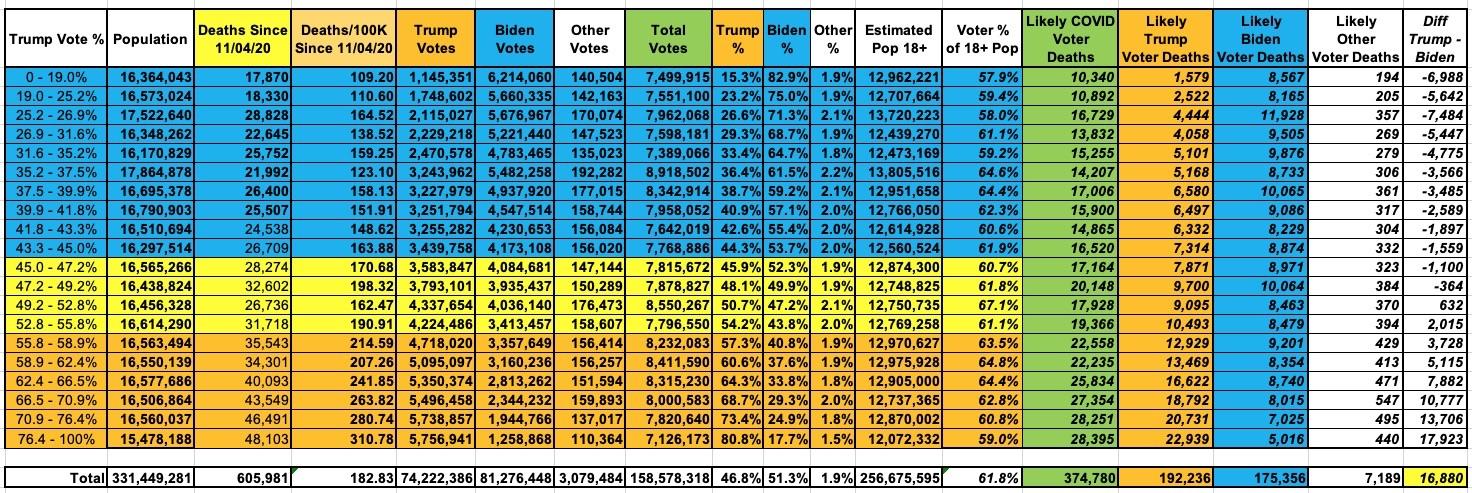
- Trump voters: ~192,200
- Biden voters: ~175,400
- Voted for Someone Else: ~7,200
- Net Trump - Biden voters: ~16,900
Here's what this looks like visually:
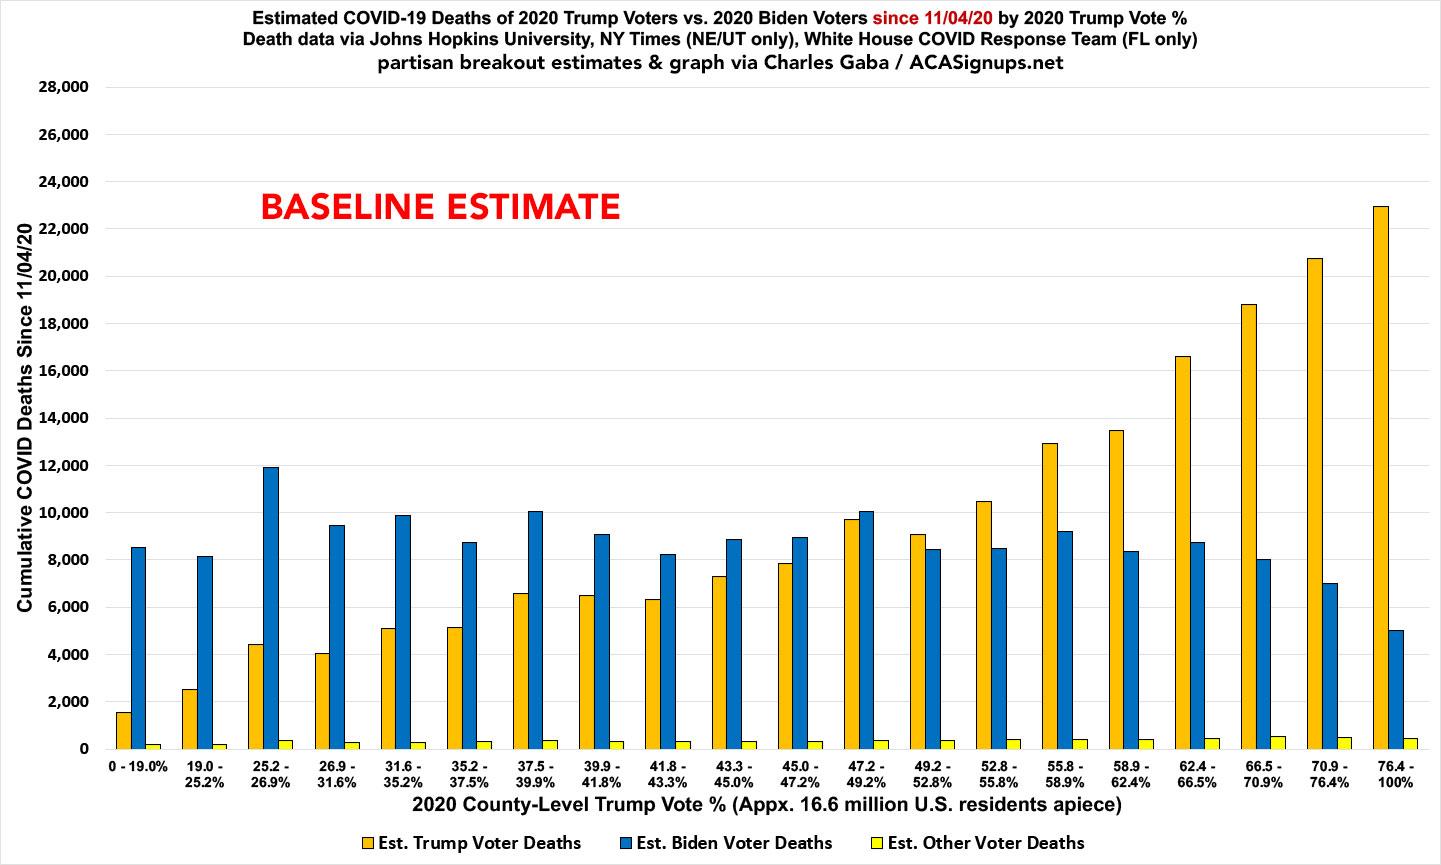
Of course, Trump voters tended to skew older than Biden voters:
But one of the biggest divides that did come to pass was between older voters and those aged under 30, who became even “less enamoured of President Trump than before”.
“The other age groups, 30-44, 45-64, 65 and over, it’s a pretty close divide between Biden and Trump. So it’s really young people who are overwhelmingly anti-Trump and that’s really noticeable.”
...which likely makes a significant difference, given that nearly 75% of all U.S. COVID deaths have been among those 65 or older.
In addition, aside from the massive partisan vaccination gap (which has continued to grow larger ever since last spring) there's also the fact that Republicans are far less likely to wear masks if not required to (or even if they are, I'd imagine), and I'm pretty sure they're also a lot less likely to socially distance/etc.
All of these factors probably make the partisan death rate gap even larger than the raw voting results would suggest...but I have no idea how much larger.
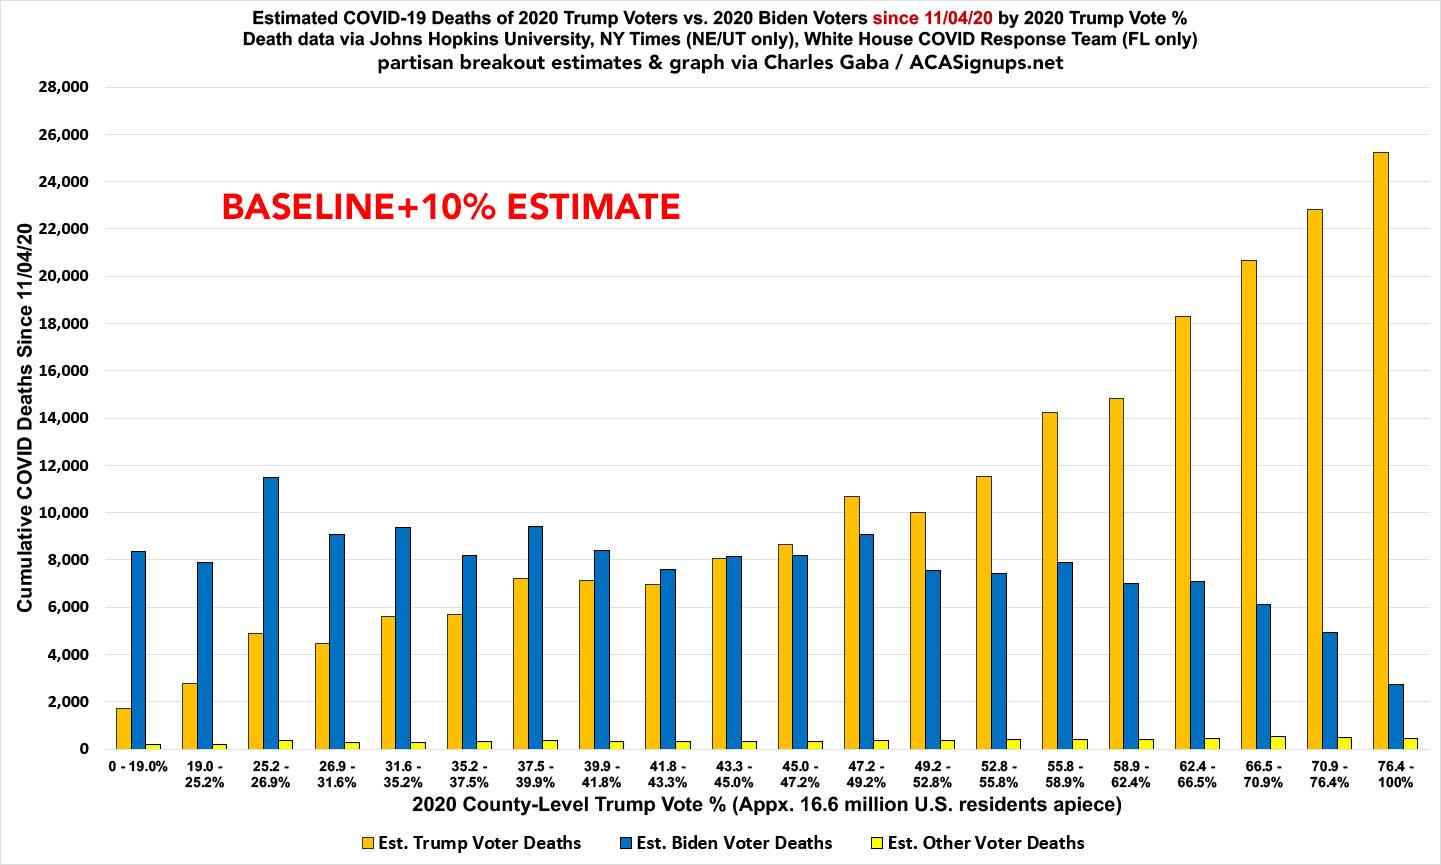
Therefore, I've also run the numbers assuming a 10% lean and a 20% lean...that is, in each county, I looked at the results if you shift the baseline numbers 10% higher or 20% higher for Trump voters. At a 10% lean, that would give:
- Trump voters: ~211,500
- Biden voters: ~156,100
- Voted for Someone Else: ~7,200
- Net Trump - Biden voters: ~55,300
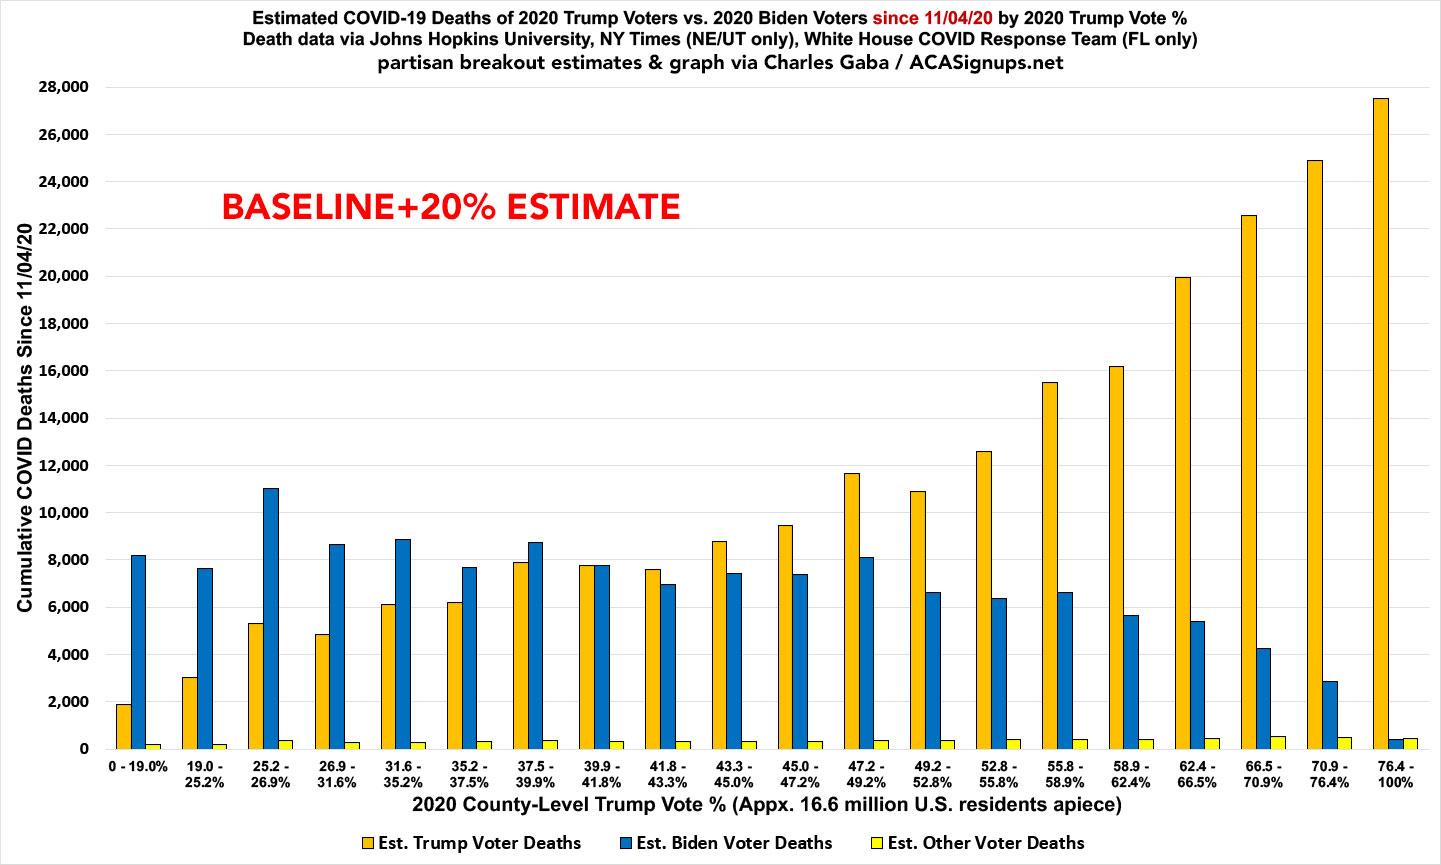
At a 20% lean, it would look like so:
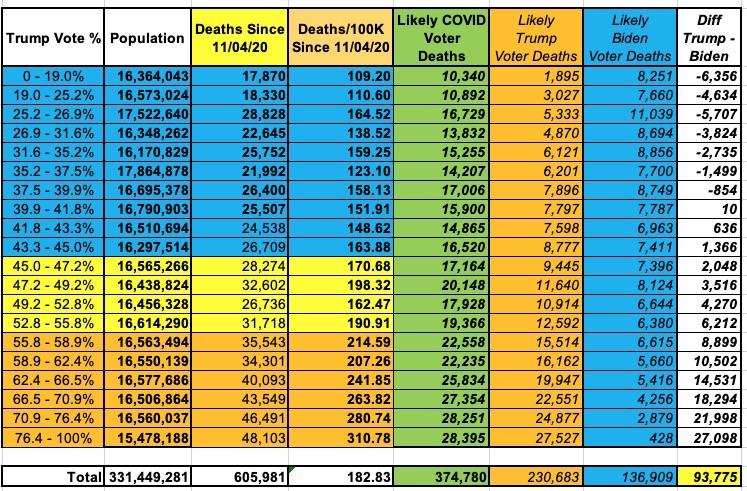
- Trump voters: ~230,700
- Biden voters: ~136,900
- Voted for Someone Else: ~7,200
- Net Trump - Biden voters: ~93,800
If you assume a Trump +20% lean for every county, the county with the highest gap in raw numbers between Trump & Biden voters is Maricopa County, Arizona, where this methodology puts it at a little over 1,000 more Trump voters having died of COVID since the 2020 election than Biden voters. At the opposite end, it assumes around 3,800 more Biden voters have died than Trump voters in Los Angeles (which, of course, is the largest county in the United States, with more than 10 million residents).
In terms of legislative races, it's impossible to say what sort of impact this will have, since my data is by county, while legislative maps often slice up counties into multiple districts, merge counties with wildly different demographics together, or both.
What about at the statewide level? Here's what the above assumptions look like at the baseline, Trump +10% and Trump +20% levels:
Assuming my methodology is reasonably close to accurate, McNeil's lede is overstating the situation quite a bit. Here's the the 6 key 2020 swing states won by Biden, assuming the "Trump+20%" estimates above:
- Arizona: ~2,400 (2020 margin: 10,500)
- Georgia: ~4,200 (2020 margin: 11,800)
- Michigan: ~3,500 (2020 margin: 154,200)
- Nevada: ~700 (2020 margin: 33,600)
- Pennsylvania: ~6,000 (2020 margin: 80,600)
- Wisconsin: ~1,800 (2020 margin: 20,700)
Here the states with close 2020 margins won by Trump:
- North Carolina: ~3,500 (2020 margin: 74,500)
- Florida: ~8,300 (2020 margin: 371,700)
- Texas: ~10,800 (2020 margin: 631,200)
- Ohio: ~6,100 (2020 margin: 475,700)
- Iowa: ~1,800 (2020 margin: 138,600)
- Alaska: ~200 (2020 margin: 36,200)
Again: The net gap between Trump & Biden COVID deaths will likely continue to increase somewhat between now and November, but aside from a handful of extremely close races, I doubt that will be enough to make the difference in who ends up winning.
For that matter, even if the "death gap" numbers were significantly higher, it won't mean much if millions of Americans who voted for Biden and/or other Dems in 2020 decide to flip or simply don't show up at all in 2022 because they blame him for the pandemic continuing. As I noted back in September:
This is perhaps the most cynical thing I've ever typed in a blog entry, but there's no getting around it:
GOP leadership, FOX News, Trump/MAGA etc don't appear to care how many of their own voters die as long as they damage President Biden's approval rating in the process.
While I'm sure they'd much rather every person who dies of COVID be a Democrat, losing ~250,000 of their own supporters appears to be a small price to pay if it results in them flipping control of the House and/or Senate next year.
At the time, I coached this in grave language to make it clear that this was a shocking statement.
Yesterday, Politico just stated it matter of factly as the GOP's official midterm strategy.
Once again, this scene from "Class Action" boils their entire strategy down to its essence:
Maggie: May I ask a question, please?
Getchell: Sure.
Maggie: Why didn't you just change the blinker circuit? It's just a question.
Getchell: I told Flannery about the problem a month or so before he died. He called in his head bean counter.
Maggie: What's that? Risk management expert, right?
Getchell: Yeah. Flannery shows him the data and asks him how much it would cost to retrofit...
Maggie: You mean recall?
Getchell: Yeah, you got it. To retrofit 175,000 units. Multiply that times 300 bucks a car, give or take. You're looking at around $50 million.
So the risk guy, he crunches the numbers some more. He figures you'd have a fireball collision about every 3,000 cars.
That's 158 explosions. Which is almost as many plaintiffs as there are. These guys know their numbers.
So you multiply that times $200,000 per lawsuit. That's assuming everybody sues and wins. 30 million max.
See? It's cheaper to deal with the lawsuits than it is to fix the blinker.
It's what the bean counters call a simple actuarial analysis.
Advertisement
