

Elephant in the Room: Yes, more Trump voters have likely died of COVID than Biden voters. No, it likely won't make much difference.
Thu, 12/30/2021 - 2:12am
UPDATE: Quite a few people are telling me that I'm being too conservative in my assumptions below, and they make a very good case based on the anti-mask and anti-vaxx mindset among Republicans, Trump voters tendency to be older than Biden voters and so forth. I AGREE WITH ALL OF THIS. I'm still trying to be as cautious/conservative as possible, however, because this is a very ugly & touchy subject and because there are still a lot of unknowns.
As I note below, even in a heavily Trump-leaning county, the bulk of the COVID deaths could be among Biden voters. It's not likely but it's possible and I'm trying to keep that in mind here.
Back in early September, I wrote a post called "A Simple Actuarial Analysis" in which I broke down, in cold, clinical detail, why Republican Party leadership and their associates at FOX News other right-wing outlets have gone on an all-out war on vaccinations, mask wearing and other COVID mitigation protocols since last spring in spite of the fact that doing so seems to be incredibly counterproductive...in that they're basically killing off their own voters/viewers in the process. I wrote an updated version of this post in late October.
In both cases, I made a crude attempt to estimate just how many actual Trump vs. Biden voters have died of COVID-19 since the November 2020 election. Over 230,000 Americans had already died of COVID prior to November 2020, but I didn't see the point in including them in this analysis since they're already accounted for. By that I mean, only a handful of them actually voted in the 2020 election.
In both my September and October estimates, I broke all 3,144 counties in the 50 U.S. states + DC out into 10 brackets based on Donald Trump's percent of the vote last year. I then looked at the total number of COVID deaths and made some assumptions about what percent of those who died actually voted. I then made another assumption about what percent of the remaining total in each bracket likely voted for Trump vs. Biden and took the difference in each bracket.
Using this back-of-the-envelope math, in my September post, I came up with a rough estimate of around 124K Trump voters to date vs. perhaps 87K Biden voters...a 55,000 partisan voter death difference nationally from 11/04/20 - 9/07/21. In my October post I was a bit more cautious in my assumptions and came up with a range of between 20K - 50K more Trump voters than Biden voters having died to date.
A lot has changed since both of these estimates. The most obvious difference is that both of those were written in the middle of the Delta Wave...but now we're in the middle of the Omicron Wave. It's also the middle of winter (which impacts how and where people congregate in different geographical regions of the country), as well as being the middle of the holiday season (Thanksgiving & Christmas in the rearview mirror, New Year's Eve coming up tomorrow).
With this in mind, and seeing how it's the end of the year, I decided to dig deeper into the data to try and come up with a more granular estimate of how many Trump voters vs. Biden voters have died of COVID since November 4, 2020...and even to look ahead and see what this gap might look like in November 2022.
Before anything else, here's what the COVID death rates look like since Election Day 2020 when broken out by Trump vote percent in 20 brackets of roughly equal population size:
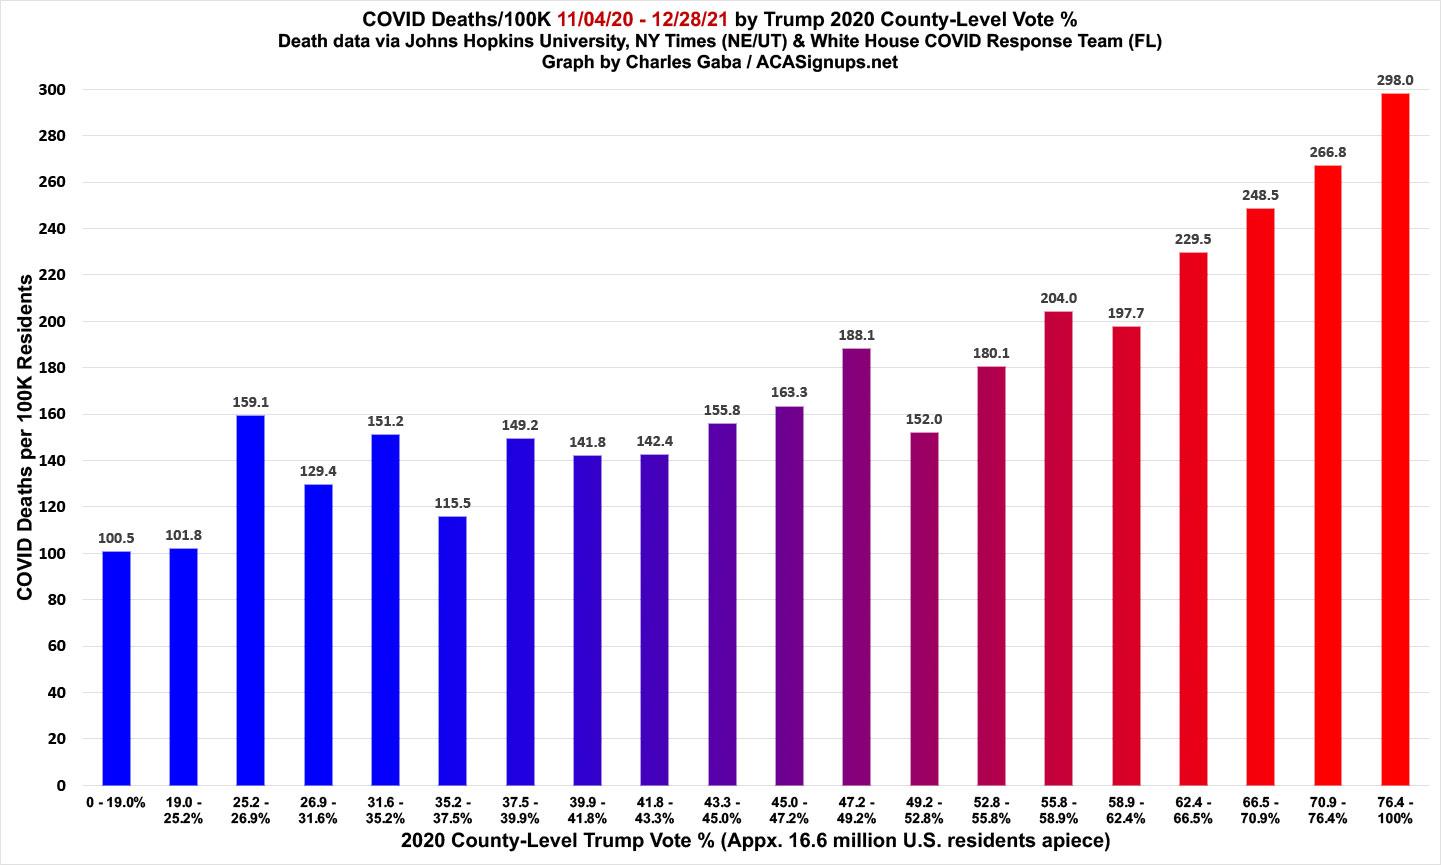
As you can see, while there's still a clear trend line upwards as you move from the bluest counties to the reddest ones, it's not nearly as dramatic as the 5:1 or 6:1 ratios which I've been posting about since June of this year. This is more like a 2.8:1 ratio between the Trumpiest 10% (top 2 brackets) and the least-Trumpy 10% (bottom 2 brackets).
Moving on, here are some vitally important caveats:
- First and foremost: All of the COVID death data is based on what county the deceased lived in. There are deep red counties which still have solid blue pockets and vice-versa, so even in a county which voted for Trump by 90%, it's still possible that every resident who died of COVID voted for BIden.
- Second: I'm being careful to label these as "Trump or Biden voters" not "Republicans or Democrats." There's always some crossover between parties as well as split-ticket voters (although far fewer of the latter than there used to be), and the election data is based purely on who they voted for President, not other races or their party registration.
- Third: Obviously, this doesn't include residents of Puerto Rico, Guam or other U.S. territories, since none of them vote in the general Presidential election.
- Fourth: Obviously, children who were under 18 last November couldn't vote. According to the latest CDC data, 803 children under 18 have died of COVID in the U.S. out of 814,000, or around 0.1% of the total. While that's still a tragedy, it doesn't really impact this particular analysis.
- Fifth: Non-U.S. citizens also can't vote, along with certain other groups of adults (those currently in prison, ex-felons in some states, etc). And of course there are tens of millions of adult U.S. citizens who were eligible to vote but didn't do so last year. I'm assuming that the COVID death rate has been roughly similar among both voters and non-voting adults alike, but of course it's certainly possible that this is incorrect.
- Sixth: Related to the above: Obviously just because someone voted last year that doesn't prove that they'll vote again next year (midterms tend to see significant drop-off in turnout, after all). It also doesn't mean they'll vote for the same party they did for President last year. And of course there are millions of people who didn't vote in 2020 who will vote in 2022...mostly among those who turned 18 in the interim, I hope.
- Seventh: For the COVID death data, I use the Johns Hopkins University Center for Systems Science and Engineering github database for 47 states. For Florida I'm relying on the White House COVID-19 Team's Community Profile Report. For Nebraska and Utah I'm using the New York Times' COVID-19 Data in the United States github database.
- Eighth: Around ~4% of total U.S. COVID deaths have either an unknown county of residence or are categorized as being "Out of State." I'm only counting deaths whose county of residence has been established.
WITH ALL OF THAT UNDERSTOOD, here's my methodology:
- For each U.S. county (Louisiana calls them parishes; Alaska calls them "census areas" or "boroughs"; Virginia has some cities which are also considered "county-equivalents"), I looked at the total population via the 2020 U.S. Census; total votes for Trump, Biden and third parties (via the various state Election Commissions or Secretary of State websites); what percent of the total vote was won by Trump & Biden; the total population 18 or older (via the U.S. Census Bureau); and of course how many residents have died of COVID-19 in that county since 11/04/20.
- I then used the voter turnout rate (out of residents 18+) to estimate what percent of those who died of COVID likely voted in November 2020.
- I then multiplied that number by what percent of the vote Trump & Biden received to estimate how many Trump or Biden voters have likely died between 11/04/20 - 12/28/21, and subtracted the difference.
Let's use my own home of Oakland County, Michigan as an example:
- Total Population: 1,274,395
- Total Population 18+: 997,503 (estimated)
- Trump Votes: 325,971 (42.2%)
- Biden Votes: 434,148 (56.2%)
- Other Votes: 11,872 (1.5%)
- Total Votes: 771,991 (77.4% of the 18+ population)
- COVID deaths as of 11/04/20: 1,244
- COVID deaths as of 12/28/21: 3,071
- COVID deaths since 11/04/20: 1,827
- Likely 2020 voter deaths: 1,414 (1,827 x 77.4%)
If you base the partisan deaths purely on what percent of the vote was won by Trump or Biden, with no other factors, you'd get roughly 597 Trump voters and 795 Biden voters, or 198 more Biden voter deaths than Trump voter deaths.
You might assume that doing this across every county would result in the exact same proportions as the national popular vote, with 51.3% of the total being Biden voters vs. 46.9% being Trump voters (around 15,400 more Biden voters having died than Trump voters). HOWEVER, that's not how it works out at all...mostly due to the wide variances in turnout from county to county.
Remember, a county with 500,000 residents with 50% turnout is still going to utterly swamp a county with 50,000 residents but 70% turnout in terms of raw numbers...and if those counties swing heavily red or blue, that can make a huge difference. So while the Trump/Biden ratio within each individual county matches the popular vote percentages, once you start combining counties with different turnout levels the ratios can change quite a bit.
As an example, let's use Wyoming. I've chosen it because it was both the reddest state in the country last year and it only has 23 counties, making it easy to fit as a case study here:
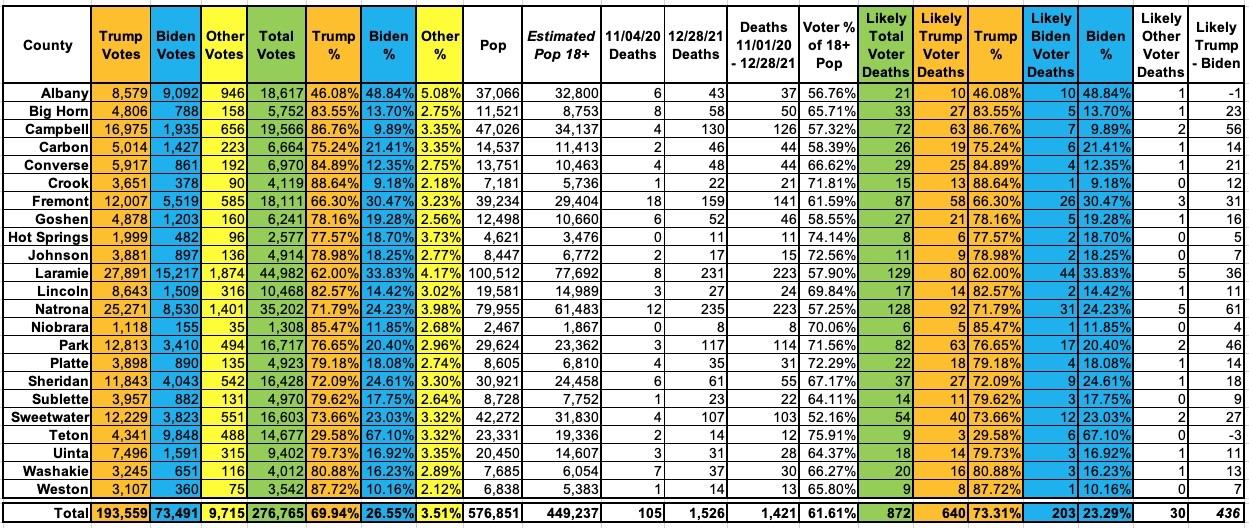
Notice that the Trump/Biden voter death estimate for each individual county matches the percent of the popular vote...yet when you combine all 23 counties, the Trump voter deaths come in at 73.3% of the total vs. Trump's 69.9% vote win. Biden's estimate comes in at 23.3% vs. his 26.6% vote performance statewide.
Here's what this looks like for all 50 states + DC:
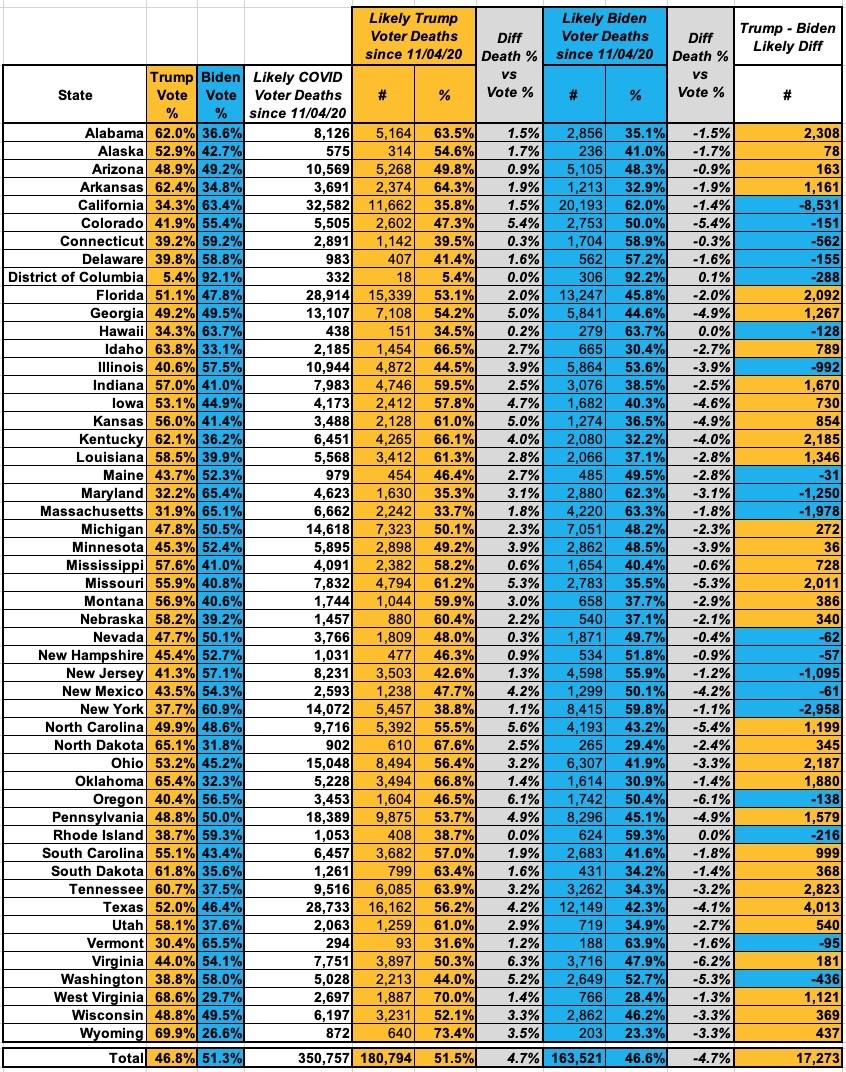
Again, using no other factors besides the county-level 2020 voter turnout rate and vote percent for each candidate, this suggests that around 17,300 more Trump voters have died of COVID-19 since Election Day than Biden voters nationally. While there are plenty of blue states where the reverse is true, these are more than cancelled out by the 4.7 point national increase between Trump's percent of the popular vote to the likely portion of COVID victims who voted for him last year.
Not only does this show a 4.7% gap nationally, there's at least some increase in every state except Rhode Island (and the District of Columbia, where he only received 5.4% of the vote to begin with).
In other words, instead of 15,400 more Biden voters than Trump voters having died to date, this model suggests that it's actually likely around 17,300 more Trump voters who have died.
Again, everything above assumes the baseline. What if it turns out that there's a lot more COVID deaths which aren't being reported accurately? Via Dillon Bergin AND Rudi Keller of the Missouri Independent:
In Cape Girardeau County, the coroner hasn’t pronounced a single person dead of COVID-19 in 2021.
Wavis Jordan, a Republican who was elected last year to serve as coroner of the 80,000-person county, says his office “doesn’t do COVID deaths.” He does not investigate deaths himself, and requires families to provide proof of a positive COVID-19 test before including it on a death certificate.
Meanwhile, deaths at home attributed to conditions with symptoms that look a lot like COVID-19 — heart attacks, Alzheimer’s and chronic obstructive pulmonary disease — increased.
“When it comes to COVID, we don’t do a test,” Jordan said, “so we don’t know if someone has COVID or not.”
Nationwide, nearly 1 million more Americans have died in 2020 and 2021 than in normal, pre-pandemic years, but about 800,000 deaths have been officially attributed to COVID-19, according to Centers for Disease Control and Prevention data.
A majority of those additional 195,000 deaths are unidentified COVID-19 cases, public health experts have long suggested, pointing to the unusual increase in deaths from natural causes.
...Short-staffed, undertrained and overworked coroners and medical examiners took families at their word when they called to report the death of a relative at home. Coroners and medical examiners didn’t review medical histories or order tests to look for COVID-19.
...These trends are clear in small cities and rural areas with less access to healthcare and fewer physicians. They’re especially pronounced in rural areas of the South and Western United States, areas that heavily voted for former President Donald Trump in the 2020 presidential election.
Cape Girardeau County in Missouri; Hinds and Rankin counties in Mississippi; and Lafayette Parish in Louisiana are four of the 10 counties with the greatest spike in deaths not attributed to COVID-19. In those communities, official COVID-19 deaths account for just half of the increase in deaths in 2020.
For the record:
- Cape Giraldeau County, MO: Pop. 82K; Trump won with 70.5% of the vote
- Hinds County, MS: Pop. 223K; Biden won with 73.4% of the vote
- Rankin County, MS: Pop. 157K; Trump won with 71.9% of the vote
- Lafayette Parish, LA: Pop. 242K; Trump won with 63.3% of the vote
While one of the four counties cited voted heavily for Biden, the other 3 all voted heavily for Trump (and have more than twice the total population of Hinds County).
What if it turns out that the Trump/Biden voter death gap is, say, 5% higher nationally and at the state level than my baseline estimate above? That is, if I were to shift each statewide Trump number 5% higher and each Biden number 5% lower (that's percent, not percentage points; an important distinction)? Well, that would look like this:
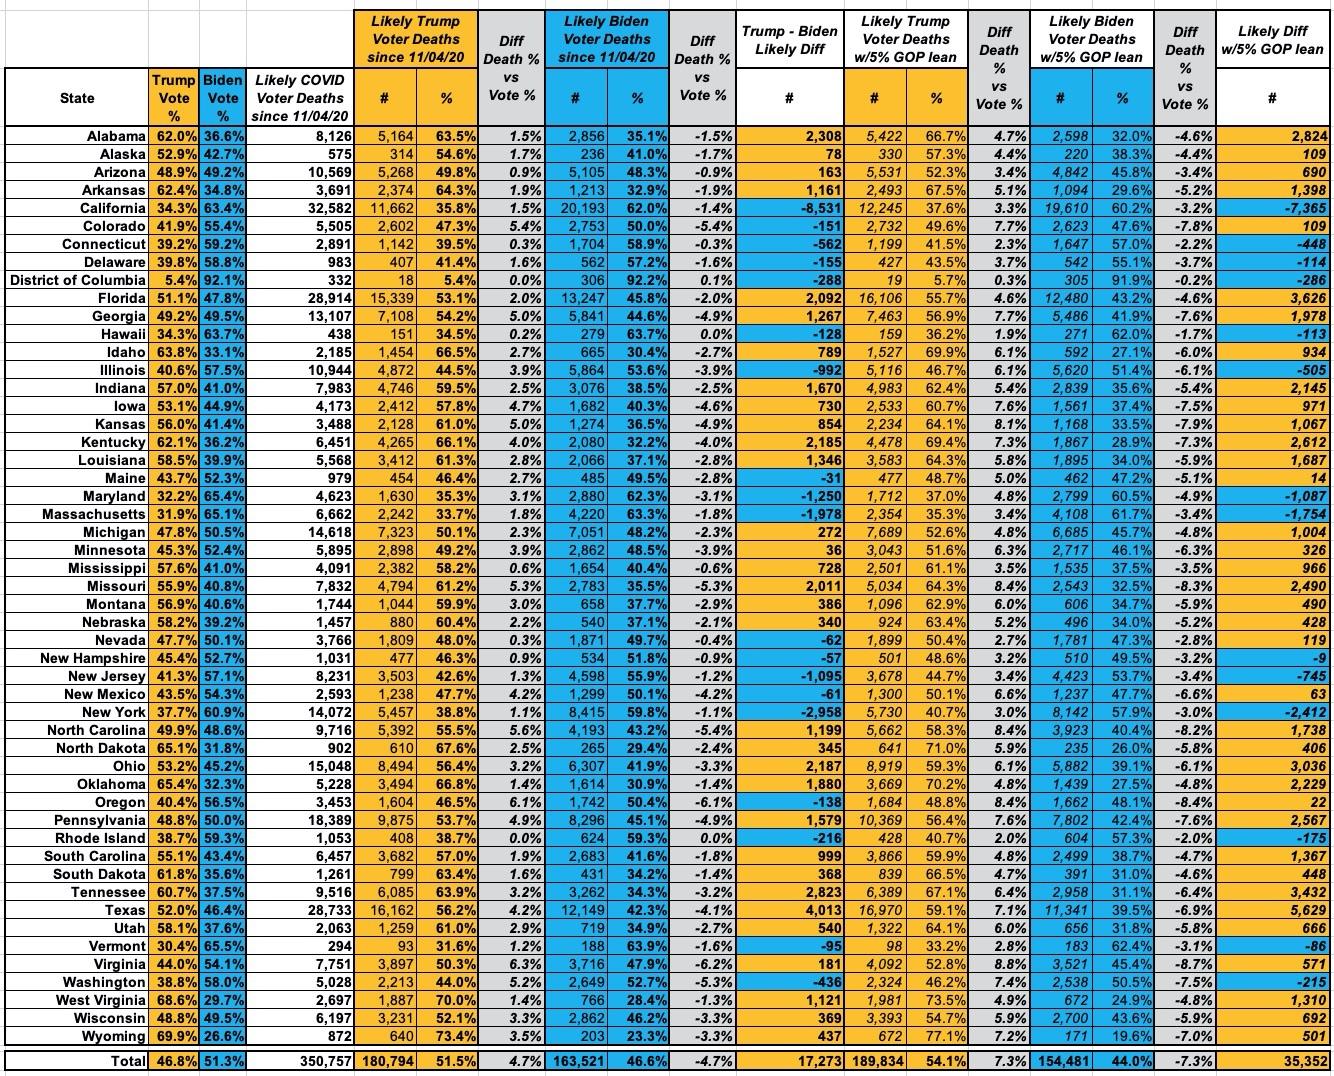
Instead of 17,300 more Trump voters, it would be a little over double that, or around 35,300 more.
On the one hand, this is a miniscule number compared to the 331 million people who live in the 50 states + DC, or even when compared to the 159 million votes cast last year.
On the other hand, remember that this would actually be closer to a 50,700 shift when you include the 15,400 additional Biden voters who you'd expect to have died of COVID over the past 14 months. Joe Biden may have won by 8 million votes nationally, but he only won Arizona, Georgia and Wisconsin by a combined 45,000 votes or so.
There's also no way of knowing how COVID deaths or the red/blue divide will play out going forward between now and next November.
Let's assume a worst-case scenario: COVID deaths continue throughout the year at a horrific rate of 1,000 Americans dying of it each day. That would mean roughly 300,000 more Americans dying between now and the end of October.
Let's further assume that the red county/blue county ratio continues at roughly the same rate it has been in December 2021 (that is, with the death rate in the reddest tenth of the country running roughly 6x higher than the bluest tenth). IF that were to play out for the next ten months, it would look something like the following. I've also included scenarios in which the rate leans towards Trump by 5% or 10%:
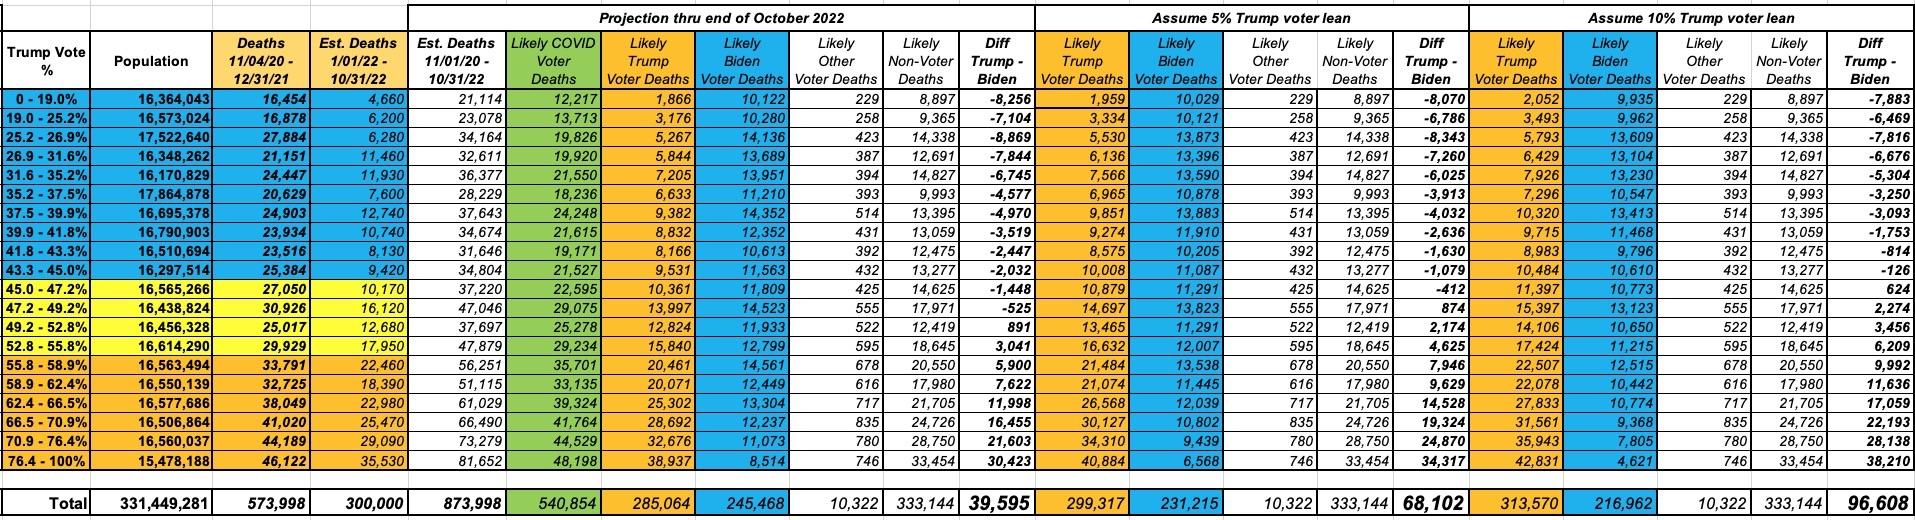
If things were to play out like the above, it would mean a gap of between 40,000 - 97,000 nationally by the midterms.
Of course, there are no national races scheduled for 2022...everything will be at the state, Congressional District or local level.
As I understand it, the "Swing States" for statewide races include Arizona, Florida, Georgia, Iowa, Michigan, Minnesota, Nevada, New Hampshire, North Carolina, Ohio, Pennsylvania, Texas and Wisconsin. In those states, the Trump voter gap is only 1,000 or higher in FL, GA, MI, NC, OH, PA & TX, even with that 5% adjustment. If you assume these were to each double by next November, they'd range between 2,000 - 11,000 more Trump voters than Biden voters having passed away from COVID by the time the midterms come around, depending on the state.
Would that be enough to swing a statewide election? Probably not, but it's certainly possible.
What about Congressional, state legislative or local races? Well, all of my data is by county, not Congressional or state legislative district, so that's a complete unknown. I do know that Los Angeles County, CA and Cook County, IL have the largest number of "extra" Biden voter deaths (which makes sense, given how huge these counties are), at 4,900 and 1,900 respectively. At the opposite end, Ocean County, NJ and Mohave County, AZ have the largest "extra" Trump deaths to date (around 300 apiece). Again, if you assume COVID continues to ravage the nation at a similar pace and similar ratios throughout 2022, I suppose you could double each of these figures.
The bottom line is that even if 2022 plays out more like the last six months (the reddest counties seeing up to 6x more COVID deaths than the bluest counties) instead of the 2.8x higher ratio when you include November 2020 - June 2021, I still don't see the national "gap" being more than a couple hundred thousand people at most. Electorally, this could make a difference in a handful of state-level races and perhaps in a handful of very tight Congressional races, but no, I don't expect to see a significant Democratic advantage as a result of the "partisan COVID death gap"...expecially since a scenario in which COVID deaths and hospitalizations continue to overwhelm the nation for a third year, regardless of whether this is being encouraged by the GOP or not, would likely be a political disaster for Democrats in the midterms.
Republican leadership knows this, of course...which is exactly why, as I noted in my earlier posts:
In 1991, there was a great little courtroom drama directed by Michael Apted called "Class Action" starring Gene Hackman and Mary Elizabeth Mastrantonio:
The story is about a lawsuit concerning injuries caused by a defective automobile. The suit takes on a personal dimension because the injured plaintiff's attorney, Jedediah Tucker Ward discovers that the automobile manufacturer's attorney is his estranged daughter Maggie Ward.
...The auto manufacturer in the film also utilizes a "bean-counting" approach to risk management, whereby the projections of actuaries for probable deaths and injured car-owners is weighed against the cost of re-tooling and re-manufacturing the car without the defect (exploding gas tanks) with the resulting decision to keep the car as-is to positively benefit short term profitability.
Class Action's plot wasn't technically based on the infamous Ford Pinto scandal, but it sure as hell is analogous to it.
There's a particularly chilling scene in which Mastrantonio's character, who's actually defending the auto company in the lawsuit, privately asks one of the safety test executives at the company (played by Fred Dalton Thompson) why they didn't simply replace the faulty part in the first place:
Maggie: May I ask a question, please?
Getchell: Sure.
Maggie: Why didn't you just change the blinker circuit? It's just a question.
Getchell: I told Flannery about the problem a month or so before he died. He called in his head bean counter.
Maggie: What's that? Risk management expert, right?
Getchell: Yeah. Flannery shows him the data and asks him how much it would cost to retrofit...
Maggie: You mean recall?
Getchell: Yeah, you got it. To retrofit 175,000 units. Multiply that times 300 bucks a car, give or take. You're looking at around $50 million.
So the risk guy, he crunches the numbers some more. He figures you'd have a fireball collision about every 3,000 cars.
That's 158 explosions. Which is almost as many plaintiffs as there are. These guys know their numbers.
So you multiply that times $200,000 per lawsuit. That's assuming everybody sues and wins. 30 million max.
See? It's cheaper to deal with the lawsuits than it is to fix the blinker.
It's what the bean counters call a simple actuarial analysis.
This is perhaps the most cynical thing I've ever typed in a blog entry, but there's no getting around it:
GOP leadership, FOX News, Trump/MAGA etc don't appear to care how many of their own voters die as long as they damage President Biden's approval rating in the process.
While I'm sure they'd much rather every person who dies of COVID be a Democrat, losing ~250,000 of their own supporters (or whatever) appears to be a small price to pay if it results in them flipping control of the House and/or Senate next year.
Furthermore, while that may sound like a high number, keep in mind that most of those either live in areas which are already pretty Blue or solidly Red to begin with. A GOP Congressperson used to winning with 75% of the vote isn't going to lose much sleep over that number being knocked down to 70% or even 65%.
Advertisement
