

1.43 million SEP enrollments confirmed; 1.65 million estimated
Tue, 06/15/2021 - 4:50pm
Yesterday's big story on the ACA front was that the HHS Dept. confirmed more than 1.24 million additional Qualified Health Plan (QHP) selections via the federal exchange (HealthCare.Gov) so far during the ongoing Special Enrollment Period (which runs through 8/15).
In addition to that, however, I've also been tracking the (admittedly scattershot) SEP enrollments across the other 15 states (including DC) which operate their own ACA exchanges. So far only 10 of the State-Based Marketplaces (SBMs) have released any SEP enrollment data, and even then it's been very incomplete. Washington State only released data for the first 9 days of the SEP, for instance...while Pennie (Pennsylvania) just released data all the way through yesterday.
A couple of weeks ago, I projected that HC.gov SEP enrollment as of the end of May was likely around 1.2 million, which I was proven correct on. I also estimated that SBM SEP enrollment was likely around 400,000 or so, for total SEP enrollment of roughly 1.6 million as of the end of May.
With yesterday's press release confirming (beating, actually) my 1.2 million HC.gov estimate, I've now confirmed at least 1,428,227 SEP QHPs nationally, with the balance coming from the various SBM press releases.
However, I'm still pretty sure that the actual total is more like 1.65 million, with the remaining ~225,000 coming from the SBMs which haven't reported anything yet or which have only reported partial data. As evidence, let's take a look at what we know and extrapolate from there.
As I've noted before (and as Andrew Sprung has also written about), the single biggest determinant of how SEP enrollment has gone for a given state is whether it expanded Medicaid or not. SEP enrollment in expansion states has increased 2.3x over the pre-COVID average, but in NON-expansion states it's more than 4x as high, due to the 100 - 138% FPL "overlap" population qualifying for exchange coverage in non-expansion states only (in expansion states these folks are moved to Medicaid instead, of course).
By an amazing coincidence, with Idaho launching Medicaid expansion last year, every NON-expansion state is now hosted by HealthCare.Gov...while every one of the 15 state-based exchanges is an expansion state. This actually makes it pretty easy to break the HC.gov data out between the two, providing a more accurate baseline for estimating SEP enrollment on the SBMs.
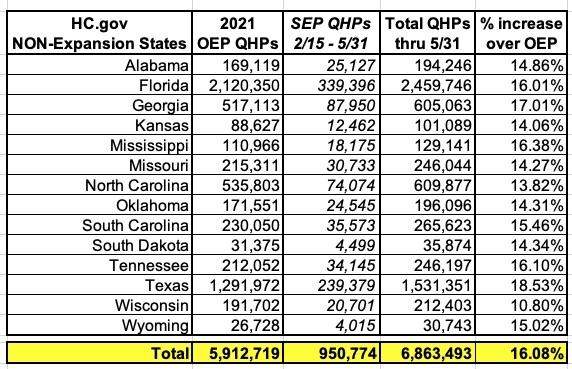
First, here's the NON-expansion states hosted on the federal exchange. I'm using the official 2021 Open Enrollment Period (OEP) totals to compare against. As you can see, if you add the just-confirmed SEP QHPs to these, the combined totals average around 16.1% higher.
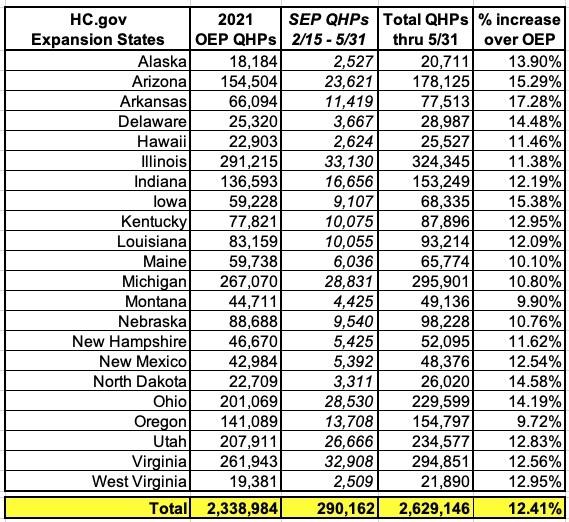
Next, here's the EXPANSION states on the federal exchange. As expected, adding SEP QHPs to these only increases the total by a lower amount...12.4%:
Since all 15 of the state-based exchanges are also expansion states, it stands to reason that they're likely to have seen the lower-bound SEP numbers. Furthermore, since Pennsylvania's combined total as of 6/14 is only 11.5% higher, and that includes an extra two weeks.
With that in mind, I'm gonna knock my estimate down to an 11% increase on average, which would give something close to the following:
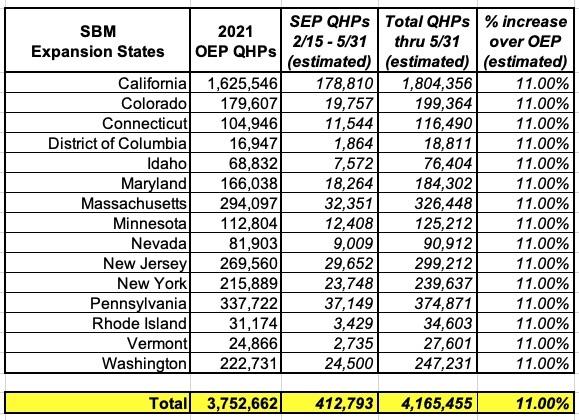
Add these three up and you get 1,653,729 total (with Pennsylvania coming in around 1,800 lower as of 5/31 than as of today).
Obviously this is just a spitball estimate, but it should be pretty close.
Meanwhile, here's an updated table showing how each state's SEP enrollment has increased over the same time period in 2019 and 2020. Keep in mind that the SBM states (in blue) are NOT based on 2/15 - 5/31 (106 days) but rather on anywhere from 9 - 120 days depending on the state; that's why I use per-day averages.
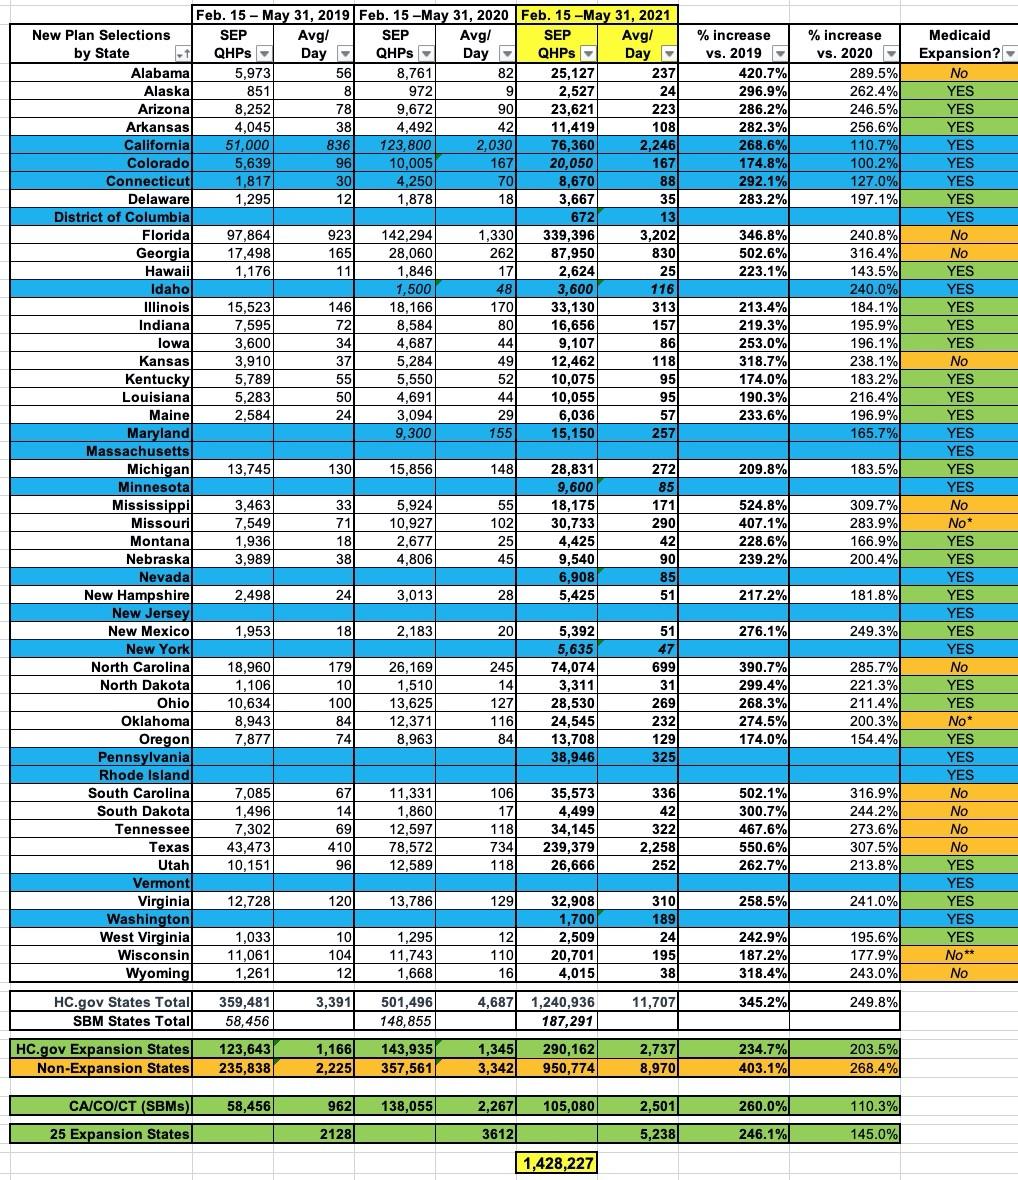
Again, Medicaid Expansion states are only up 235% over 2019 (2.35x) while the non-Expansion states are up 403% (4.0x).
There's only 3 SBM states for which I have SEP enrollment for 2019 as well as 2021. They appear to be performing somewhat better than other expansion states, but not that much (260% or 2.6x higher vs. 2.35x). When you combine them with the other 22 expansion states I have comparison data for, it brings the average up to 246% (2.46x as many SEPs on average).
Advertisement
