

Weekly Update: How #COVID19 has spread across every U.S. state & territory per capita over time
Fri, 12/18/2020 - 9:45pm
A picture is worth 1,000 words and all that.
I was doing this earlier in the summer but stopped updating it in August; I've started over with a fresh spreadsheet and have expanded it to include every U.S. territory, including not just DC & Puerto Rico but also American Samoa, Guam, the U.S. Virgin Islands and even the Northern Mariana Islands.
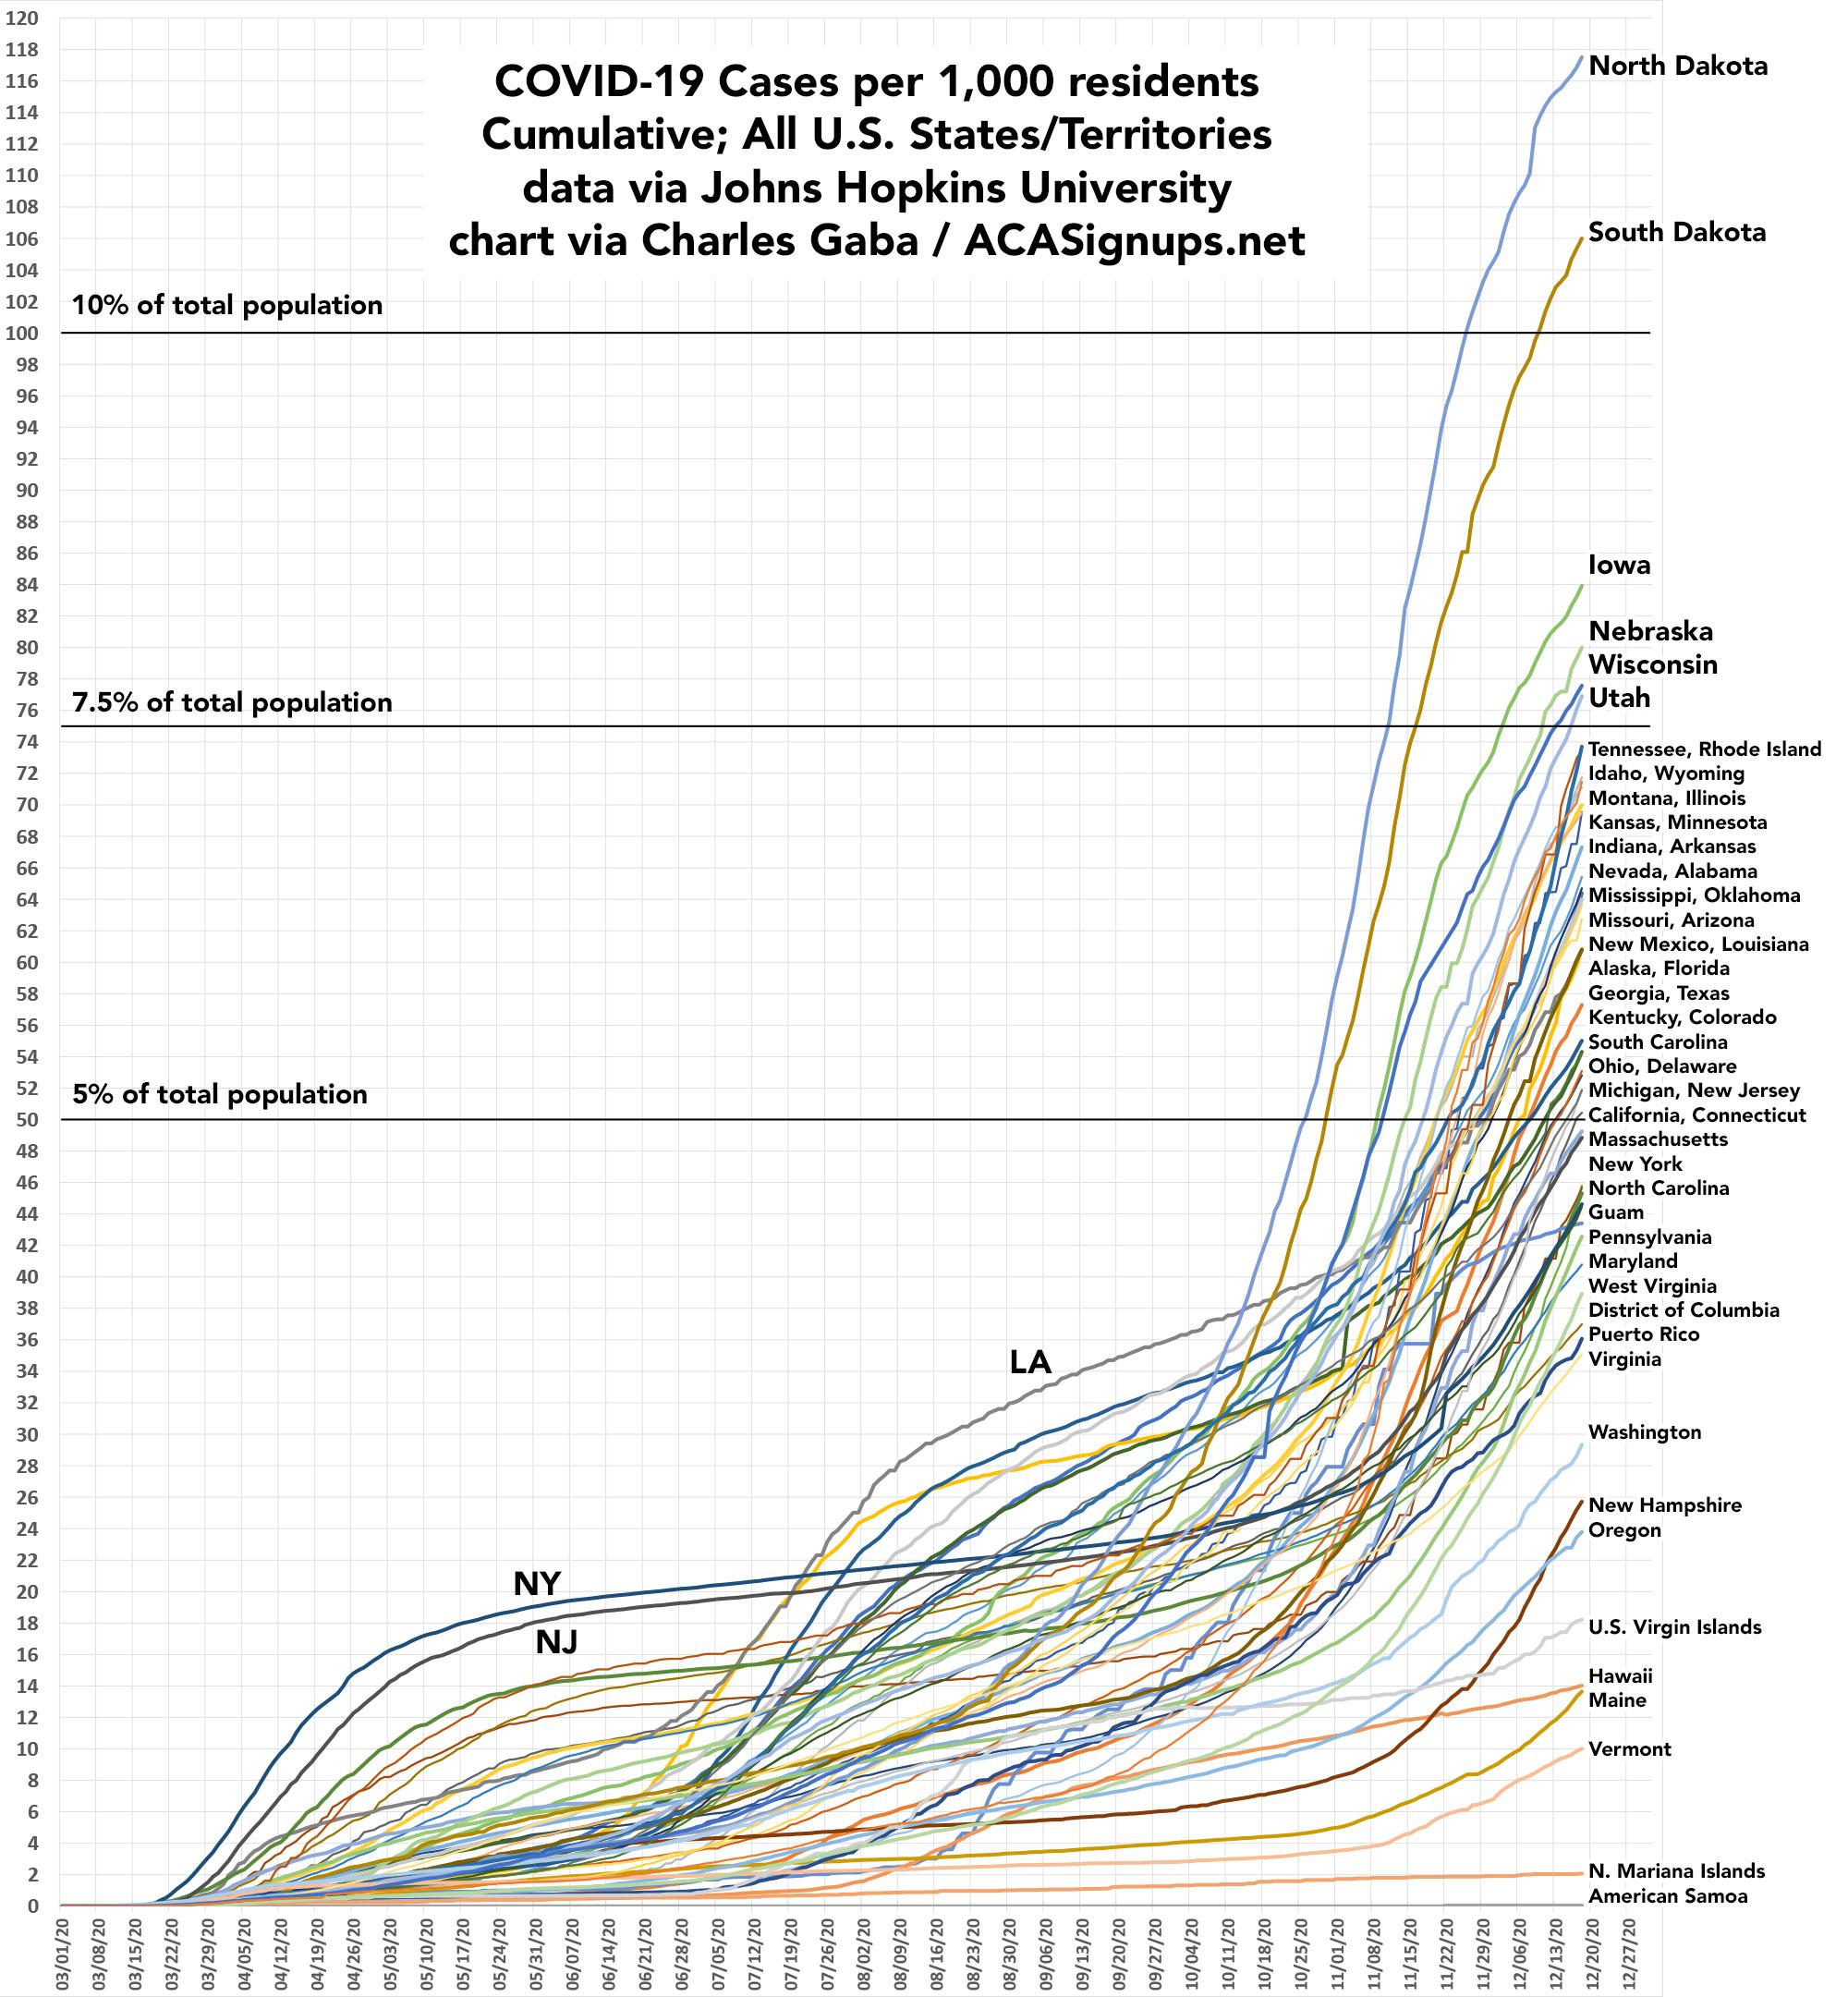
I've done my best to label every state/territory, which obviously isn't easy to do for most of them given how tangled it gets in the middle. The most obvious point is that New York and New Jersey, which towered over every other state last spring, are now utterly dwarfed by North & South Dakota, which are skyrocketing.
North and South Dakota are the first two states where more than 10% of the entire population has tested positive (in fact, North Dakota is about to hit 12%. Iowa, Wisconsin, Nebraska and Utah could all potentially hit the 10% milestone by New Year's Eve as well.
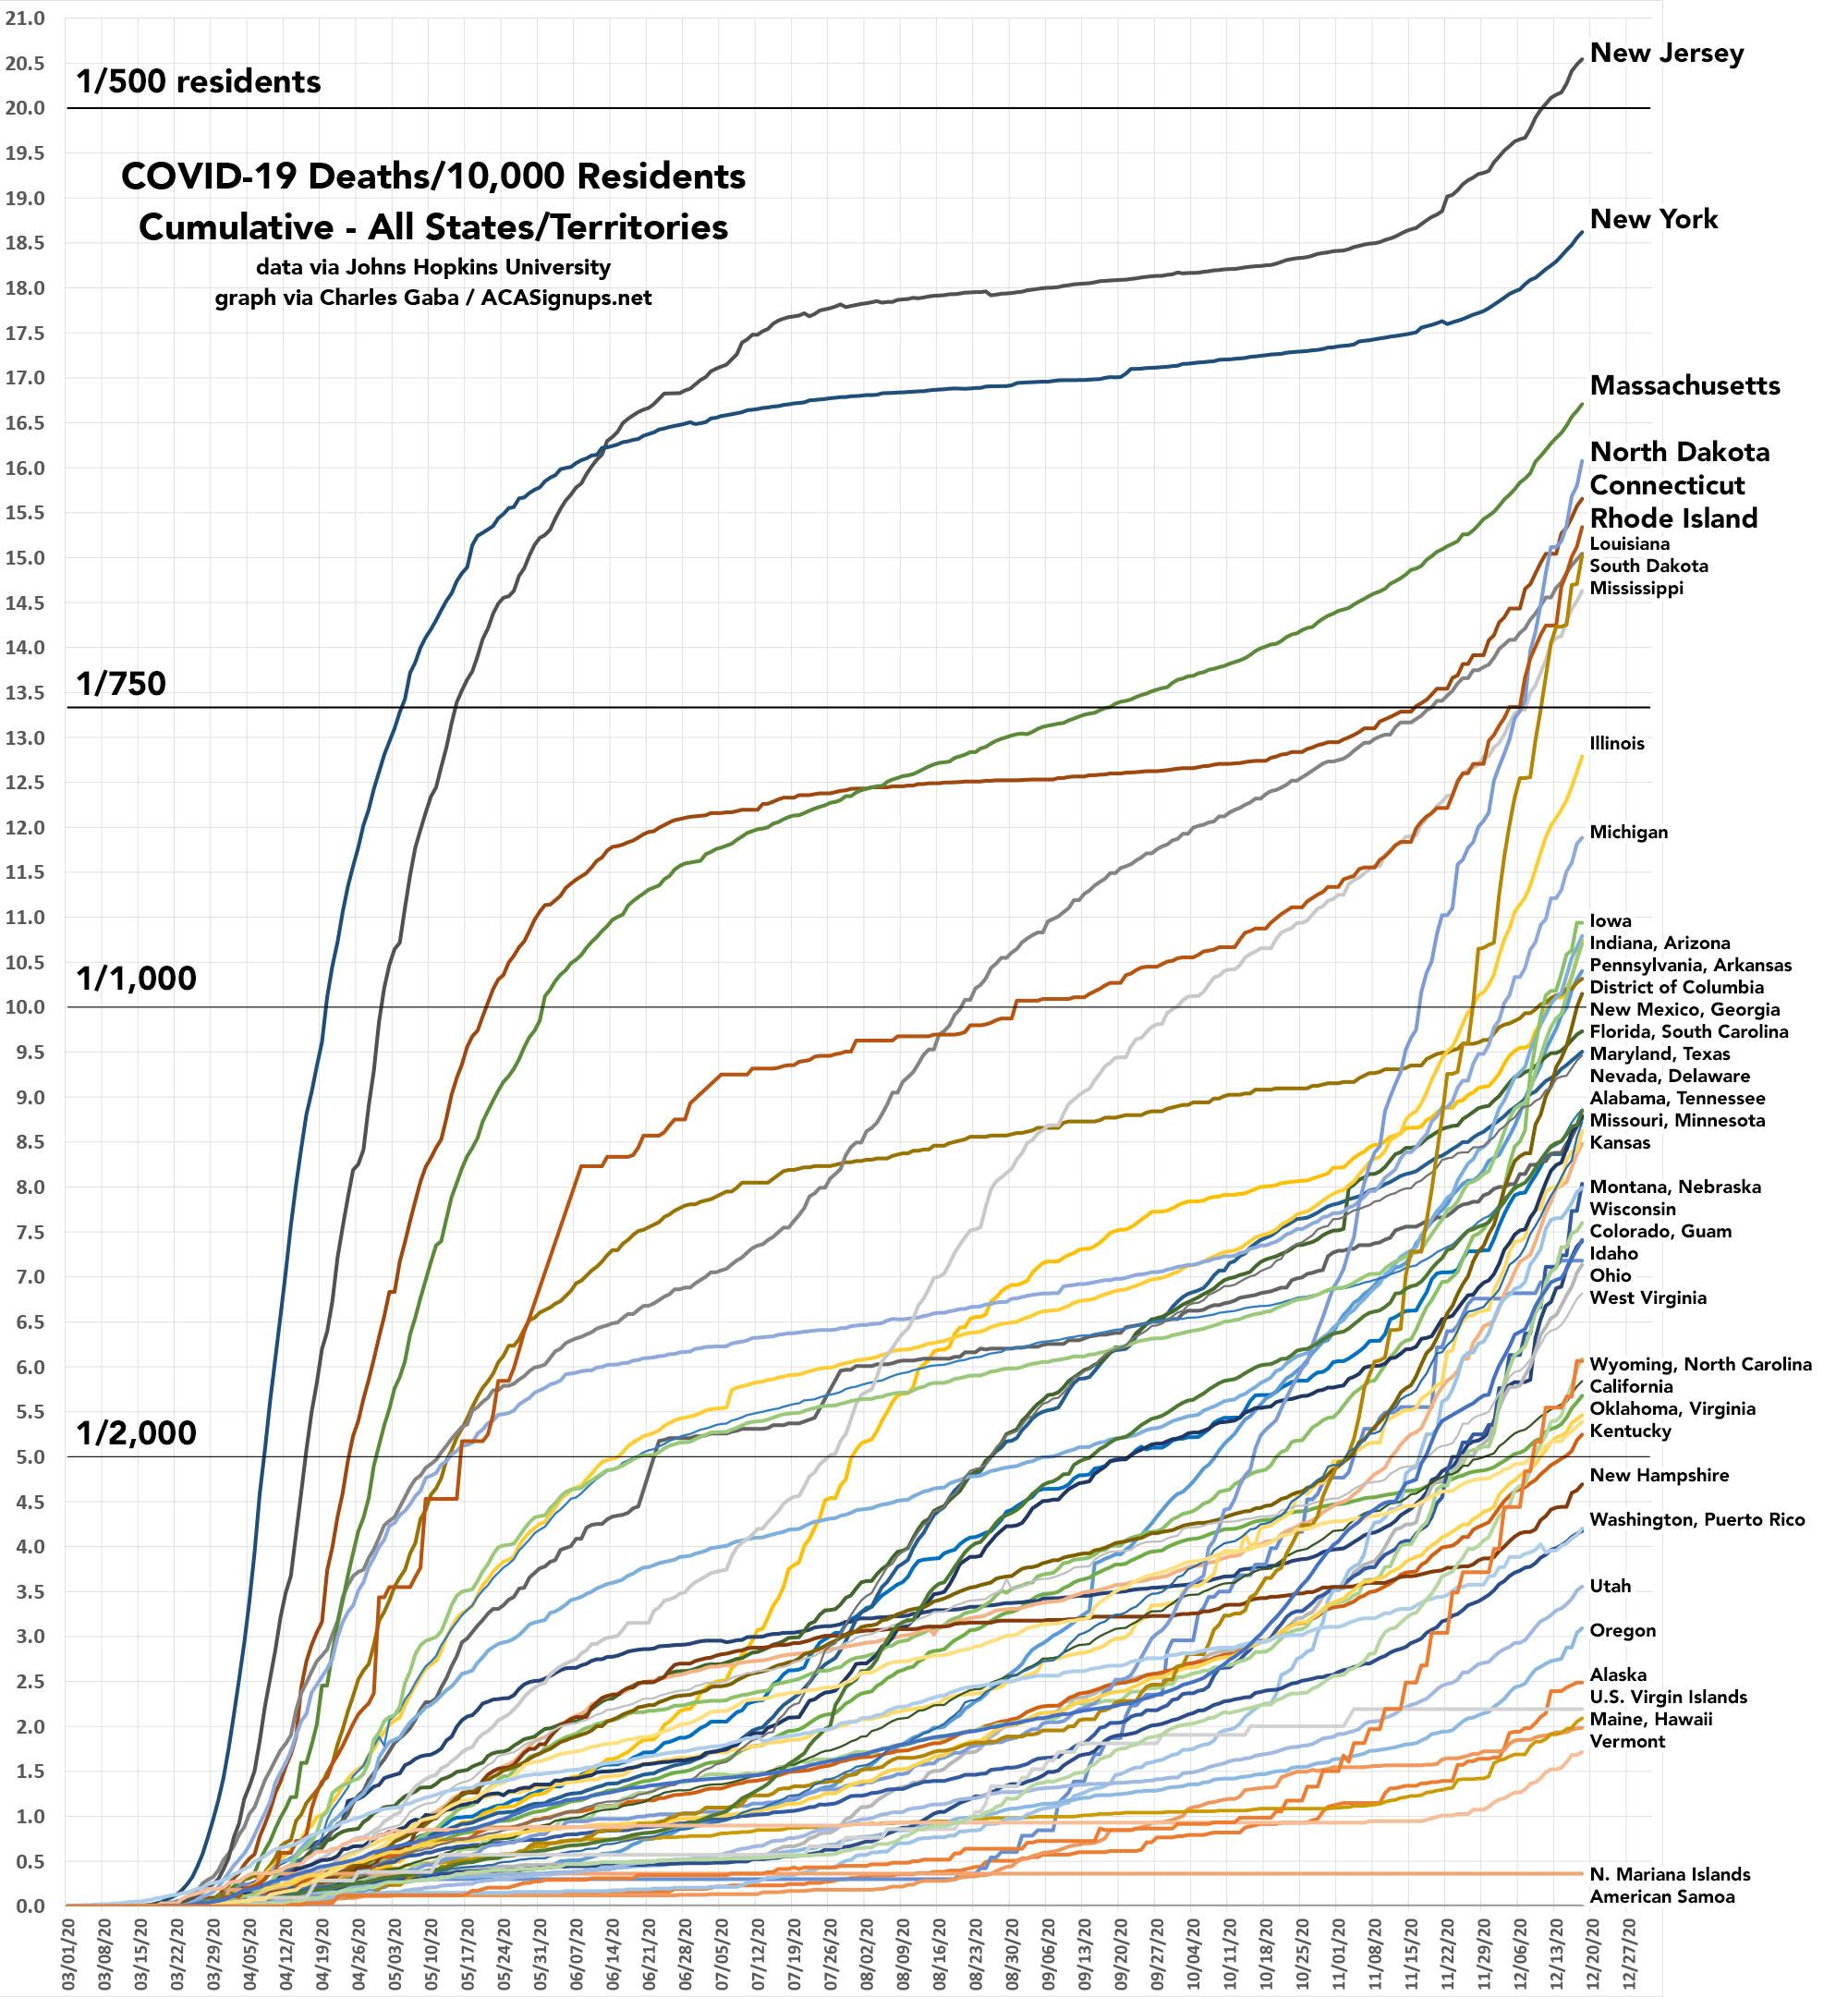
Next, let's look at the cumulative mortality rate for every U.S. state and territory. Here, New Jersey and New York are still far worse than the rest of the country due to their mass deaths from March - May this past spring...but as you can see, several other states are, tragically, also catching up to them on this front as well.
New Jersey is the first state in which COVID-19 has killed more than 1 out of every 500 residents. There are eight other states where it's killed 1 out of 750 or more: New York, Massachusetts, North Dakota, Connecticut, Rhode Island, Louisiana, South Dakota and Mississippi.
Eighteen states have now broken the 1 out of 1,000 threshold, and several more will likely hit that point by New Year's Eve.
Advertisement
