

Mark Farrah: 14.9M enrolled in total Individual Market as of March 2020 (w/caveats)
Thu, 07/30/2020 - 11:02am
Mark Farrah Associates just released their semi-quarterly overview of the individual health insurance market. Their data is among the best in the industry, but there's still several important caveats to keep in mind, including an important one which likely went public too late for them to include in their analysis.
According to financial statements filed by insurers and estimates by Mark Farrah Associates, enrollment in individual, non-group medical plans, both on and off the exchange, totaled approximately 14.9 million as of March 31, 2020. In addition, the Centers for Medicare & Medicaid Services (CMS) reported in the Health Insurance Exchanges 2020 Open Enrollment Report that approximately 11.4 million consumers enrolled in Marketplace plans following the 2020 open enrollment period (OEP). This includes more than 8.3 million enrolled in the 38 states using the HealthCare.gov platform and 3.1 million enrolled in the remaining State-Based Marketplaces. In this brief, Mark Farrah Associates (MFA) provides insights into individual health insurance enrollment trends and market developments with state-by-state membership comparisons.
Farrah's analysis breaks the 14.9 million total out into roughly 11.4 million on-exchange and 3.5 million off-exchange. The only problem with this is that the 11.4 million figure is based on total QHP selections during the 2020 Open Enrollment Period. Actual on-exchange effectuated enrollment was 10.7 million people, according to the Early 2020 Effectuated Enrollment Report just released by the Centers for Medicare & Medicaid (CMS) just two days ago. Since CMS's report is as of February and Farrah's data is as of March 31st, that means that the split is actually 10.7 million on-exchange / 4.2 million off-exchange, or 72% vs. 28%.
In March 2020, health insurers reported total individual, non-group coverage for approximately 14.9 million people, based on statutory financial statements filed with state regulators and the NAIC (National Association of Insurance Commissioners) and the CA DMHC (California Department of Managed Health Care). This represents a 1.43% decline from the 15.2 million members in March 2019.
Again, in February 2019, on-exchange enrollment was 10.6 million, so the split has gone like so:
- Spring 2017: 10.2 million on-exchange, 7.5 million off-exchange, 17.7 million total (58% on-exchange)
- Spring 2018: 10.5 million on-exchange, 5.2 million off-exchange, 15.7 million total (67% on-exchange)
- Spring 2019: 10.6 million on-exchange, 4.6 million off-exchange, 15.2 million total (70% on-exchange)
- Spring 2020: 10.7 million on-exchange, 4.2 million off-exchange, 14.9 million total (72% on-exchange)
However, there's another vitally important caveat here as well:
As indicated in the heat map below, California, Florida, and Texas had the highest number of enrollees, with Florida covering nearly 2.3 million members as of 1Q20. It is important to note that Mark Farrah Associates (MFA) applied enrollment figures for select carriers not required to report health enrollment on a quarterly basis and made other adjustments based on market analysis. Furthermore, individual enrollment includes short term plan enrollees and may include Medicaid programs, such as CHIP, as some states include subsidized lines in the individual segment. These factors may have resulted in moderate understatement or overstatement of enrollment.
This is extremely important considering that, according to a recent investigation by the House Energy & Commerce Committee, around 3 million Americans enrolled in short-term, limited duration plans (aka #ShortAssPlans) in 2019. This doesn't necessarily mean that #ShortAssPlans account for 3 million of the 4.2 million off-exchange plans in Farrah's report; if one person enrolls in a STLD plan for 6 months, then switches to other coverage, while someone else enrolls for the second half of the year, that would only equal one "enrollment year". I'm also not sure if Farrah's data includes all ShortAssPlans; it could be just a subset depending on how different carriers/states record and report them. SEE UPDATE BELOW
Having said that, this still strongly suggests that off-exchange ACA-complilant enrollment is significantly lower than 4.2 million, especially when you also throw in some CHIP enrollment as well as the possibility of "grandfathered" and "transitional" individual market enrollees also being part of that mix. Interestingly, Farrah's report doesn't mention either of these at all...I suspect they're probably down to below 1 million enrollees combined by now, but that's still a lot of people out of fewer than 15 million total.
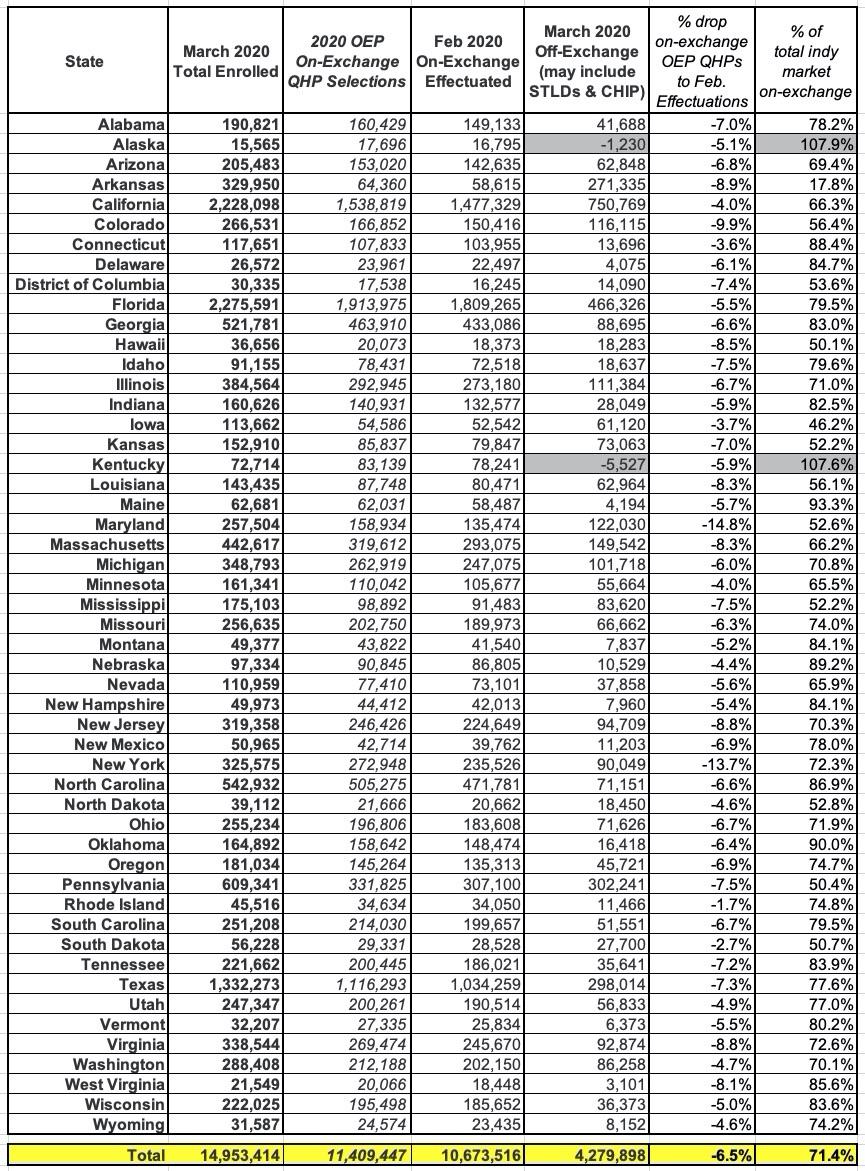
With these points in mind, I'm using Farrah's total enrollment estimates for each state in the table below, but am using CMS's Feb. 2020 Effectuated Enrollment data for on-exchange enrollment. I've also added columns showing the percent drop in effectuated enrollment from the official QHP selection total as well as the percent of the total individual market which is now on-exchange. It's worth noting that there's a big discrepancy in at least two states...Mark Farrah lists both Alaska and Kentucky as having fewer people enrolled total than are enrolled on-exchange alone, which is of course impossible. I'm assuming this is due to either a clerical error or disjointed reporting times, but assuming they're both very close to accurate, this means that pretty much the entire individual market is on-exchange in both states.
The flip side of this is the District of Columbia, which shows only a little over 50% of their indy market being on-exchange. This makes no sense as all ACA-compliant individual market policies in DC have been on-exchange exclusively since 2014. I'm assuming this is where the #ShortAssPlan and CHIP enrollment figures come in, but I'm not sure.
One more noteworthy item: The "HOW MANY HAVE PAID??? talking point has gone from around ~88% in 2014 to over 90% a few years later to a whopping 93.5% today!
Even if you assume that ~200,000 of the 10.7 million February enrollees are actually folks who enrolled via Special Enrollment Period between 12/15 - 1/15 (remember, in most states you have to enroll by the 15th of the month in order to be effectuated by the 1st of the following month), that still puts it at ~10.5 million out of 11.4 million, or over 92% of the official OEP QHP enrollees paying their first couple of monthly premiums.
Farrah also includes a bit about the impact of COVID-19 on the individual market:
The individual market continues to face hefty challenges especially amidst the current socio-economic implications of the coronavirus outbreak. However, while individual health insurance business has been experiencing enrollment declines, plans reported a healthy net underwriting gain of $4.2 billion in 2019. Open enrollment for 2021 coverage starts on Nov. 1st and runs through Dec. 15th, although some states, including New York, California and Massachusetts have permanently extended their open enrollment periods. It is likely the individual segment may experience significant impacts of the pandemic and current economic crisis. As we await data from the remaining quarters of 2020 and health companies begin to finalize premium rates in preparation for 2021, Mark Farrah Associates will continue to report on important developments and performance metrics.
That's overstating it a bit--Massachusetts did eventually let their COVID-19 SEP expire a week ago, and New York's and California's are officially set to expire in August...but it wouldn't surprise me if either or both of them did exactly that, since they've both bumped their deadlines out every month for 3-4 months in a row already. DC's exchange, meanwhile, has their "deadline" all the way out in September already, so Farrah's note here may prove to be accurate after all.
UPDATE: Andrew Sprung reminded me that the Kaiser Family Foundation estimated that the total off-exchange ACA-compliant individual market at just 2.1 million people as of March 2019. If you assume further attrition over the past year, that's not far off from the 1.2 million figure if you subtract 3.0 million #ShortAssPlans from the 4.2 million off-exchange total. If so, that would mean that the total ACA-compliant market could be as small as 12.0 million people at the moment, with 90% of it being on-exchange.
Advertisement
