

Weekly Update: Every Official COVID-19 Case per capita Over Time, All 50 States + DC & PR
Sun, 06/21/2020 - 8:17am
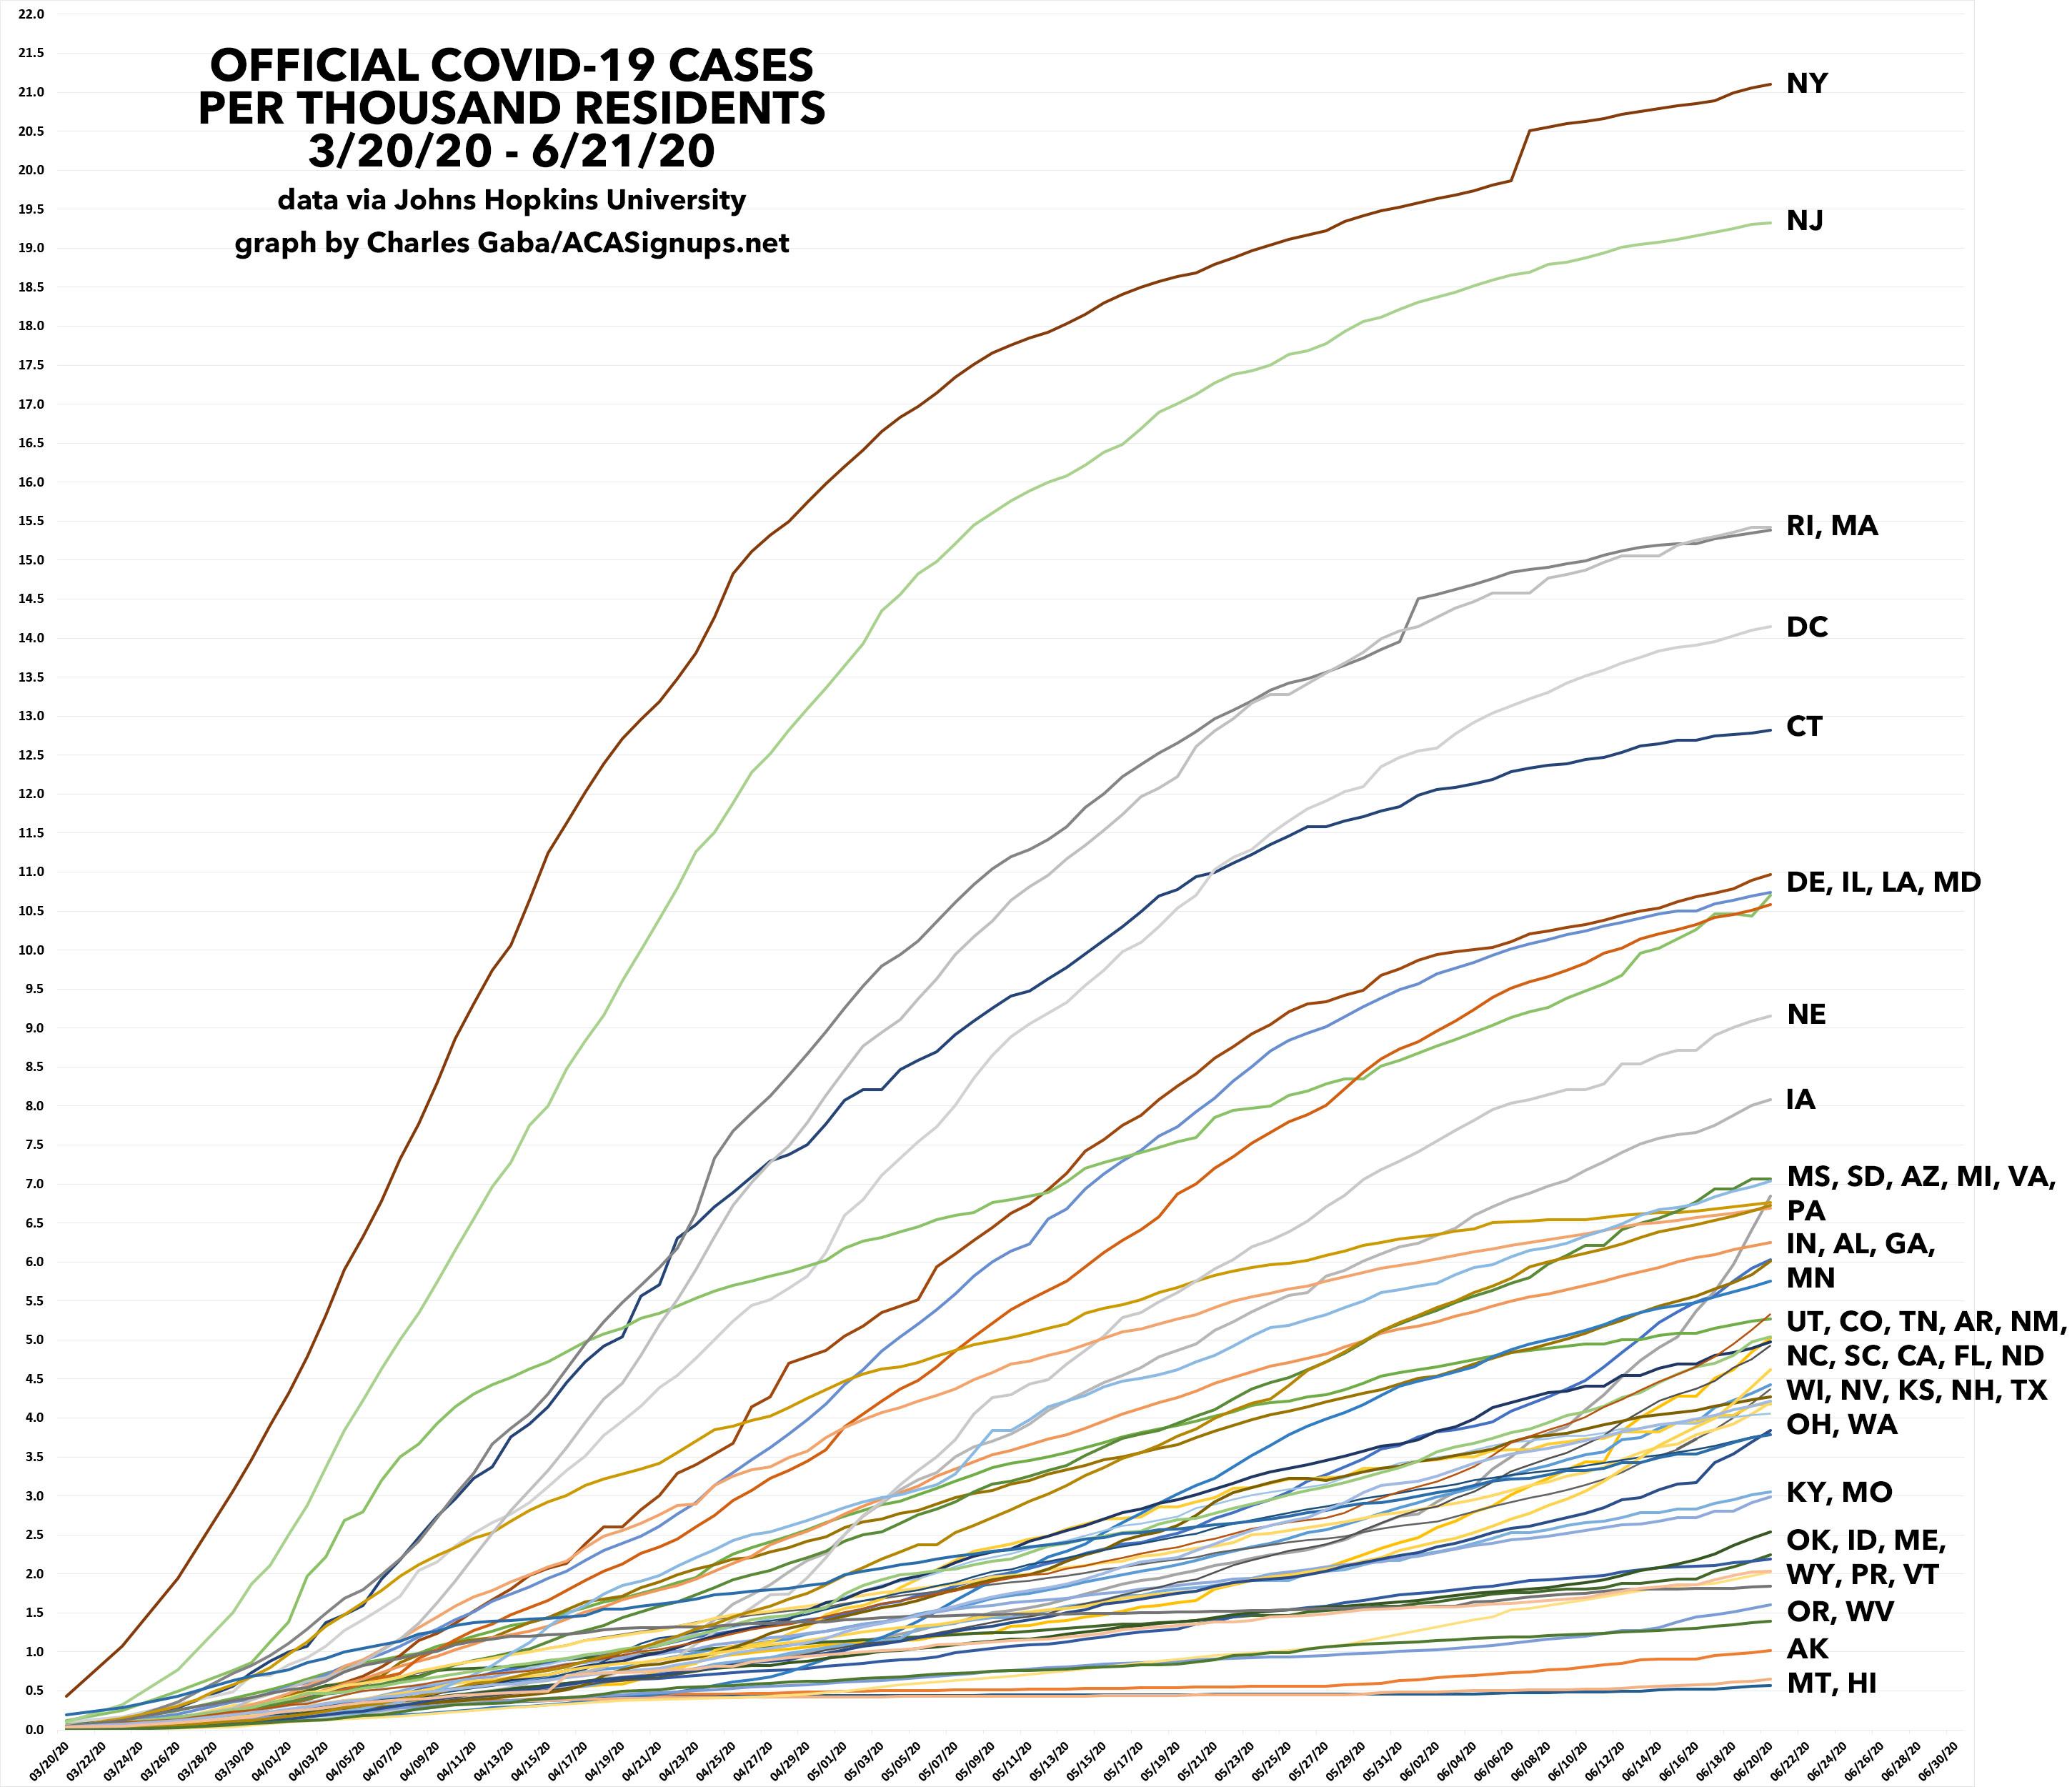
Happy Father's Day. Here's my weekly update of the spread of COVID-19 across all 50 states, DC & PR over time, from March 20th through June 21st, 2020, in official cases per thousand residents.
I've given up trying to tie every trend line to the state name; it simply gets too crowded near the bottom even with a small font size, so I've grouped some of them together where necessary.
Note that this graph doesn't take into account any of the rumored undercounts in Florida, Georgia etc...these are based on the official reports from the various state health departments. If and when those are ever modified retroactively I'll update the data accordingly.
Click the image itself for a high-resolution version.
Note: The sudden jumps in New York and Massachusetts reflect reporting methodology changes; MA started including probable COVID-19 cases, while New York added a batch of 15,000 positive antibody tests results they hadn't been previously including. Michigan's probable cases have been retroactively added into each daily total.
Advertisement
