

HERE WE GO AGAIN: How many could lose coverage in YOUR Congressional District?
Fri, 12/08/2017 - 12:00pm
Last winter and spring, you may recall that I crunched a ton of data to come up with my best estimates about just how many people were projected to lose their healthcare coverage at the Congressional District level in the event various versions of Affordable Care Act repeal/replacement bills were to be signed into law (the AHCA, BCRAP, ORRA and so forth). After the first couple of attempts, the folks over at the Center for American Progress took over much of the heavy lifting on my part.
CAP started breaking the numbers out, leaving me to separate them out into easily-sharable state-level infographics (I also added partisan info for each member of Congress, since every Democrat has been steadfastly opposed to each one of these bills, while just about every Republican has supported most of them so far).
I was able to stop doing this exercise in the mid-Summer after the GOP mostly gave up at a full frontal assault on the ACA...but of course thanks to the new Tax Reform Bill, partial ACA repeal is back, baby! This time they're (officially) "only" going after the Individual Mandate, not the whole thing, but that would be devastating enough on its own.
Anyway, Emily Gee over at CAP has done it again:
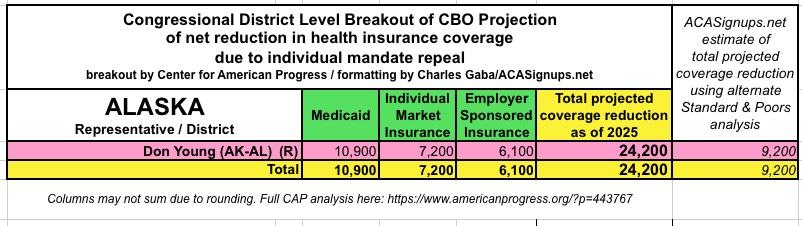
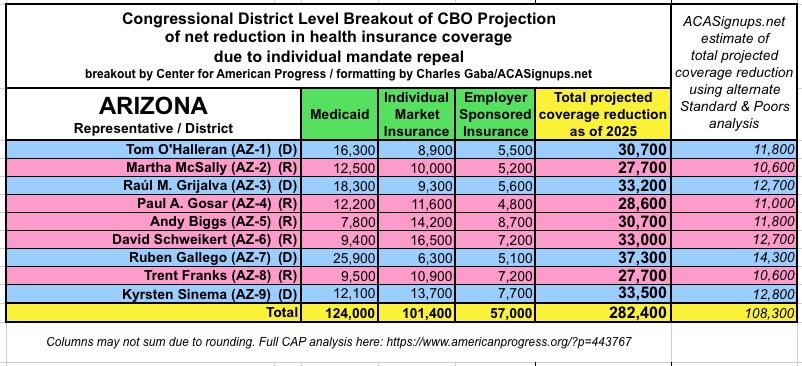
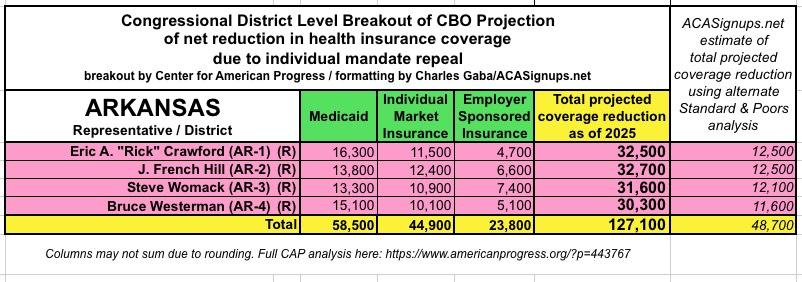
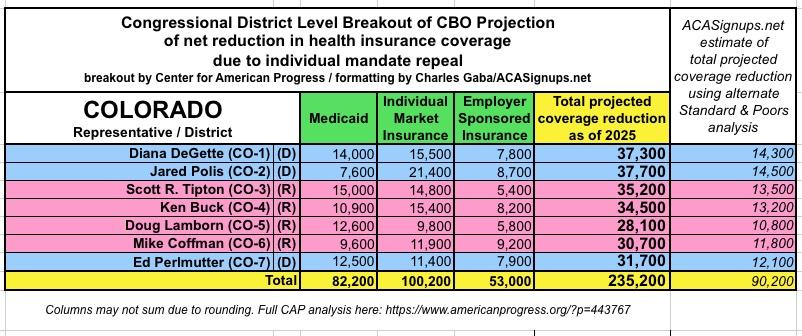
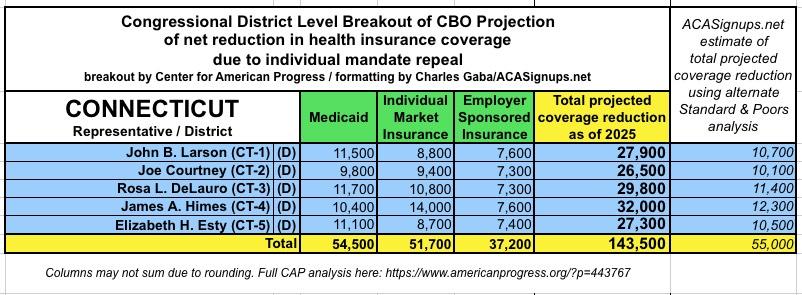
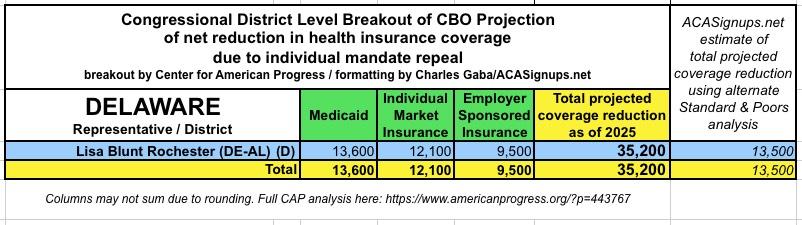
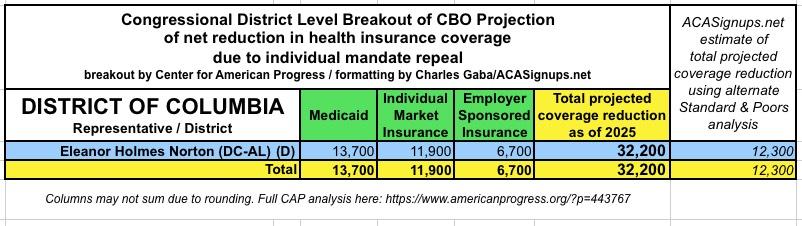
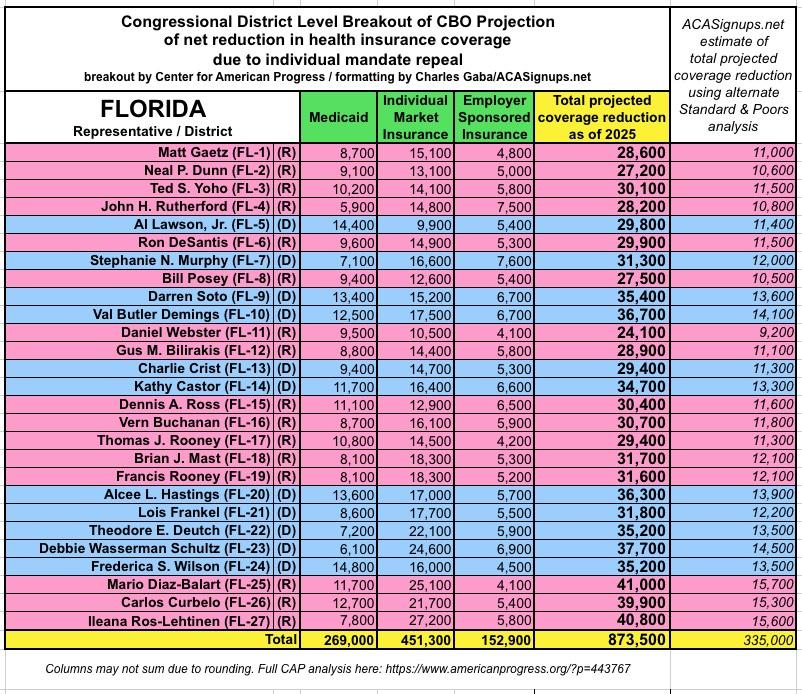
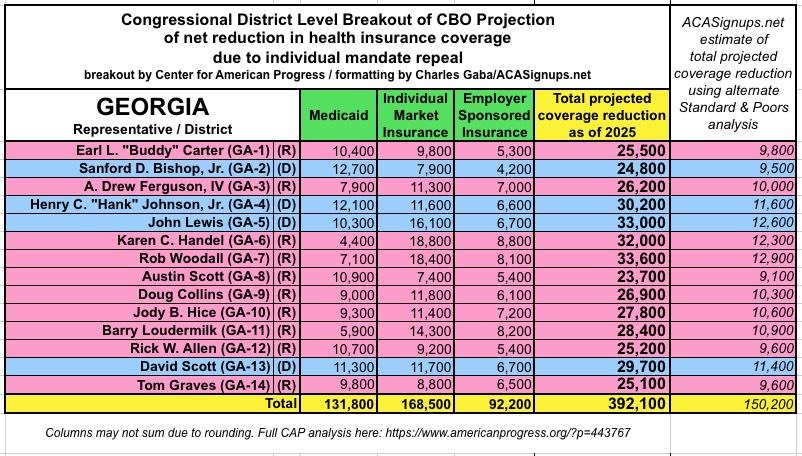
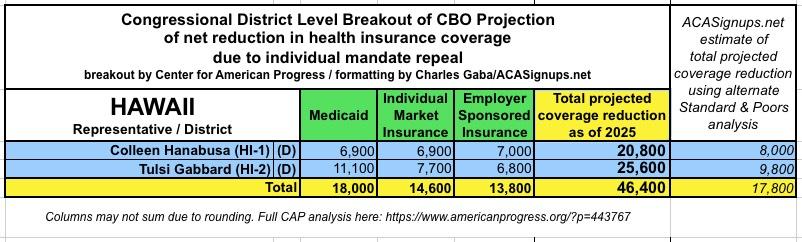
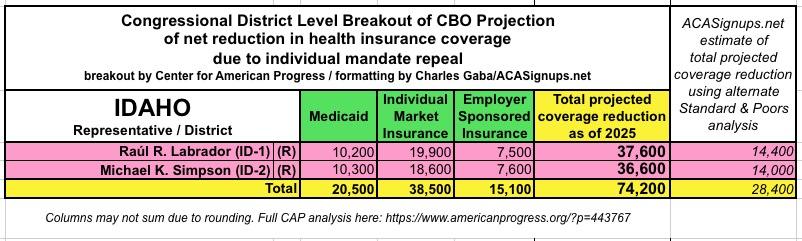
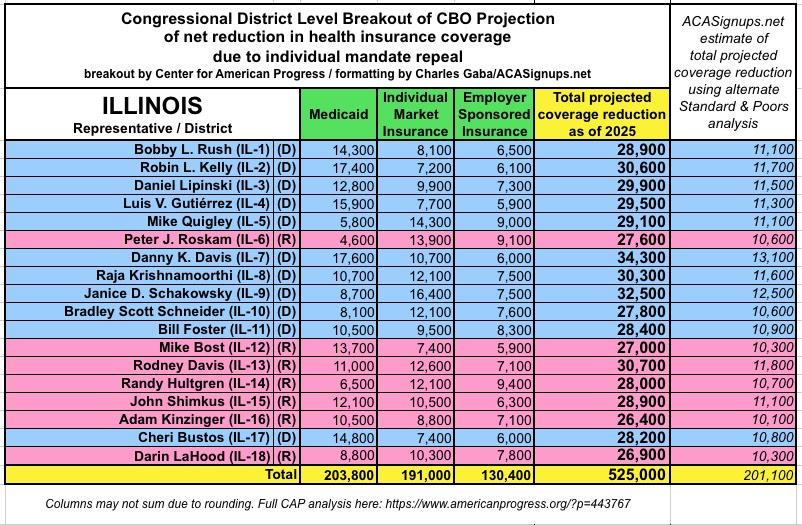
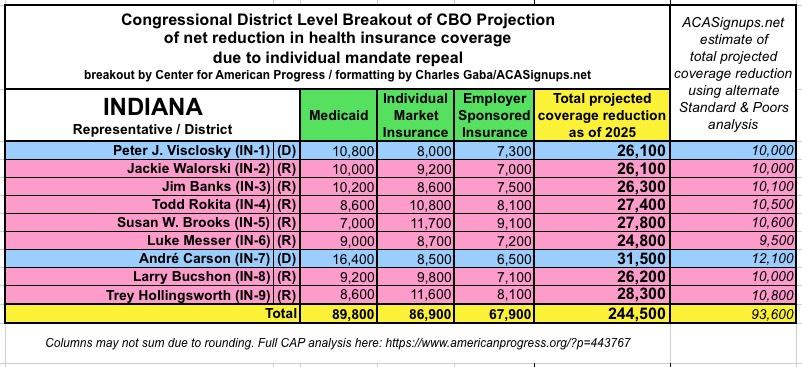
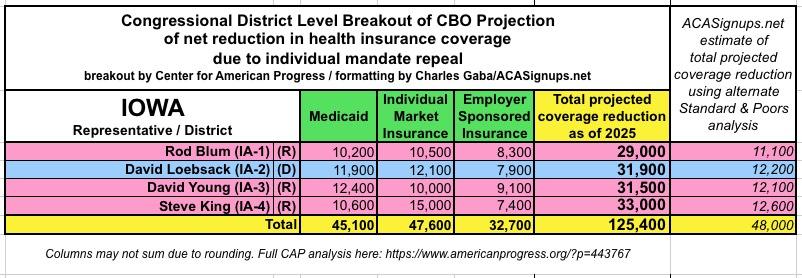
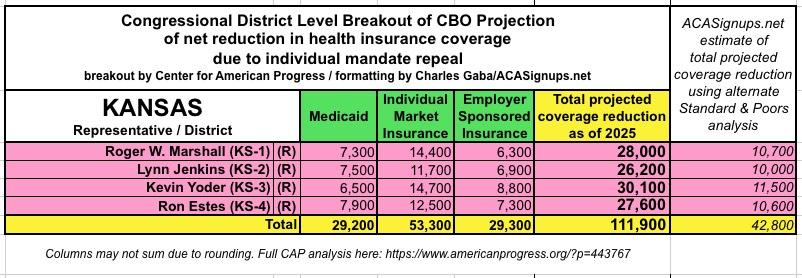
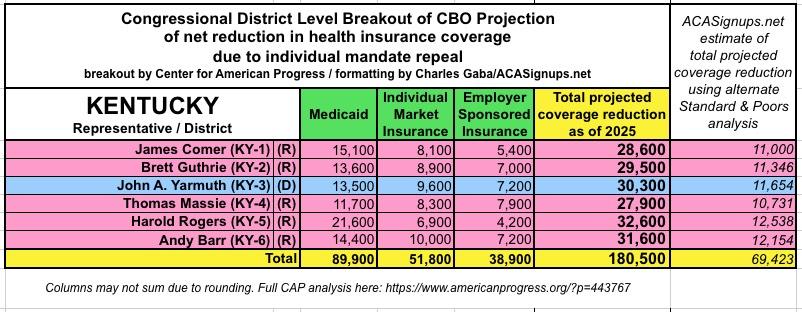
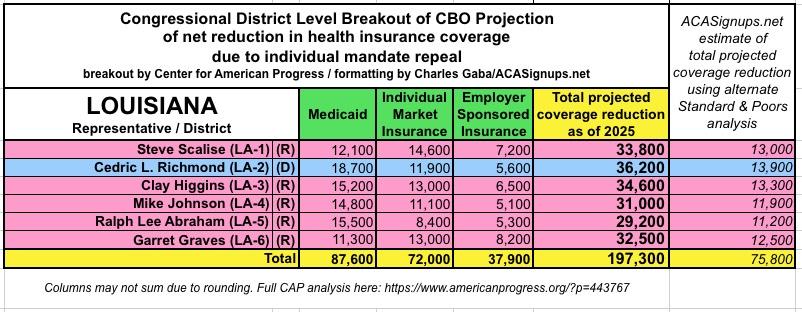
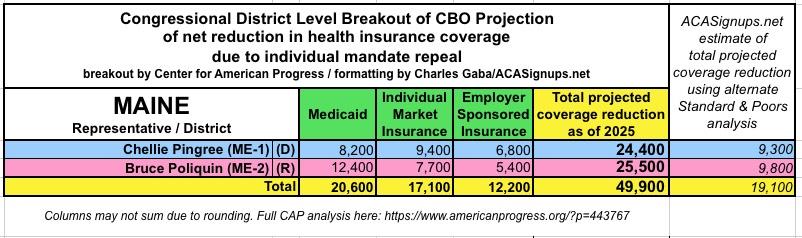
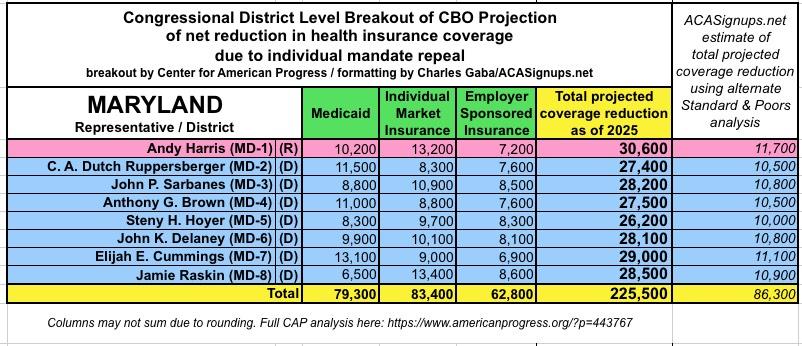
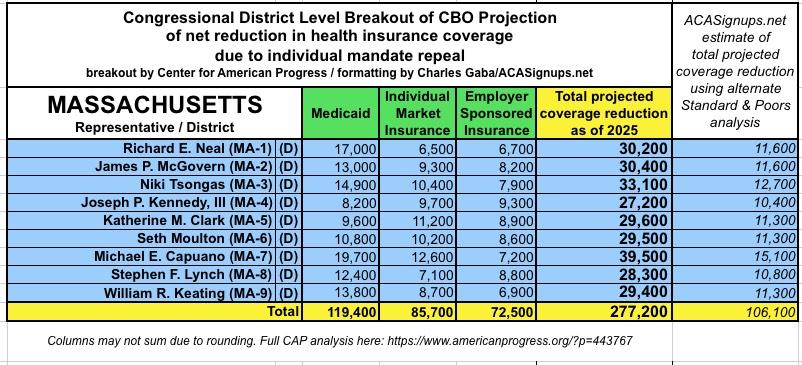
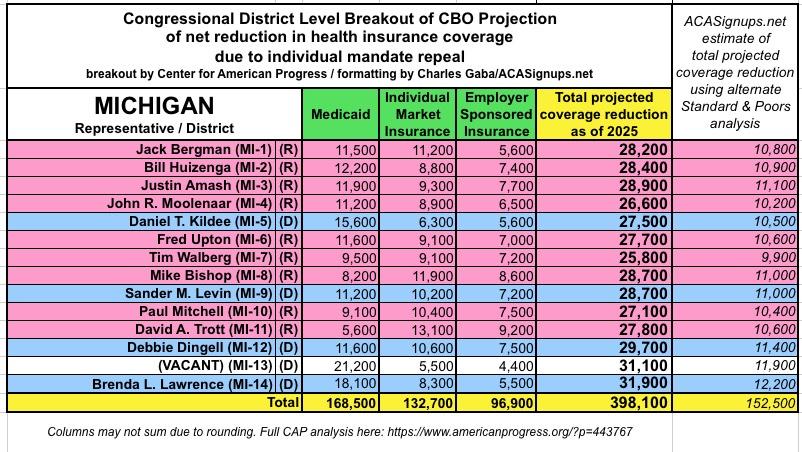
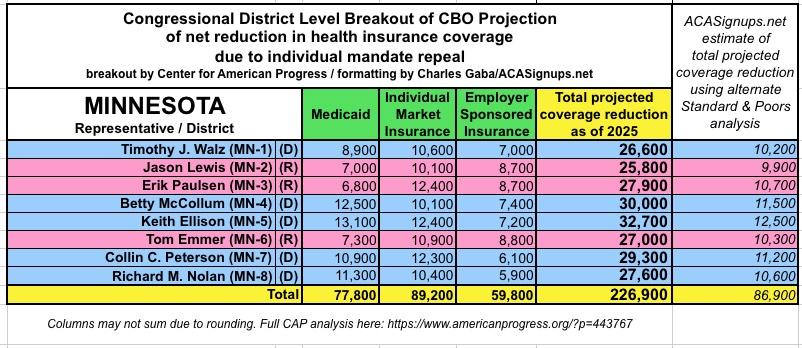
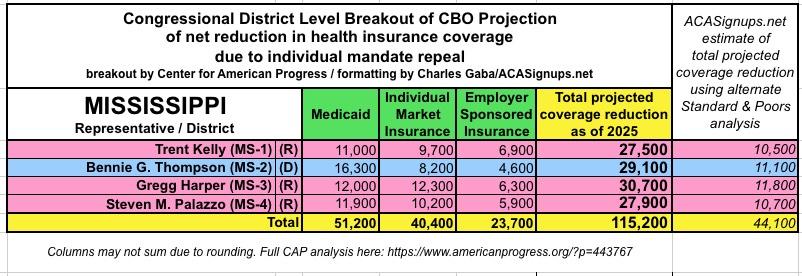
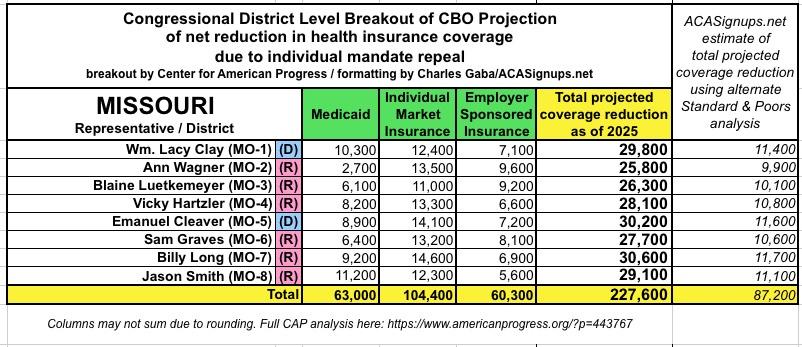
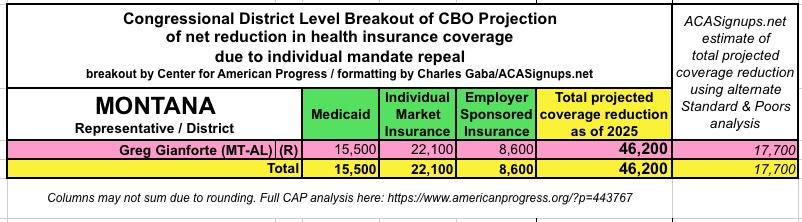
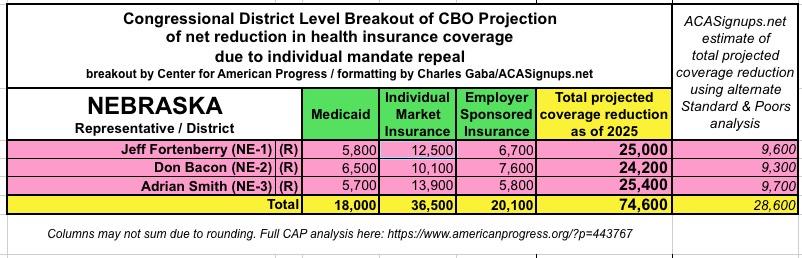
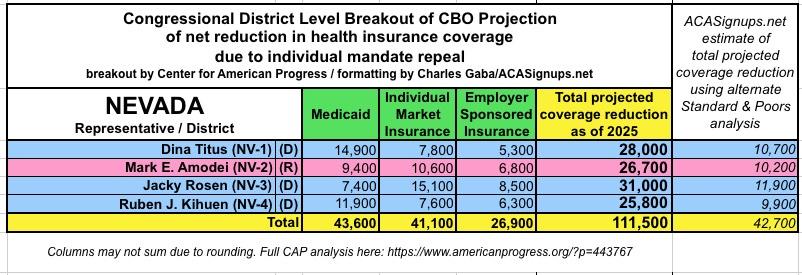
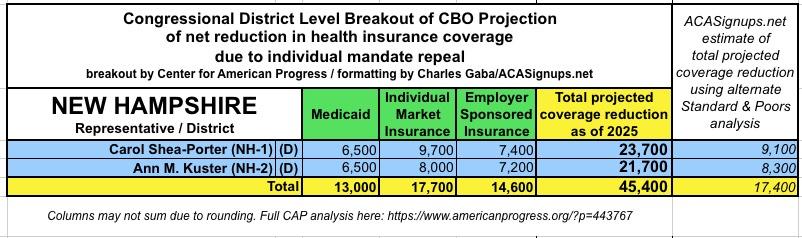
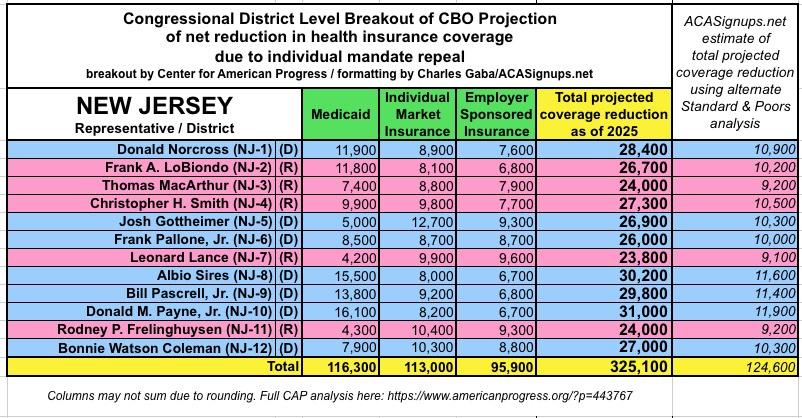
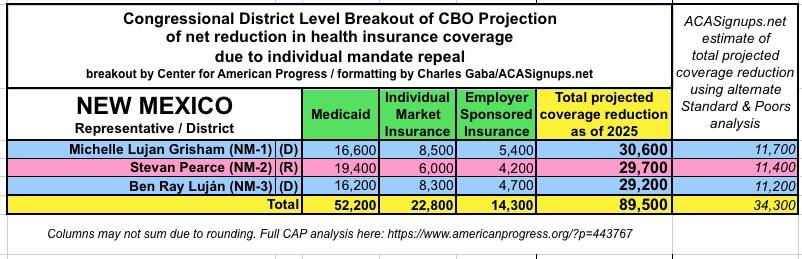
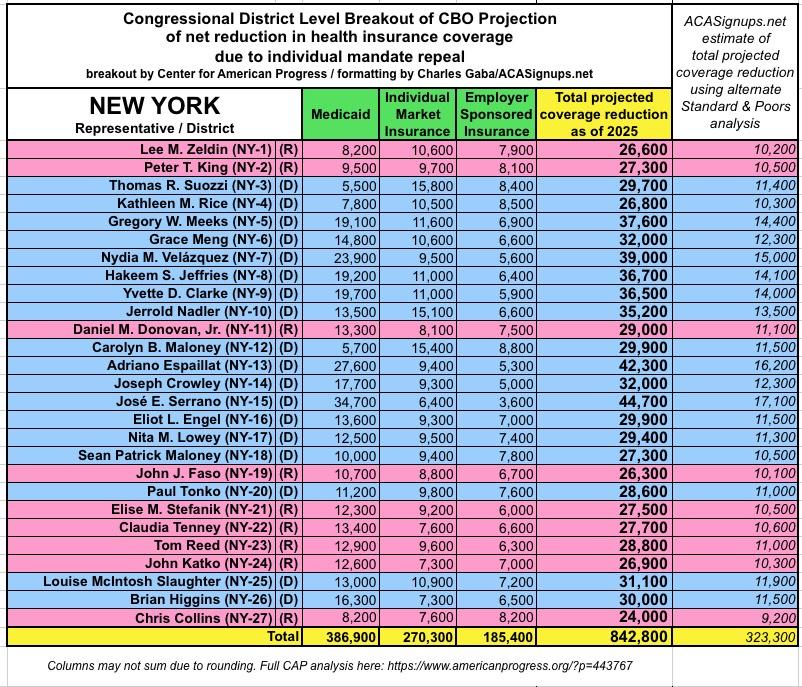
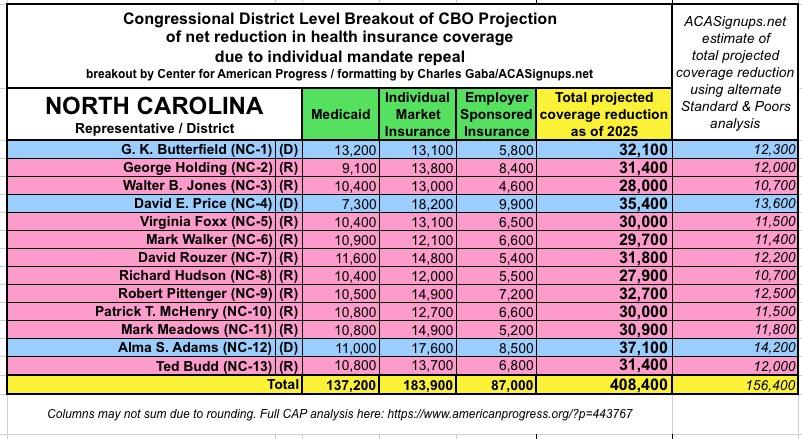
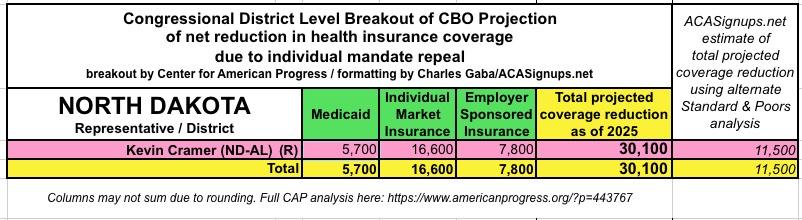
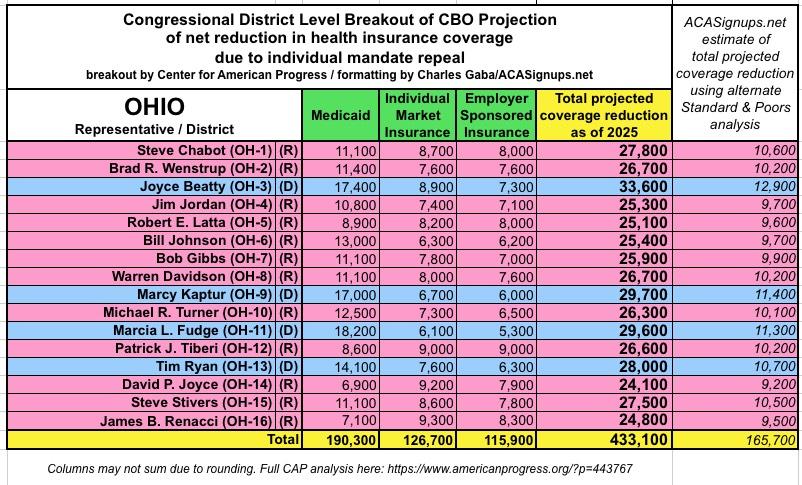
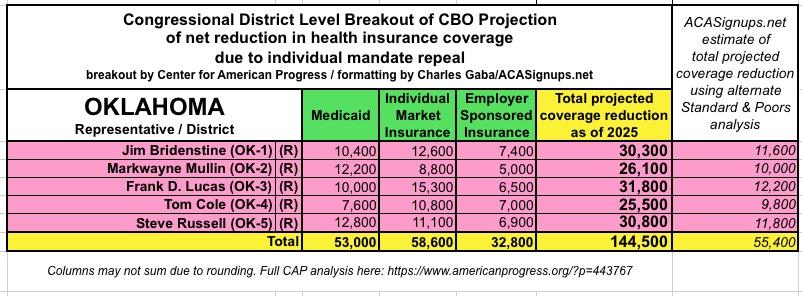
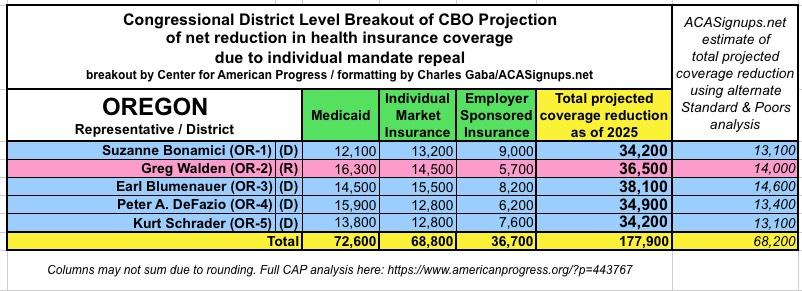
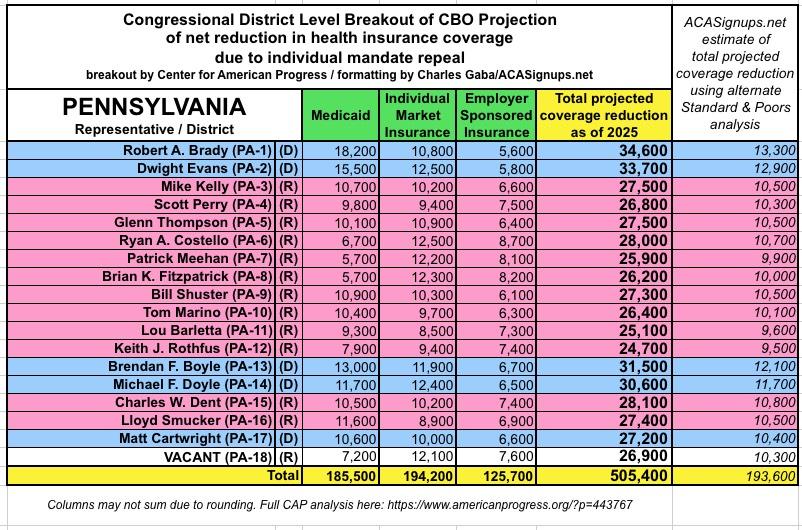
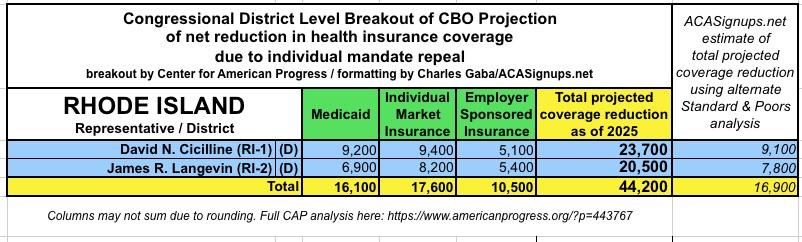
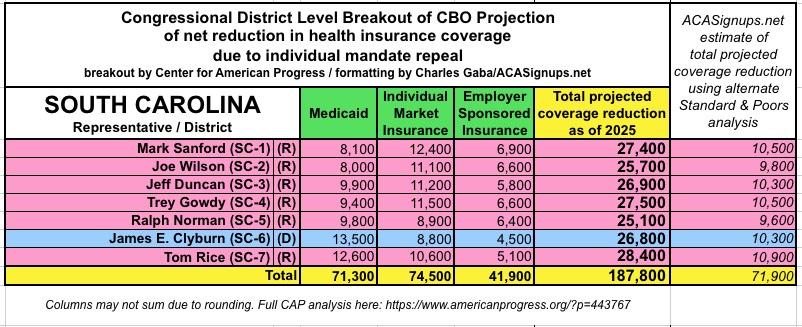
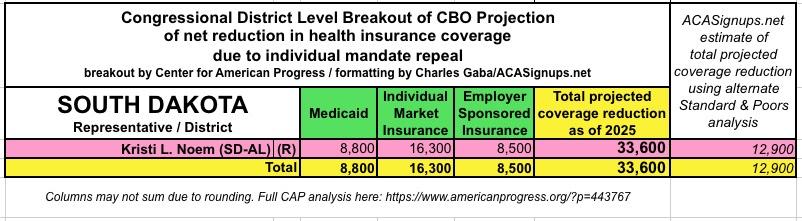
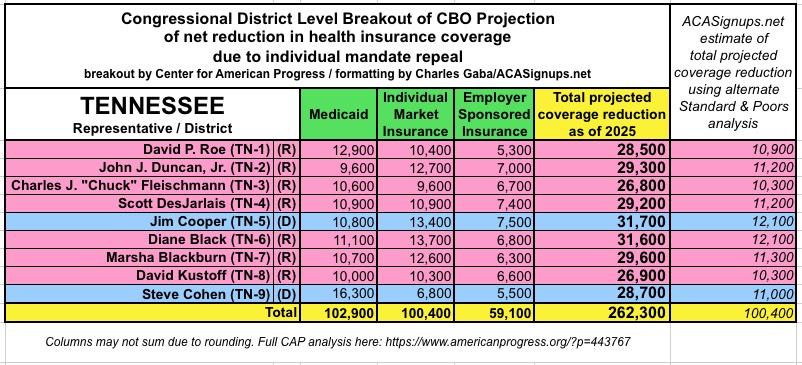
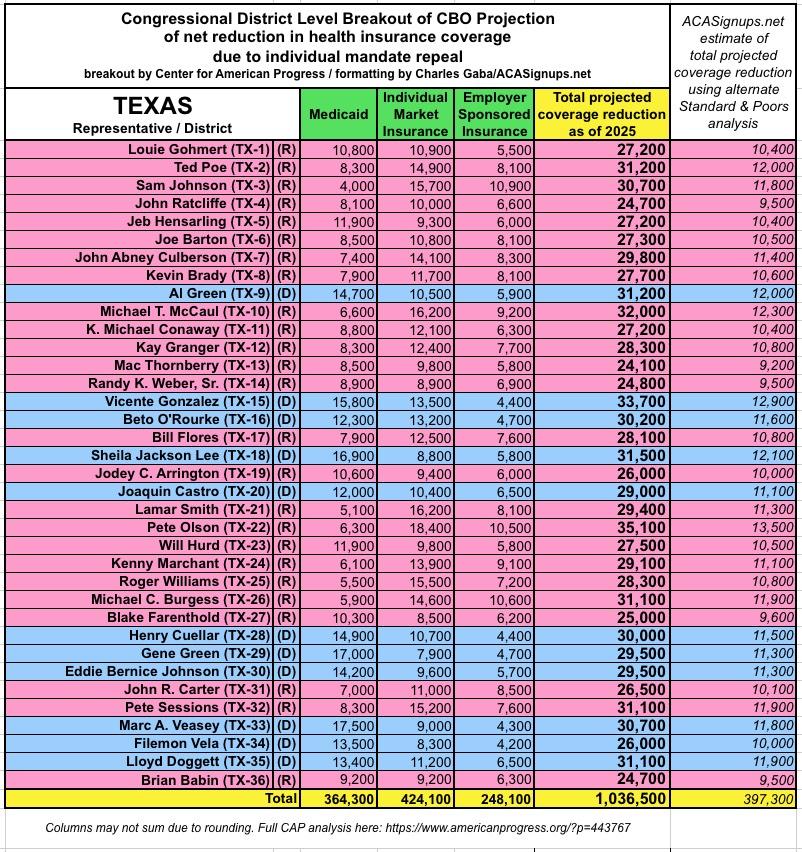
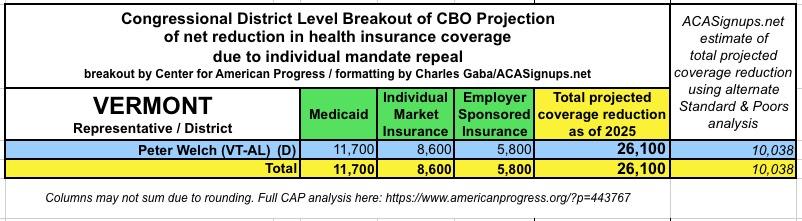
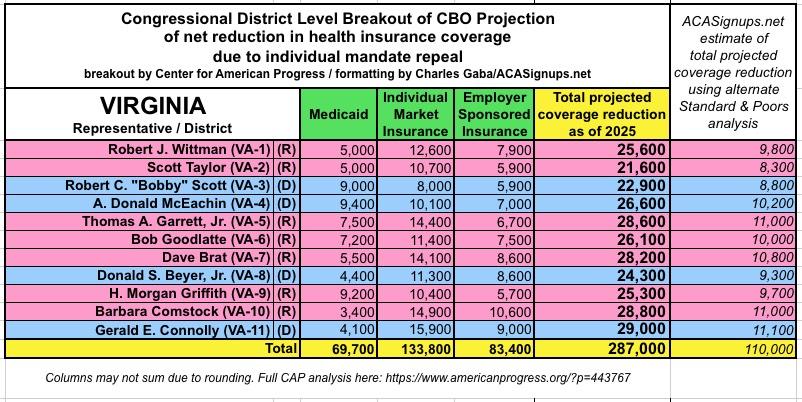
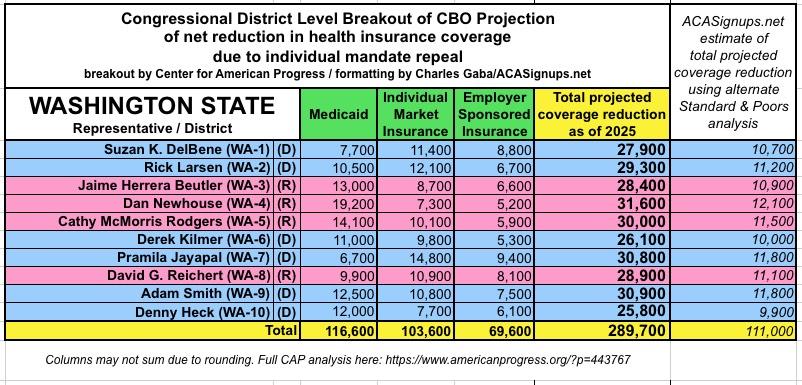
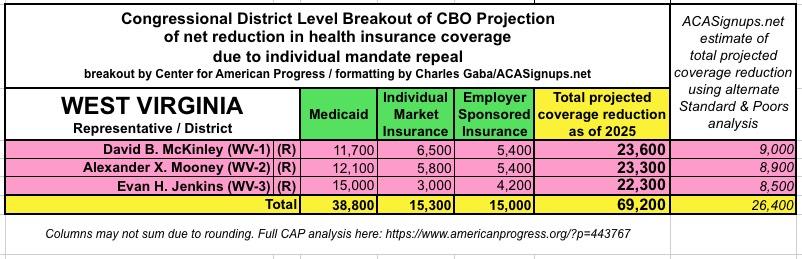
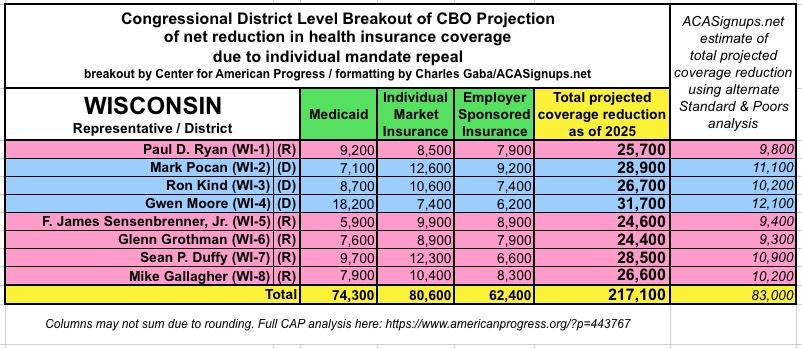
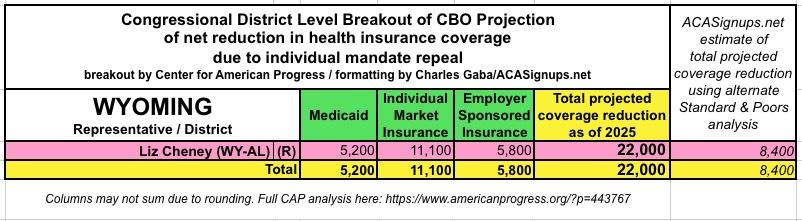
Our estimated reduction in coverage in 2025 due to repeal of the mandate is based on national projections by the CBO. The CBO estimates that 13 million fewer people will have coverage in 2025, including 5 million fewer people with Medicaid; 5 million fewer people with individual market coverage; and 3 million fewer people with employer-sponsored insurance. We used data from the 2016 American Community Survey Public Use Microdata Sample (ACS PUMS), available from the IPUMS-USA to tabulate the number of nonelderly people in each state by primary coverage type using a coverage hierarchy. We assumed that each state’s reduction in coverage would be proportional to its share of the CBO’s national total for each of those three coverage types. For more on the IPUMS-USA data set, see Steven Ruggles and others, “Integrated Public Use Microdata Series: Version 5.0” (Minneapolis: Minnesota Population Center, 2010).
...For our congressional district estimates, we split each state’s reduction according to each district’s share of the state total for each coverage type based on data tables from the 2016 American Community Survey.
For the purposes of this analysis, we assumed that no health coverage mandate would be in effect in all states, although, in reality, individual states may choose to enforce or adopt their own mandates.
Once again, they provided a single, massive spreadsheet with all 435 Congressional Districts...and once again, I'm reformatting/enhancing their data and breaking it out into individual state infographics suitable for sharing on social media.
One more thing, however: In addition to the Congressional Budget Office projections, I've also included my own CD-level breakout of the lower coverage loss projections estimated by Standard & Poors. Unlike the CBO's 13 million projection, S&P estimates that only around 5 million people at most would lose coverage over the next several years if the ACA's individual mandate were to be repealed (without other significant changes to the law).
I've included the S&P estimates because I personally suspect that the true number of people losing coverage would be somewhere in between the two outlooks. However, It'd still be a ton of people regardless of which one you think is a more accurate estimate.
With all that said, let's get cracking...


Advertisement
