

Pop Quiz: Has New Hampshire's ACA exchange enrollment gone up or down since January?
Fri, 08/12/2016 - 2:13pm
According to the official HHS Dept. ASPE Report, 55,183 New Hampshire residents "selected a Qualified Health Plan" from the ACA exchange during the 2016 Open Enrollment Period.
Of course, as I (and others on both sides of the political spectrum) have written about many, many times, not everyone who selects a QHP (either on or off the exchanges) actually pays their first premium, and therefore is never actually enrolled in an active, effectuated policy. This amounted to roughly 12-13% of all QHP selections in 2014, but got a bit better over the next two years as people got used to how the system works and technical improvements were made. In addition, another chunk of QHP selections were scrapped by the HHS Dept. or state exchanges at later points thorughout 2014 for a variety of reasons ranging from legal residency issues to other data matching problems. Again, this percentage has been gradually whittled down as improvements to the system have been made.
Last year around 87.2% of those who enrolled by 2/22/15 were still effectuated by the end of March, just 5 weeks later (10,187,197 effectuated on 3/31 out of 11,688,074).
This year, the percentage improved slightly: 11,081,330 effectuated on 3/31 out of 12,681,874, or 87.4%. While this may seem like only a 0.2 point improvement, remember that Open Enrollment also ended 3 weeks earlier this year, so instead of a 12.8% drop in 5 weeks, it's a 12.6% drop in 8 weeks. Not a huge point, but it's still worth noting.
However, that's nationally. On a state-by-state basis, the situation can be quite different, which brings me back to New Hampshire.
NH is one of the few states (and the only state on the federal exchange) which issues regular reports about the exact number of people enrolled in exchange-based policies each month. They even break this number out by metal level and carrier, which is very nice for tracking trends.
According to the latest report, here's how exchange-based QHP enrollment has played out for the first 7 months of 2016:
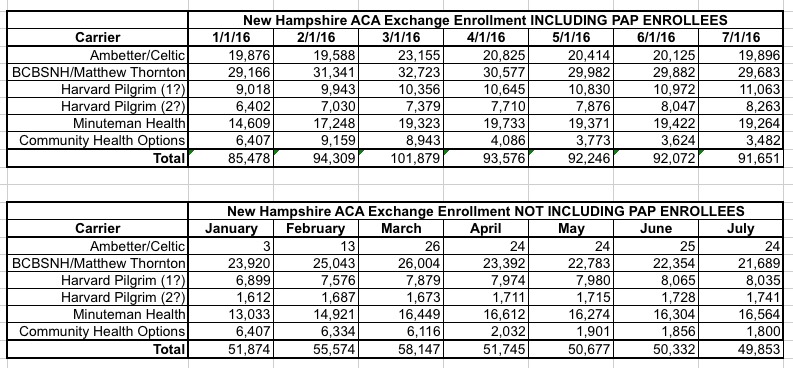
There are three important things to note above: First, "PAP" (or "Premium Assistance Program") is New Hampshire's name for their Arkansas-style "Private Medicaid Option" in which those who qualify for Medicaid expansion are, instead, enrolled in the same QHPs as other exchange enrollees...except that Medicaid funds are used to pay for virtually everything. Think of these as high-metal level QHPs with 99% APTC/CSR subsidies. They're officially categorized as being under Medicaid by CMS/ASPE, so they aren't included as QHPs in the official reports; if they were, New Hampshire would show up as having enrolled a good 30,000 more people in "exchange policies" (Arkansas' number would be much higher as well).
However, for purposes of the individual market risk pool, PAP enrollees ARE included. I've confirmed this with the NH Dept. of Insurance to be sure. Therefore, I've included the data in two tables and graphs, one including PAP and one not.
Secondly, Harvard Pilgrim is listed twice because, as the NH DOI noted, "Harvard offers two products with two different networks on the Exchange, thus the double entries for them."
Finally, there was a silly data glitch made by Community Health Options for the first 3 months of the year: They were inadvertently including off-exchange enrollees with their exchange-based numbers. As a result, CHO's numbers for January - March are perhaps twice as high as they should be; this was corrected starting in April (thus the huge seeming drop-off), but no one bothered going back to correct the earlier months.
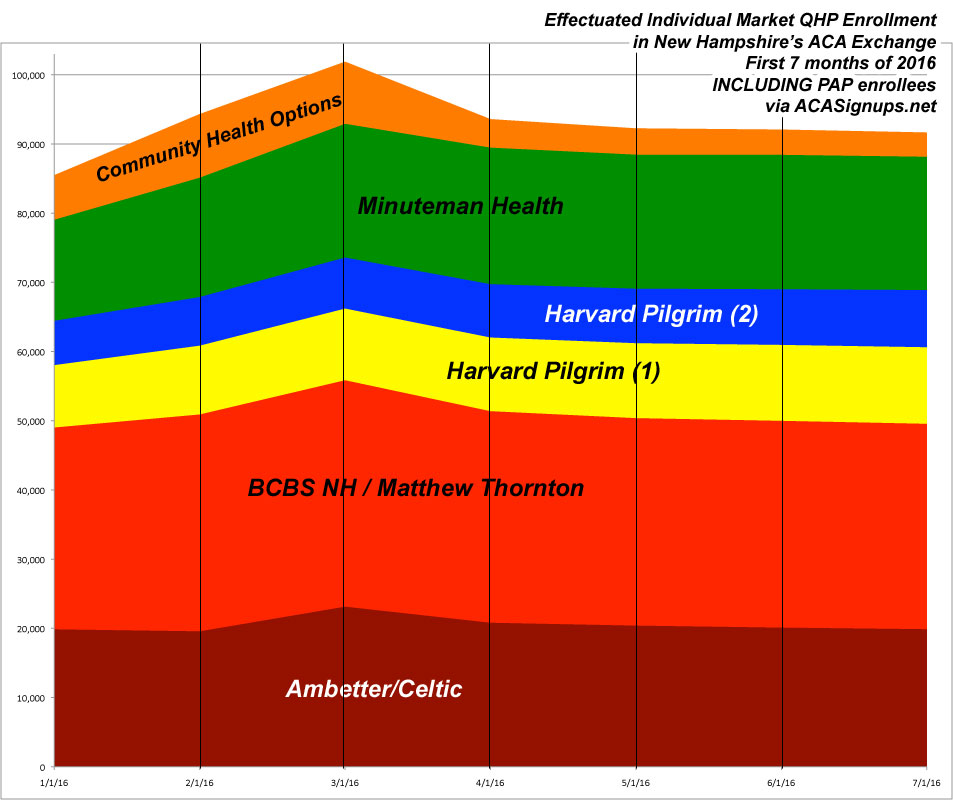
AS you can see from the graphs below, effectuated enrollments for all carriers nonetheless ramped up in February and March as the remaining Open Enrollment folks started having their policies kick in. Remember, anyone who enrolled from 11/01/15 - 12/23/15 started their coverage in January...but anyone who enrolled from 12/24-15 - 1/15/16 didnt' start until February, and those enrolling from 1/16/16 - 1/31/16 didn't start until March.
After that, things drop off dramatically in April...although again, a good half of this (around 4,000 out of the 8,300 total net loss) was really just a one-time correction of CHO's error. After that, however, it's a very mild drop-off all the way through July.
If you include PAP enrollment, July's number is over 7% higher than it was at the beginning of the year (91.7K vs. 85.5K). Of course, Medicaid expansion is year-round, so perhaps that's unfair.
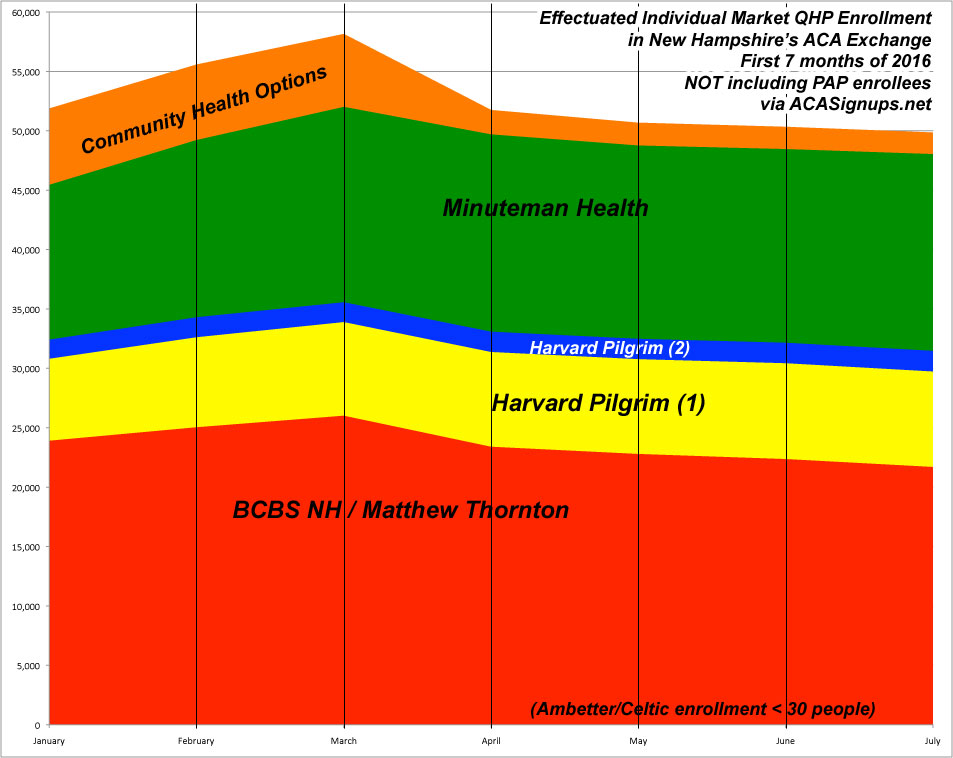
If you don't include PAP, however, the picture is still pretty good in NH: Only 3.9% lower than where things started (49.9K vs. 51.9K). In fact, if you knock around 3,000 off of CHO's January number (out of 6,407), the July number is actually 2% higher (49.8K vs. 48.9K).
Finally, even if you use the "QHP selection" number as your starting point, that's only a 9.7% net drop (49.9K vs. 55.2K)...and that's over a 6 month period.
In short, things are looking pretty stable in New Hampshire, which may explain why their carriers are only requesting a 13.1% average rate hike next year (yes, I said "only"...13.1% is pretty low this time around). It's worth noting, however, that if the PAP enrollees weren't included in the risk pool, things would be a lot uglier...a 31.4% average request.
One other noteworthy item: Notice that the relative market share of each carrier seems to have remained pretty stable as the year has passed; none of them seem to be dropping or gaining mid-year relative to their competitors.
Advertisement
