

How many ACA enrollees have Gold or Better coverage in YOUR state?
Thu, 03/28/2024 - 10:08am
It's been about a week since the Centers for Medicare & Medicaid Services published the official 2024 ACA Open Enrollment Period Public Use Files, and I'm still digging through the mountain of data & demographics.
Today I want to address the question of Actuarial Value (AV)...that is, what percent of medical expenses (in aggregate) a given healthcare policy actually pays for. As a quick reminder, ACA policies are generally broken into four AV categories, labeled by metal levels: Bronze, Silver, Gold and Platinum, which generally cover roughly 60%, 70%, 80% or 90% of enrollees in-network medical expenses per year (there's a fifth category in front of Bronze called Catastrophic plans, but these have limited eligibility and hardly anyone enrolls in them anyway).
I say generally because there's a bit of wiggle room here:
...as of 2023, the de minimus range has been reduced, imposing the following actuarial value ranges for metal-level plans:
- Bronze: 58-62% (Expanded Bronze can be as high as 65%)
- Silver: 70-72%
- Gold: 78-82%
- Platinum: 88-92%
HOWEVER, as I've written about many, many times before, there's also Cost Sharing Reduction (CSR) assistance, which is only available to ACA exchange enrollees who earn between 100 - 250% FPL* and who select a Silver plan. "CSR Silver" plans can dramatically reduce deductibles, co-pays & coinsurance, and in doing so can significantly increase the AV of the plan beyond its official metal level label:
- If you earn between 100 - 150% FPL, CSR Silver raises your AV from 70% to 94%
- If you earn between 150 - 200% FPL, CSR Silver raises your AV from 70% to 87%
- If you earn between 200 - 250% FPL, CSR Silver raises your AV from 70% to 73%
*Members of federally recognized American Indian tribes & Alaska Natives are also eligible for CSR assistance.
The last of these is fairly nominal--it may only reduce your deductible by a few hundred dollars or so. But the first two categories (94 & 87 AV) are very generous and they transform your "Silver" plan into what I call a Secret Platinum plan...because that's exactly what it is: It's a high- or low-Platinum plan disguised as Silver!
I've also written extensively about "Silver Loading," which is a policy pricing strategy which many carriers use which results in Gold plans costing the same or less than Silver plans in many counties, as well as Premium Alignment, which includes Silver Loading but which is a more cohesive & actuarially sound pricing methodology which, again, results in Bronze and Gold plans costing far less than they otherwise would have.
Unfortunately, Silver Loading is only used in a scattershot fashion--fully embraced by some carriers, partly used by others, and ignored by others yet--while Premium Alignment is only official policy in a handful of states so far (though this number is growing).
With this in mind, I decided to figure out just what percent of ACA enrollees in each state have "Gold or Better" coverage. This includes enrollees with actual Gold or Platinum plans along with those in high-CSR Silver plans (ie, not including the nominal 73% AV population).
Let's take a look!
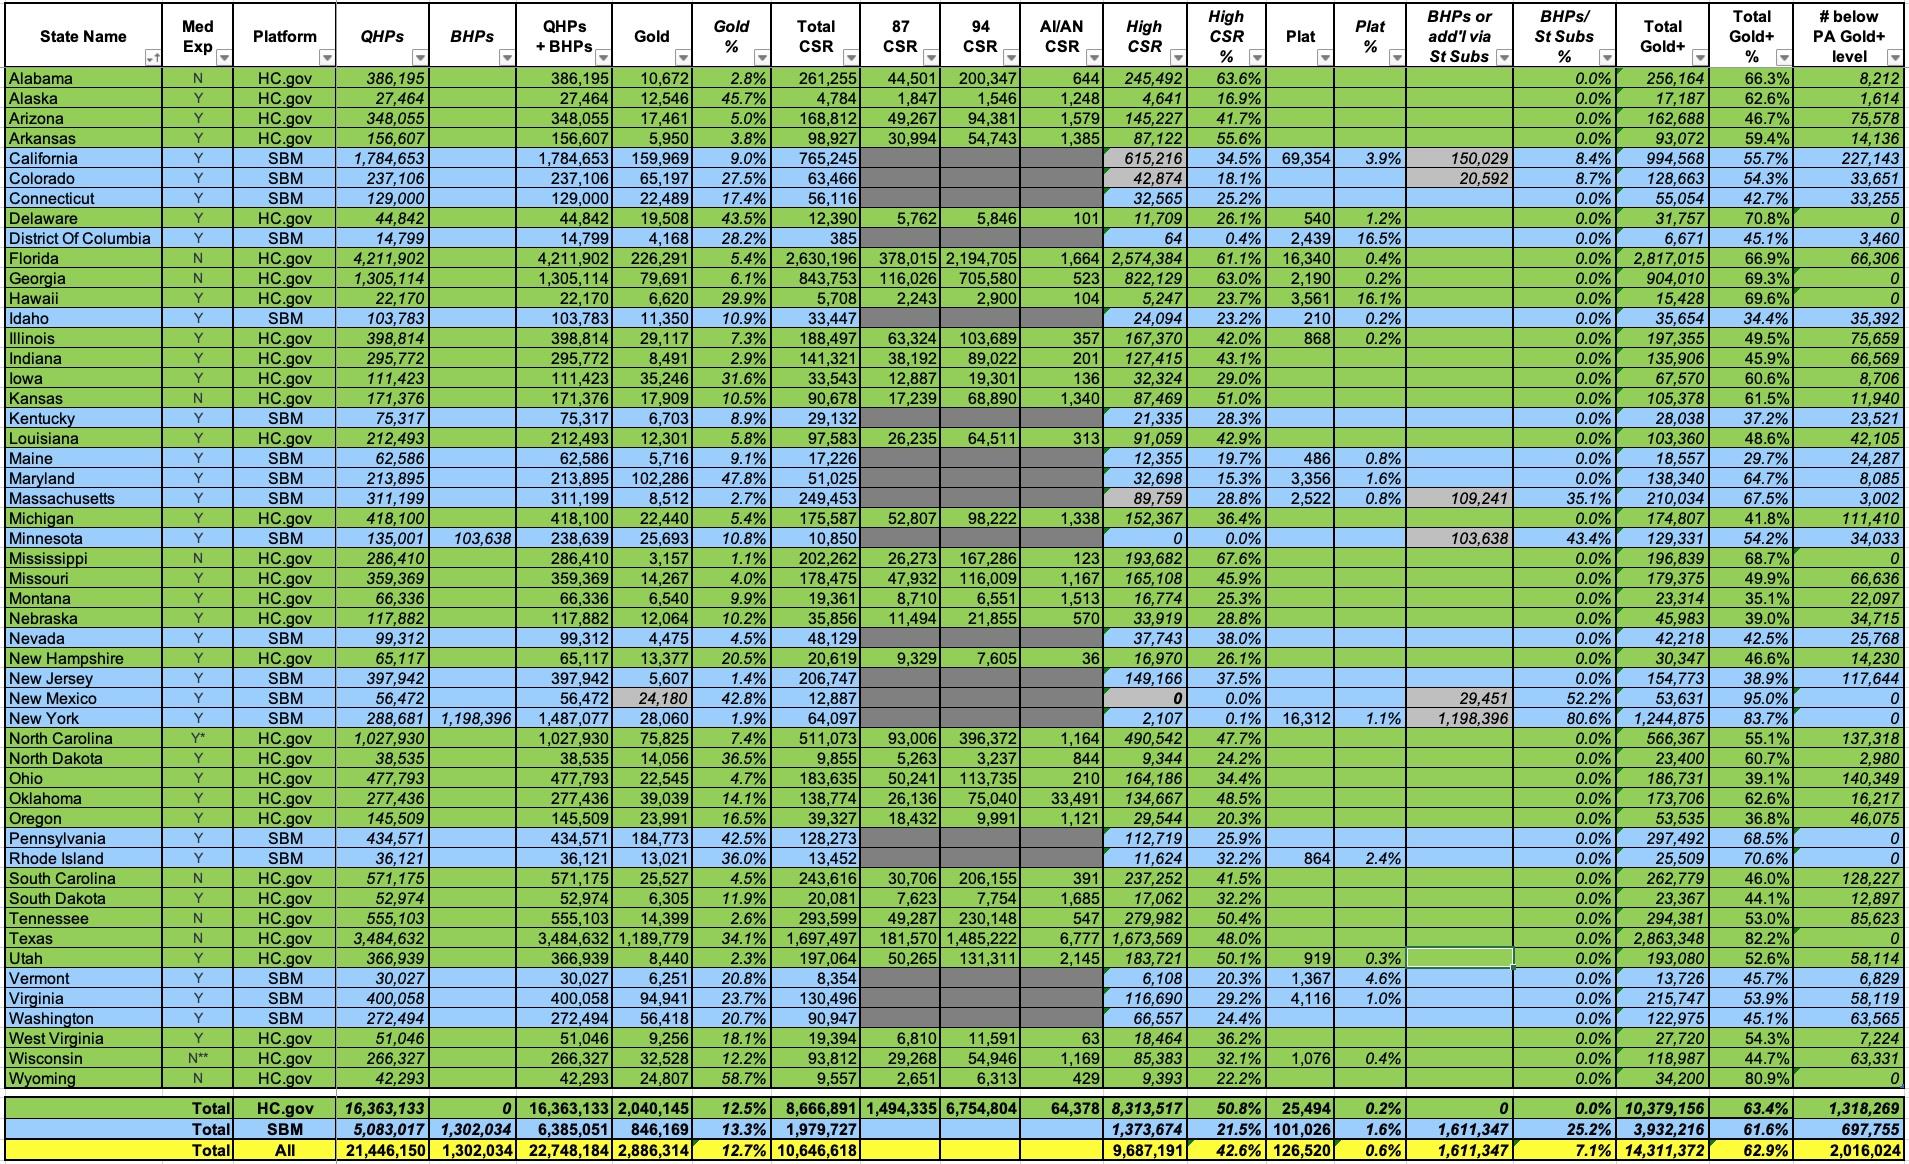
First, here's the official metal level data. As you can see, just 59,000 people selected Catastrophic plans (0.3%). 31.2% selected Bronze, 54.4% Silver, 13.5% Gold and just 0.6% Platinum (which aren't even officially available in most states):
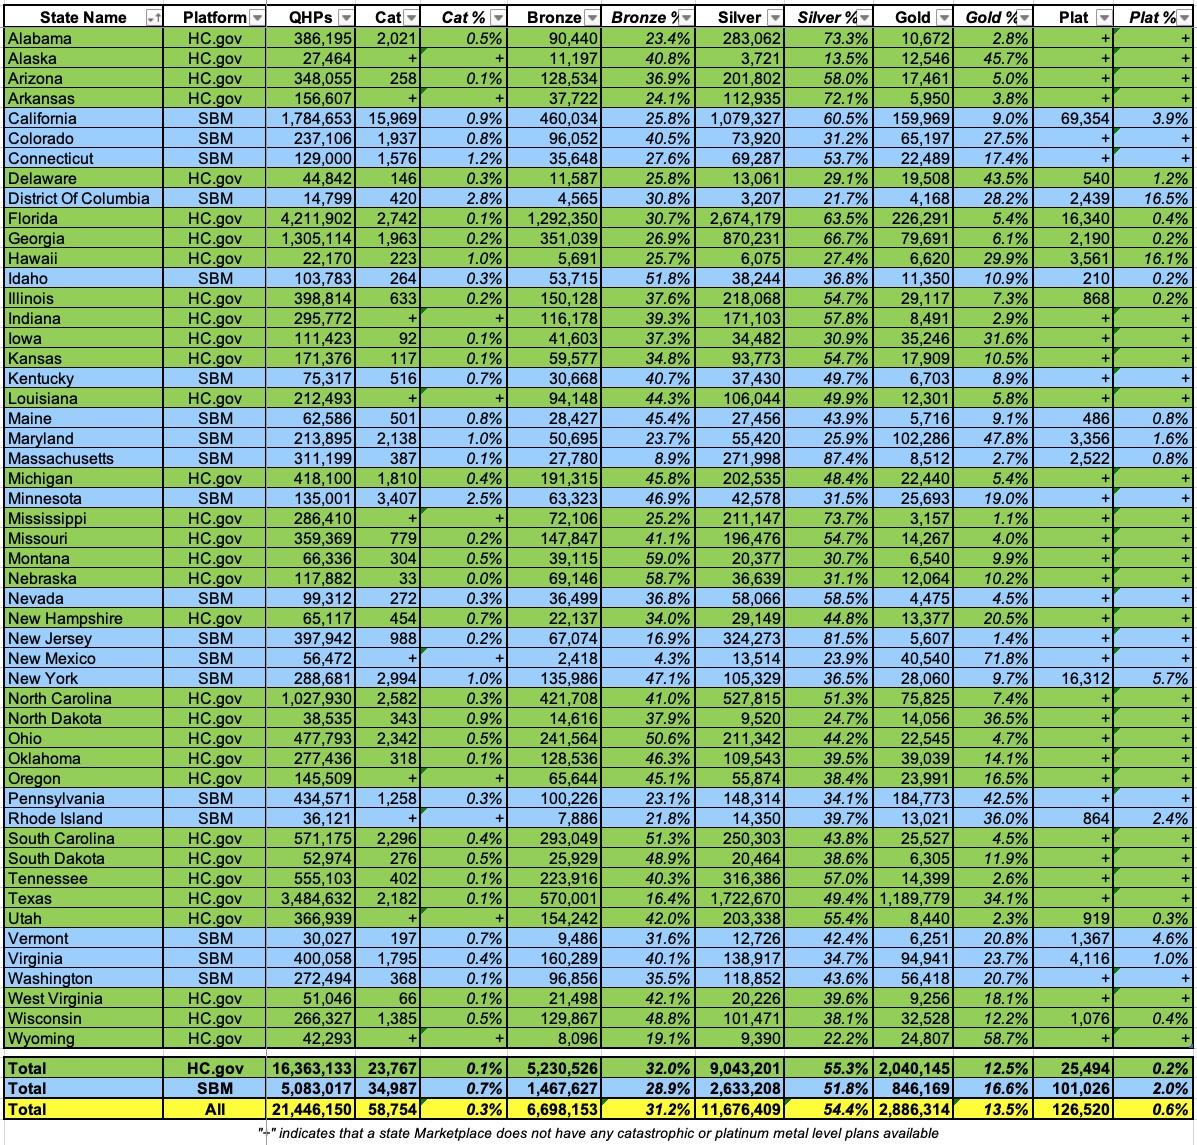
If you went purely by the metal level labels, you'd assume that just 14.1% of all ACA enrollees have Gold or Better coverage (just over 3 million enrollees).
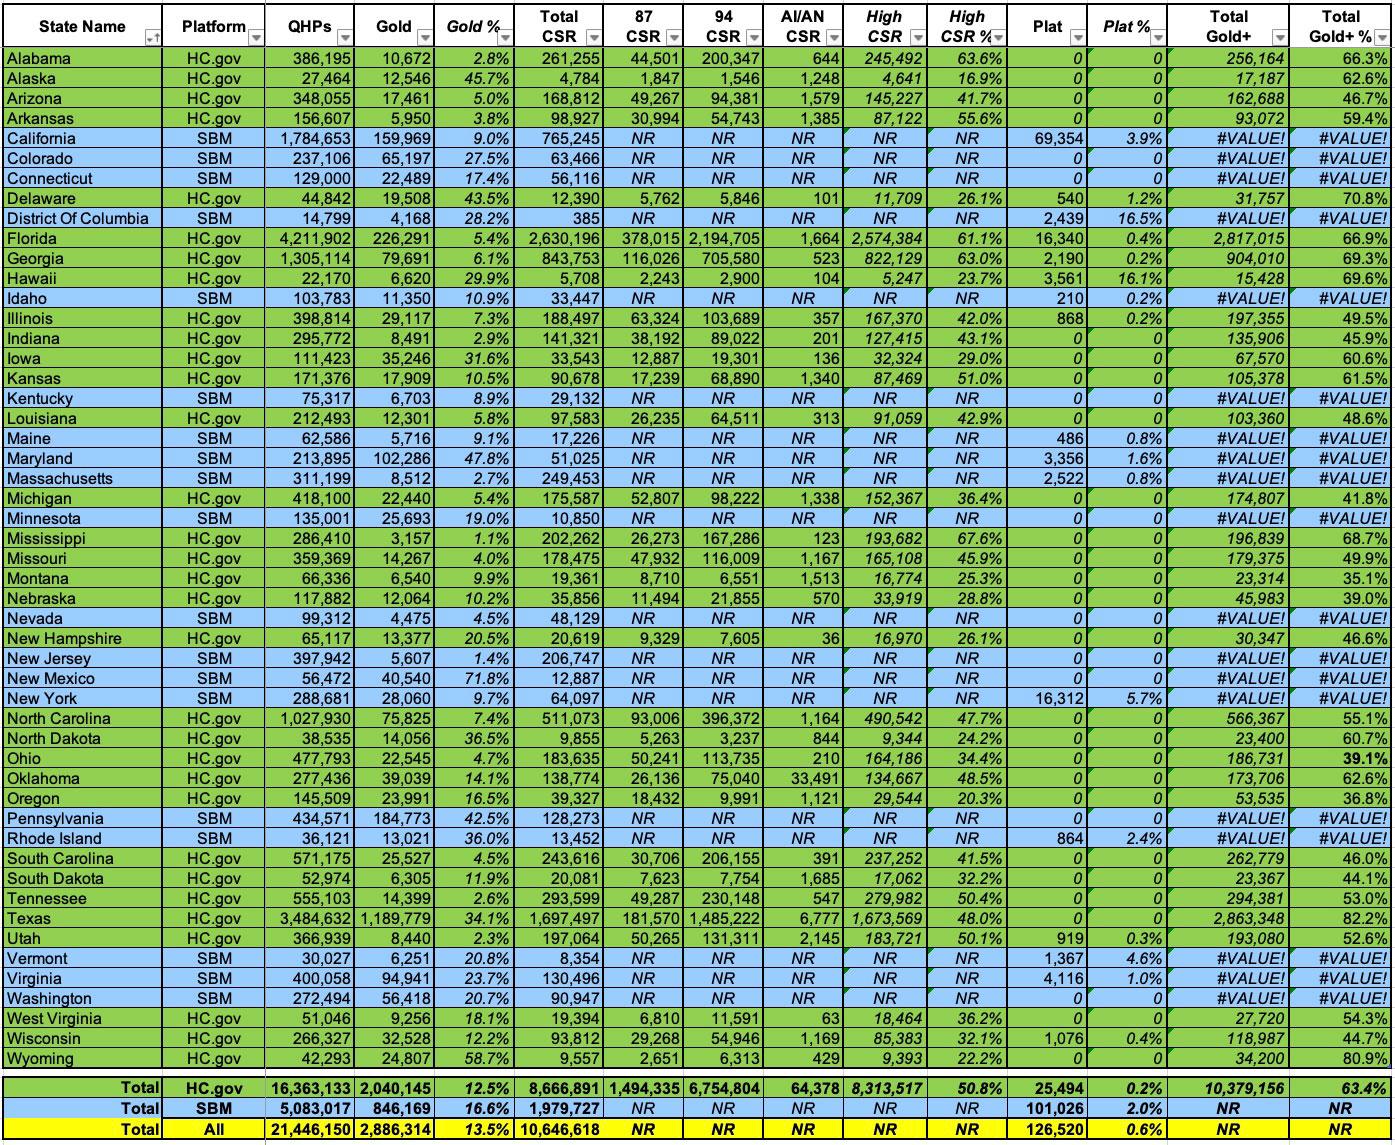
What happens when we throw High CSR into the mix, however (while also eliminating Catastrophic, Bronze and Non-CSR Silver enrollees, since those are irrelevant here)?
Well, CMS provides total CSR enrollment for every state...but they only break it out by AV level for the 32 states on the federal exchange (HC.gov). This means we're missing data for 18 states +DC:
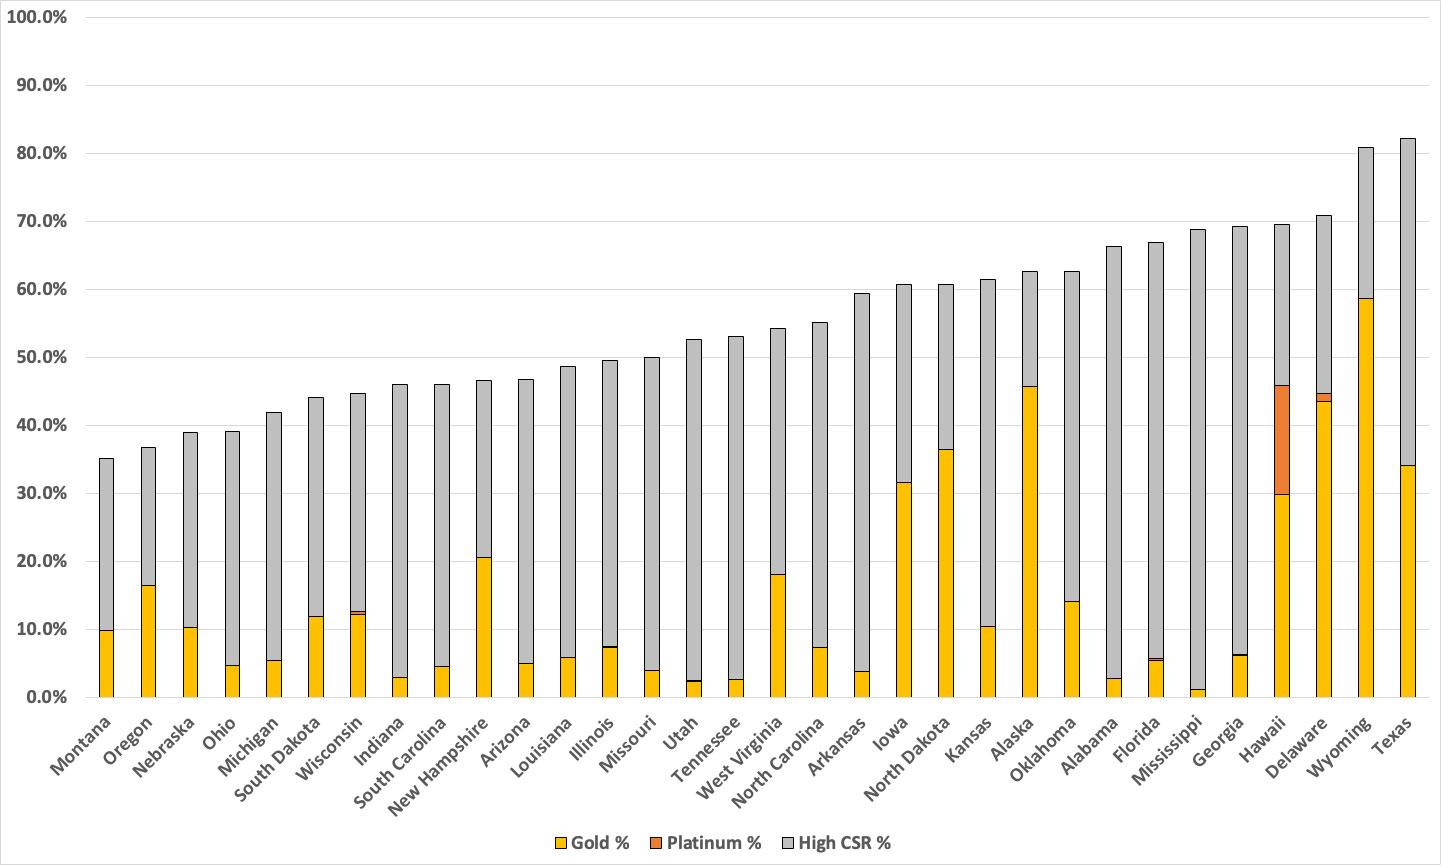
If we only look at the 32 federal exchange states, here's what it looks like from lowest to highest...it ranges from just 32% in Montana to a whopping 82% in Texas (again, much of this is thanks to Texas passing a strong Premium Alignment bill a few years ago). Wyoming is another state with strong Silver Loading rules in place. Hawaii is noteworthy in that it's the only FFM state with significant Platinum enrollment:
So far, so good...but we're still missing all 19 state-based exchange states! Fortunately, as Stan Dorn reminded me this morning, there's an easy way to at least estimate how many high CSR enrollees the remaining states have: One of the other Public Use Files (PUFs) provided by CMS breaks out the household income brackets of every state (including the missing ones) by metal level selected. It rounds these off to the nearest percent, which isn't completely accurate, but it should be very close.
For instance, in Connecticut, exactly 129,000 people selected plans this year. Of those, 69,287 (53.7%) selected Silver plans. And of those, according to the PUF, 47% earn between 100 - 200% FPL. That's roughly 32,565 Connecticut enrollees who should have 94 or 87% AV CSR plans.
Around 4% of CT enrollees have an unknown income, but you aren't eligible for CSR (or APTC) without that anyway. It's also conceivable that a small number of Silver enrollees in that income range don't have 94/87 CSR plans for some weird reason or another, but this should be pretty close.
Using this data, I can fill in the remaining states like so:
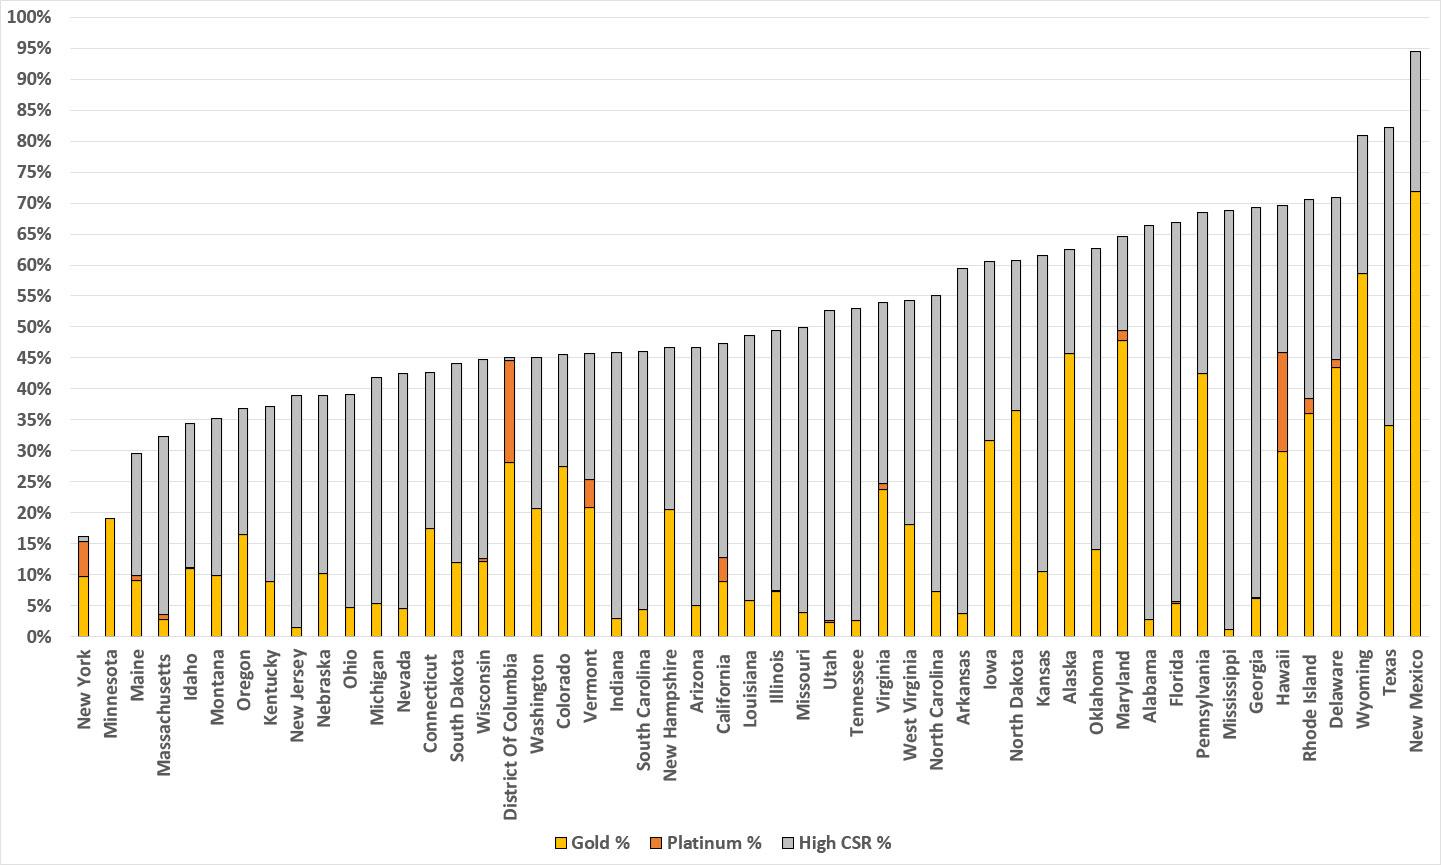
With all 50 states +DC included, Texas drops one notch while New Mexico takes the top spot by a lot...and as it happens, New Mexico is the other state which most recently implemented strong Premium Alignment legislation. In NM's case, however, they took it one step further by also enacting robust state-based supplemental subsidies to ACA enrollees, which is the other reason they're at the top of the chart (more on this below).
After New Mexico, the next state-based exchange is Rhode Island; after that it's Pennsylvania in 9th place...which happens to be another state which has had robust Silver Loading and Premium Alignment in place for years.
Meanwhile, the District of Columbia joins Hawaii in having a significant percent of Platinum enrollees (while also having a tiny number of high-CSR enrollees). Both of these are likely explained by the fact that Medicaid is available to all DC residents earning up to 210% FPL (vs. 138% for all adults in actual states).
This siphons off a huge number of potential CSR enrollees, which also means a lot fewer Silver enrollees in general...which means Platinum enrollees will have a disproportionate chunk of the remaining market. If I knew how many DC Medicaid enrollees earn between 138 - 210% FPL I could adjust for it here, but I don't.
Minnesota and New York show up at the very bottom of the graph above for a simple reason which is similar to DC's: Both of them have implemented Basic Health Plan programs which provide healthcare coverage for enrollees earning between 138 - 200% FPL.
Similar to DC's expanded Medicaid population, these MN/NY residents would (for the most part) otherwise be enrolled in heavily-subsidized ACA exchange plans...in most cases, High CSR Silver.
Fortunately, unlike DC's 210% FPL Medicaid data, CMS provides exact numbers for BHP enrollment in MN/NY. If I add them to the mix, both states move dramatically up the list...in fact, New York moves all the way up to second place! Of course, you can argue that BHP "shouldn't count;" once you start down this path you have to ask whether Medicaid and/or CHIP enrollees should be included as well, etc.
Next, let's look at Massachusetts. At first glance nothing might seem to be amiss--it ranks in the bottom third of the pack, but not too terribly. What's going on there? ConnectorCare.
Last week I noted that Massachusetts somehow jumped from only having 58% of their QHP enrollees enrolled in CSR plans (still pretty high) to a stunning 80% in a single year...even though, according to CMS's same data, only 54% of Massachusetts enrollees earn between 100 - 250% FPL! What's up with that?
Either there's a clerical error or the state made some sort of radical change to how they define income and/or CSR eligibility this year that I'm not aware of. They did expand their ConnectorCare program up from 300% FPL to 500% FPL this year, but the additional CSR assistance for that comes from state funding, not federal...I can't believe CMS would count that as federal CSR enrollment...
Well, apparently they do exactly that! I checked the 2023 Open Enrollment Period (OEP) PUF and found that only around 93,100 enrollees earning between 100 - 250% FPL chose Silver plans...but CMS also reported over 134,000 CSR enrollees. What accounts for the difference?
Until this year, ConnectorCare plans were available to MA enrollees who earn up to 300% FPL. When I add the 250 - 300% FPL bracket to the mix, it adds another ~30,400 or so, or ~123,600 (much closer to the 134K CSR figure).
How about this year? With the expansion to 500% FPL eligibility, you get over 231,000 Silver enrollees who earn between 100 - 500% FPL...which also happens to be over 74% of all QHP enrollees statewide. While this is still less than the 80% CSR total, it's a lot closer and is the only thing I can think of which accounts for the discrepancy.
This is academic anyway; the bottom line is that ConnectorCare coverage has an Actuarial Value ranging from 92 - 99% depending on your income level, so it absolutely should be reflected in the graph above. According to the MA Health Connector, there were 156,000 enrolled in ConnectorCare at the start of Open Enrollment, and another 43,000 were added to the program via the expansion to 500% FPL. This means ConnectorCare enrollment (which should also include/trump any CSR enrollment) should total around 199,000 people.
But wait, there's more! California, Colorado, Connecticut, Maryland, New Jersey, Vermont & Washington State also each have their own supplemental state-based subsidy programs on top of the federal subsidies!
In California, Colorado and New Mexico, a chunk of the subsidies applies specifically to cost sharing, and while some of it applies to premiums instead, that goes to enrollees who are in Gold-or-Better policies already. I've accounted for just about all of this in New Mexico already (they call their blended CSR/state subsidy plans "Turquoise"), but it also makes a huge difference in California and Colorado, where it bumps up ALL CSR enrollees to Platinum or higher levels (including those enrolled in 73% CSR plans).
Connecticut's state subsidies only apply to enrollees earning up to 175% FPL (who are already in better-than-gold plans to begin with), and New Jersey's subsidies apparently cut off once the enrollee hits 80% anyway. The subsidies in Maryland only apply to premiums for young enrollees, so I don't think this would pull more than a nominal number of them over the Gold line.
As for Vermont and Washington's supplemental subsidy programs, they mostly apply to premiums, not cost sharing, so while their Gold-or-Better numbers are likely slightly higher, I don't think it's more than a percent or two at most.
Here's what it looks like with all of this accounted for:
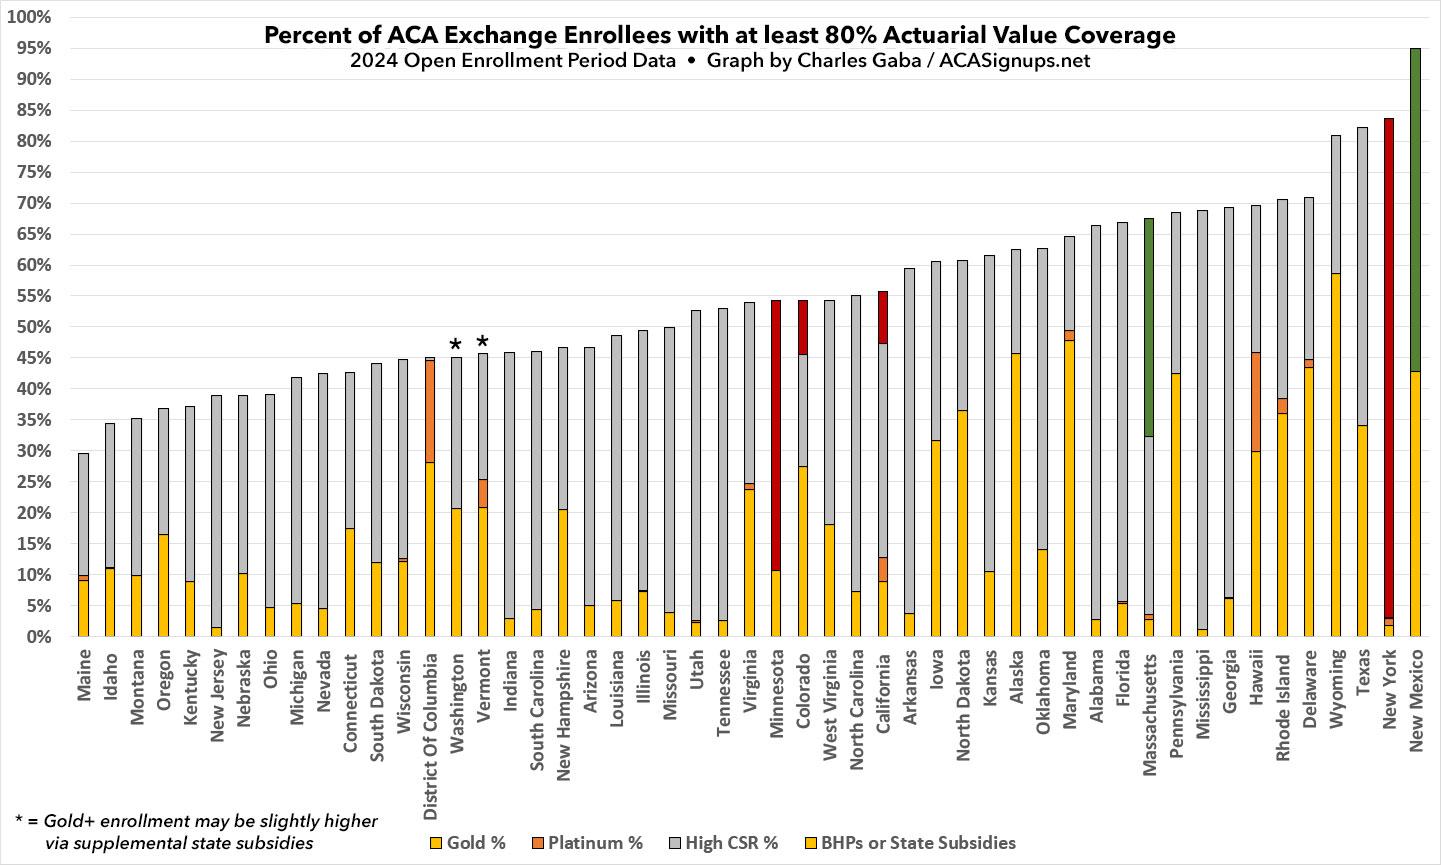
In the meantime, however, I see no reason why any of the states on the left side of the graph can't at least implement robust Premium Alignment policies (including maximized Silver Loading if they aren't already doing so) in order to move up to at least, say, between Colorado (55%) and Pennsylvania (68%) levels. Doing this wouldn't cost any of these states a dime, and would mean a dramatic coverage upgrade for between 500,000 - 2 million Americans.
Advertisement
