

Challenge Accepted: The Elephant in the Room, now Age-Adjusted
Wed, 02/02/2022 - 6:05pm
A couple of weeks ago I ran an updated analysis which attempted to estimate a grim but vitally important number: Just how many Trump voters vs. Biden voters have become fatal victims of the GOP/FOX News coordinated anti-vaxx/anti-mask campaign to date, and what sort of impact might this end up having on the midterm elections this November?
I'm not going to attempt to justify this cynical bean counting anymore...the evidence is now overwhelming that Republican leadership, in coordination with outlets like FOX News and other right-wing outlets, made a conscious decision in spring 2021 to push hard against Americans getting vaccinated against COVID-19.
Over 600,000 Americans have died of COVID-19 since the 2020 election, but assuming the death rate is similar among adults who voted and those who didn't, less than 2/3 of those actually voted in the 2020 general election. Besides children under 18 and undocumented immigrants, the sad reality is that there are tens of millions of American adults who are eligible to vote but either aren't registered or are registered but don't cast a ballot every election cycle.
Out of the ~375,000 actual 2020 voters who have likely died of COVID since 11/04/20, the simplest estimate of partisan breakout would be to simply use the percent of the national popular vote won by each candidate. Biden received 81,268,924 votes (51.3% of all Presidential votes cast), compared to Trump's 74,216,154 (46.9% of the total). All else being equal, this would normally make you conclude that around ~193,000 Biden voters have died since then vs. ~176,000 Trump voters...around 17,000 more Biden voters, give or take.
Of course, all else is not equal, not even remotely. The cumulative COVID death rate was still twice as high in the bluest tenth of the U.S. as of Election Day 2020...but by Inauguration Day (January 2021) the death rate in Red America had completely caught up, and the Red/Blue gap has continued to grow almost every day since then.
In fact, as of the end of December 2021, COVID deaths were running 2.7x higher in the reddest tenth of the country than the bluest tenth.
Here's what that looked like at the time. I estimated that around 192,000 Trump voters and perhaps 175,000 Biden voters had died of COVID since then...or roughly 17,000 more Trump voters than Biden voters nationally...a ~34,000 net "Red Shift" from the simplistic "national popular vote" estimate:
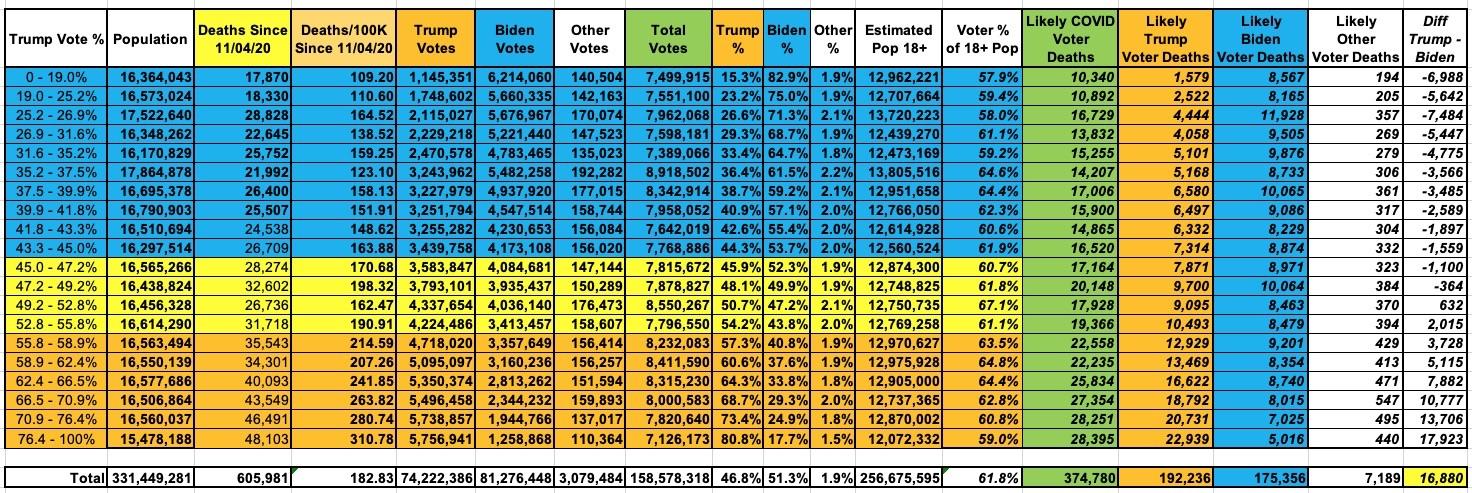
- Trump voters: ~192,200
- Biden voters: ~175,400
- Voted for Someone Else: ~7,200
- Net Trump - Biden voters: ~16,900
HOWEVER, this was still missing several major factors:
- The most obvious one is AGE. Nearly 75% of all U.S. COVID deaths have been among those 65 or older, and another ~20% or so are among those 45 - 64. Since Republicans tend to be older on average than Democrats, that could make a big difference. Then again, older voters are a lot more likely to vote regardless of party, so some of that is likely already accounted for in the results above.
- Second: Besides the massive partisan vaccination gap (which has continued to grow larger ever since last spring) Republicans are far less likely to wear masks if not required to (or even if they are, I'd imagine), and I'm pretty sure they're also a lot less likely to socially distance or follow other mitigation protocols.
- Third, there's also an unknown number of COVID deaths which have simply never been reported properly:
Short-staffed, undertrained and overworked coroners and medical examiners took families at their word when they called to report the death of a relative at home. Coroners and medical examiners didn’t review medical histories or order tests to look for COVID-19.
They, and even some physicians, attributed deaths to inaccurate and nonspecific causes that are meaningless to pathologists. In some cases, stringent rules for attributing a death to COVID-19 created obstacles for relatives of the deceased and contradicted CDC guidance.
These trends are clear in small cities and rural areas with less access to healthcare and fewer physicians. They’re especially pronounced in rural areas of the South and Western United States, areas that heavily voted for former President Donald Trump in the 2020 presidential election.
All of these factors almost certainly make the partisan death rate gap even larger than the raw voting results would suggest. The question is, how much larger?
At the time, I just applied a 20% red modifier...that is, in each county, I looked at the results if you shift the baseline numbers 20% higher for Trump voters, like so:
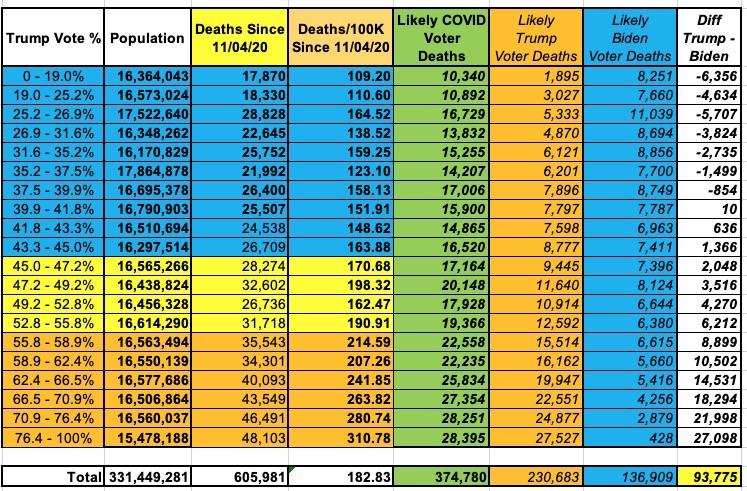
- Trump voters: ~230,700
- Biden voters: ~136,900
- Voted for Someone Else: ~7,200
- Net Trump - Biden voters: ~93,800
Here's what my prior methodology looked like at state level the baseline, Trump +10% and Trump +20% levels:
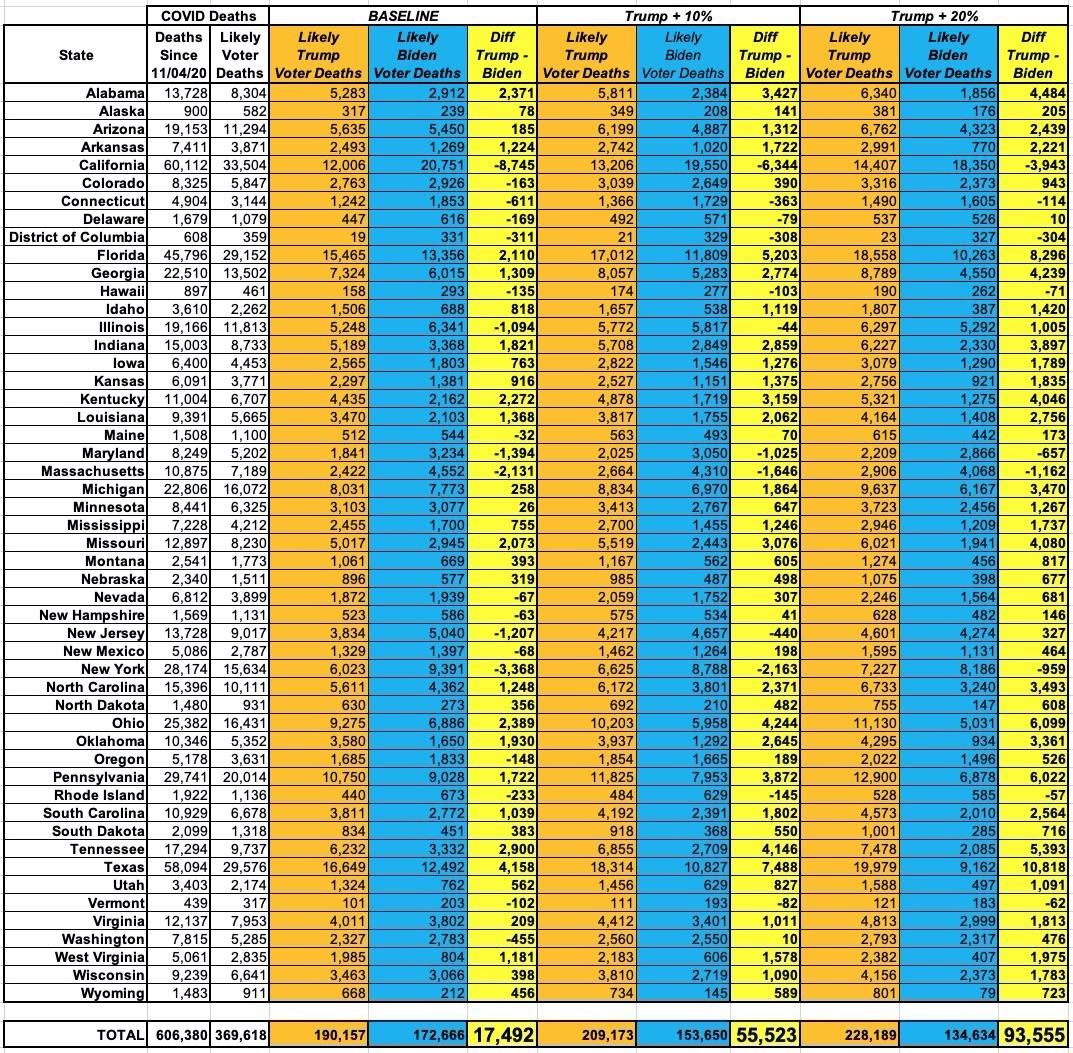
Assuming the above was roughly accurate, the biggest net gap as of the end of December was around 11,000 people in Texas, even assuming the +20% multiplier. Here's the closest 2020 states, with their winning margin for comparison:
- Arizona: ~2,400 (2020 margin: 10,500)
- Georgia: ~4,200 (2020 margin: 11,800)
- Michigan: ~3,500 (2020 margin: 154,200)
- Nevada: ~700 (2020 margin: 33,600)
- Pennsylvania: ~6,000 (2020 margin: 80,600)
- Wisconsin: ~1,800 (2020 margin: 20,700)
- North Carolina: ~3,500 (2020 margin: 74,500)
- Florida: ~8,300 (2020 margin: 371,700)
- Texas: ~10,800 (2020 margin: 631,200)
- Ohio: ~6,100 (2020 margin: 475,700)
- Iowa: ~1,800 (2020 margin: 138,600)
- Alaska: ~200 (2020 margin: 36,200)
Now, I don't have the capability at this time to tackle the second or third factors above (GOP non-compliance with mitigation measures or COVID deaths not being recorded as such by GOP-leaning county coroners/medical examiners), but I have taken it upon myself to break out the official COVID deaths to date based on age.
Unfortunately I can only do this at the state level, not county, but it should still be pretty useful. Here's my methodology:
The last link goes ot the NY Times main 2020 Exit Poll page, but there are links there to exit polls for all 50 states nationally. About half the states use the National Election Pool Exit Poll by Edison Research (which was also used by ABC, CBS, NBC and CNN); the other half of the states appear to use estimates from A.P. VoteCast (a joint venture between The Associated Press & NORC at the University of Chicago).
It's important to keep in mind that exit polls, even ones run by experts, have a lot of problems...but this is the best I have to work with.
I should also note that there was no exit poll available at all for the District of Columbia, and in a half-dozen small states (Hawaii, North Dakota, Rhode Island, South Dakota, Vermont and Wyoming), the sample size was too small for the exit poll to even list voters age 18 - 45. For DC I just used a small spread (Trump only received 5% of the vote anyway, so I can't imagine it ranged too widely). For the other six states I relied on larger states with roughly the same statewide results (West Virginia for Wyoming, etc.) for the 18 - 45 demographics.
It's also important to note that the total number of COVID voter deaths since 11/04/20 is somewhat higher than it was just a few weeks ago. At the time I had it estimated to be around 375,000, but I now estimate it to be more like 456,000. This is partly due to the 2,000+/day additional Americans who are dying of COVID every day, partly due to the state-level data including thousands of deaths whose counties of residence are unknown, and partly due to a change in methodology in estimating what percent of the total population voted in 2020.
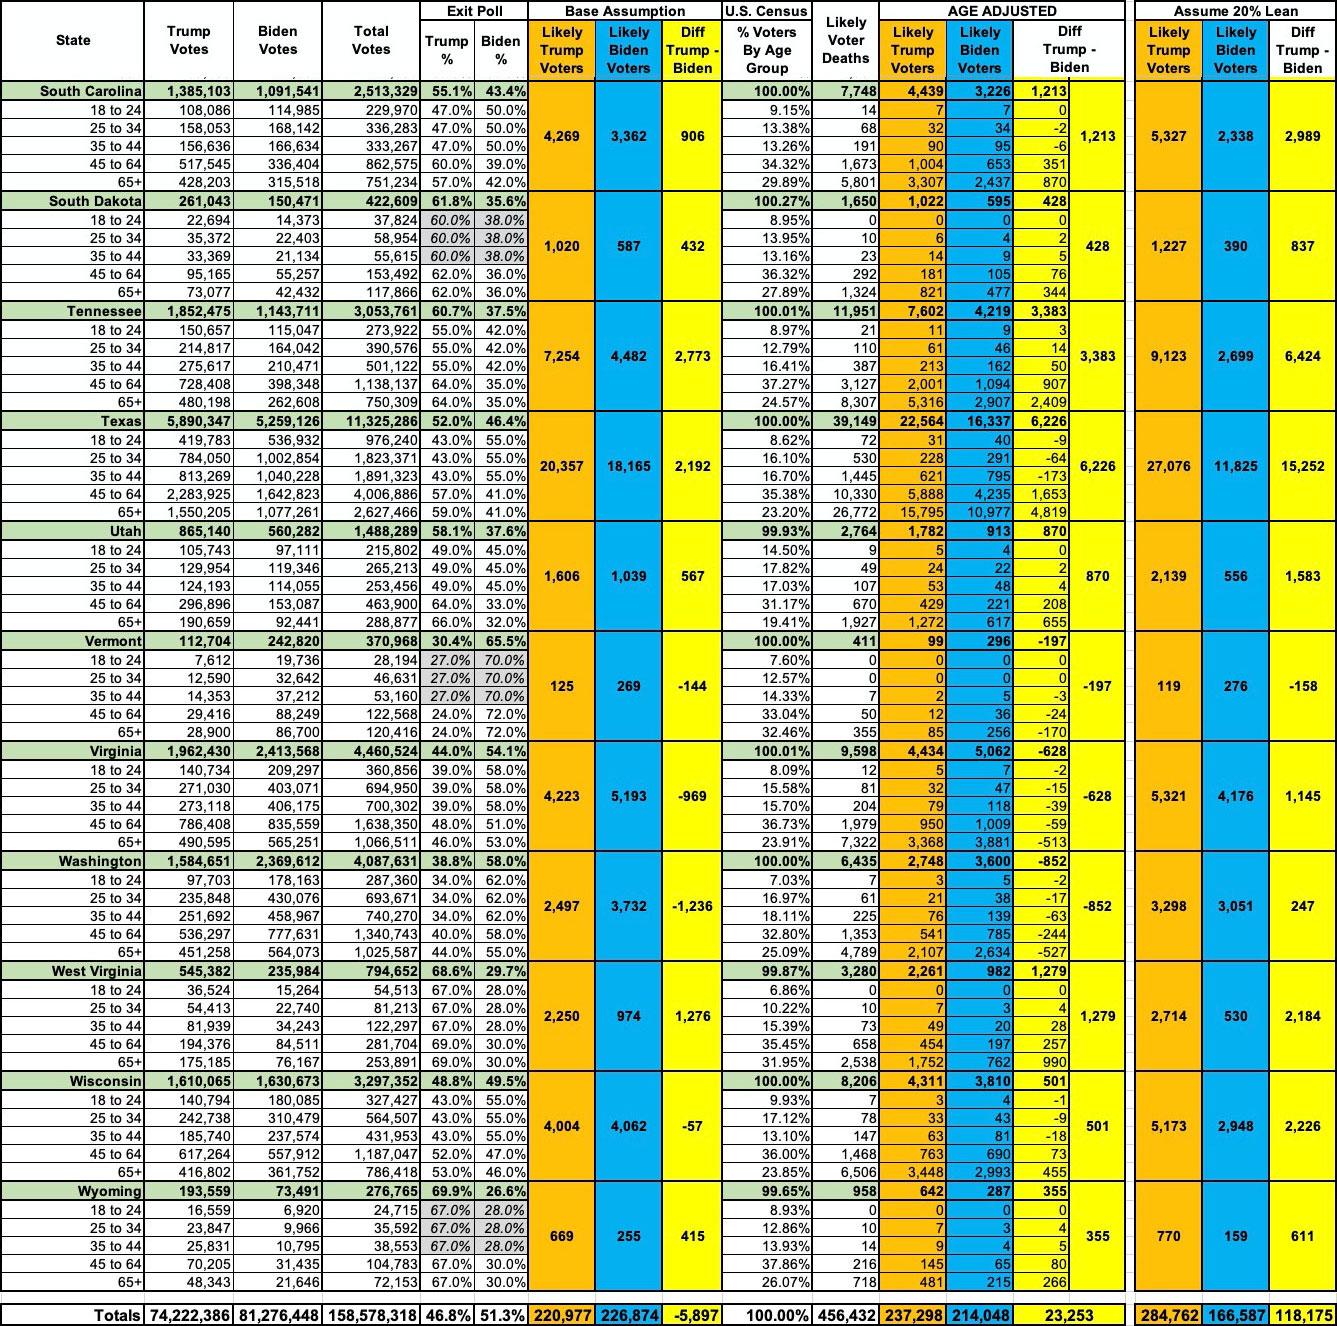
OK, with all this in mind, here's what it looks like:
- The "Base Assumption" columns don't take anything into account other than the statewide election results and the post-11/04/20 election COVID death toll in each state. If you stopped there, there'd be nearly 6,000 more Biden voters than Trump voters who've died since the 2020 election...still an 11,000 swing from what a national popular vote count would give you.
- The "Age Adjusted" columns are just that: Each state's voter turnout and COVID death toll has been broken out by age bracket and calculated accordingly, using the exit polls as noted. When you adjust for age, you end up with over 23,000 more Trump voters who've died since the 2020 election to date...a 40,000 swing from the popular vote expectation.
- Finally, the "Assume 20% Lean" columns attempt to account for the other factors I mentioned earlier: Misreported COVID deaths by MAGA coroners, the impact of refusal to wear masks/socially distance and so forth. Assuming this is reasonably accurate, it adds up to around 118,000 more Trump voters (roughly a 135,000 swing from popular vote expection).
If accurate, the high-end estimate would mean roughly 70% more Trump voters than Biden voters have died of COVID since the 2020 election.
Due to the large volume of data, I've broken the spreadsheet into 5 image files of 10 states apiece. Click on each for a higher-resolution version:


Looking at the swing states/semi-swing states again, and assuming the highest-end estimates, you get:
- Arizona: ~3,400 (2020 margin: Biden + 10,500)
- Georgia: ~4,500 (2020 margin: Biden + 11,800)
- Michigan: ~3,000 (2020 margin: Biden + 154,200)
- Nevada: ~1,900 (2020 margin: Biden + 33,600)
- Pennsylvania: ~6,500 (2020 margin: Biden + 80,600)
- Wisconsin: ~2,200 (2020 margin: Biden + 20,700)
- Alaska: ~200 (2020 margin: Trump + 36,200)
- Florida: ~10,700 (2020 margin: Trump + 371,700)
- Iowa: ~2,000 (2020 margin: Trump + 138,600)
- North Carolina: ~4,500 (2020 margin: Trump + 74,500)
- Ohio: ~7,800 (2020 margin: Trump + 475,700)
- Texas: ~15,200 (2020 margin: Trump + 631,200)
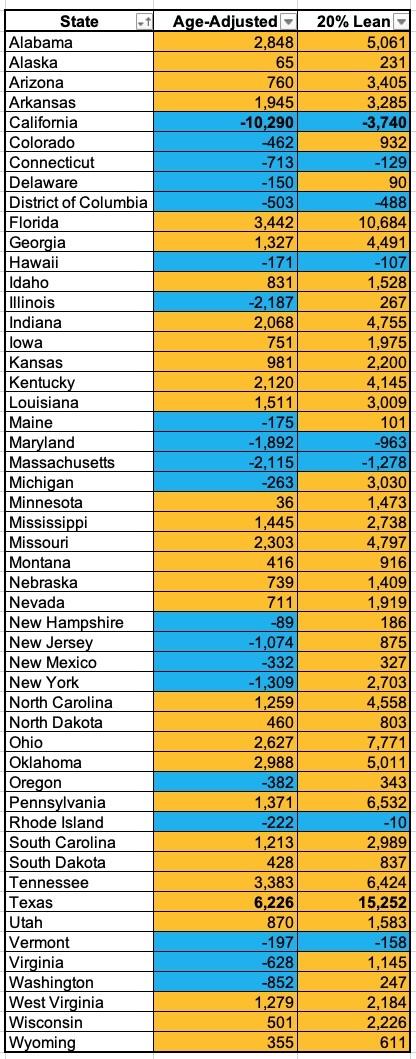
Here's a table showing the estimated difference for every state. Orange = More Trump voter deaths, Blue = More Biden voter deaths. California and Texas have the highest raw difference at both the low and high-end estimates, as you'd expect seeing how they're the largest states in the country:
Notice that even after all the additional number-crunching and age-adjusting, the estimates nationally aren't really that different from my previous attempt. I've gone from a range of 17,000 - 94,000...to a range of 23,000 - 118,000.
Again: The net gap between Trump & Biden COVID deaths will likely continue to increase somewhat between now and November, but aside from a handful of extremely close races, I doubt that will be enough to make the difference in who ends up winning.
For that matter, even if the "death gap" numbers were significantly higher, it won't mean much if millions of Americans who voted for Biden and/or other Dems in 2020 decide to flip or simply don't show up at all in 2022 because they blame him for the pandemic continuing. As I noted back in September:
This is perhaps the most cynical thing I've ever typed in a blog entry, but there's no getting around it:
GOP leadership, FOX News, Trump/MAGA etc don't appear to care how many of their own voters die as long as they damage President Biden's approval rating in the process.
While I'm sure they'd much rather every person who dies of COVID be a Democrat, losing ~250,000 of their own supporters appears to be a small price to pay if it results in them flipping control of the House and/or Senate next year.
At the time, I coached this in grave language to make it clear that this was a shocking statement.
Recently, Politico just stated it matter of factly as the GOP's official midterm strategy.
Once again, this scene from "Class Action" boils their entire strategy down to its essence:
Maggie: May I ask a question, please?
Getchell: Sure.
Maggie: Why didn't you just change the blinker circuit? It's just a question.
Getchell: I told Flannery about the problem a month or so before he died. He called in his head bean counter.
Maggie: What's that? Risk management expert, right?
Getchell: Yeah. Flannery shows him the data and asks him how much it would cost to retrofit...
Maggie: You mean recall?
Getchell: Yeah, you got it. To retrofit 175,000 units. Multiply that times 300 bucks a car, give or take. You're looking at around $50 million.
So the risk guy, he crunches the numbers some more. He figures you'd have a fireball collision about every 3,000 cars.
That's 158 explosions. Which is almost as many plaintiffs as there are. These guys know their numbers.
So you multiply that times $200,000 per lawsuit. That's assuming everybody sues and wins. 30 million max.
See? It's cheaper to deal with the lawsuits than it is to fix the blinker.
It's what the bean counters call a simple actuarial analysis.
Advertisement
