

RED SHIFT: How Trump's attempt to let COVID-19 destroy Blue America reversed itself, animated
Wed, 11/17/2021 - 12:18am
Back in July 2020, Vanity Fair reporter Katherine Eban wrote a shocking expose which exposed the depths of callousness and cold-hearted political calculation which the Trump Administration used to guide their horrific response to the COVID-19 pandemic when it reached U.S. shores:
Six months into the pandemic, the United States continues to suffer the worst outbreak of COVID-19 in the developed world. Considerable blame belongs to a federal response that offloaded responsibility for the crucial task of testing to the states. The irony is that, after assembling the team that came up with an aggressive and ambitious national testing plan, Kushner then appears to have decided, for reasons that remain murky, to scrap its proposal.
...The plan crafted at the White House, then, set out to connect the dots. Some of those who worked on the plan were told that it would be presented to President Trump and likely announced in the Rose Garden in early April. “I was beyond optimistic,” said one participant. “My understanding was that the final document would make its way to the president over that weekend” and would result in a “significant announcement.”
But no nationally coordinated testing strategy was ever announced. The plan, according to the participant, “just went poof into thin air.”
...the effort ran headlong into shifting sentiment at the White House. Trusting his vaunted political instincts, President Trump had been downplaying concerns about the virus and spreading misinformation about it—efforts that were soon amplified by Republican elected officials and right-wing media figures. Worried about the stock market and his reelection prospects, Trump also feared that more testing would only lead to higher case counts and more bad publicity.
...Most troubling of all, perhaps, was a sentiment the expert said a member of Kushner’s team expressed: that because the virus had hit blue states hardest, a national plan was unnecessary and would not make sense politically. “The political folks believed that because it was going to be relegated to Democratic states, that they could blame those governors, and that would be an effective political strategy,” said the expert.
In short, as I said at the time, The Trump Administration decided that more Democrats would get sick and/or die from COVID-19 than Republicans, so they didn't give a rat's ass.
This alone should have been enough for the entire Trump team to be charged with mass murder (or at least gross negligence). And yet...here we are.
A few days ago, the main thrust of Eban's July 2020 story was pretty much confirmed by internal documents and interview transcripts released by a Congressional committee investigation:
Documents and interview transcripts released by a congressional committee shine additional light on how the Trump administration interfered with the Centers for Disease Control and Prevention, undermining the agency’s efforts to communicate the seriousness of the pandemic to the American people as the virus began to spread throughout the country.
Emails and transcripts of interviews with former senior CDC officials released by the House select subcommittee on the coronavirus crisis reveal just how far administration officials went to tamp down the CDC’s public health communication efforts in the face of an emerging viral threat.
...Through its investigations, the select subcommittee has uncovered a staggering pattern of political interference from Trump Administration officials in critical aspects of CDC’s pandemic response efforts.”
...For three months after the February briefing, the administration banned CDC officials from conducting any public briefings at the very same time the virus was rapidly spreading throughout the United States. The administration additionally denied numerous media requests for interviews with CDC officials. Schuchat said that she and many of her fellow CDC scientists felt that they “were hamstrung by a White House whose decisions are driven by politics rather than science.”
With this in mind, the graphs below become doubly ironic (on top of being tragic).
..........
Back in August I created an animation which showed how the COVID vaccination rates of all 3,144 counties in the United States (50 states + DC, anyway) increased over time, starting in early February 2021.
The most obvious takeaway from this was that for the first month or two there was no partisan divide in the rate at which elderly Americans got vaccinated; it was pretty even across the board.
As soon as the Pfizer, Moderna and Johnson & Johnson vaccines were given the green light for all adults (and 12 - 17 yr olds soon after that), however, the Red/Blue divide became immediately obvious...and continued to increase every week for months on end:
I was thinking about creating an updated version of this animation which would bring it up to date through mid-November, but honestly, the animation above already tells most of the story. The slope continued to increase up until late September; since then it's pretty much remained stable, with both the blue and red counties generally increasing at roughly the same rate...but with the red counties remaining sorely behind overall.
..........
INSTEAD, I decided to create a different type of animation. This one looks at the COVID death rates across all 3,144 U.S. Counties over time, based again on what percent of the vote Donald Trump received in 2020. Instead of a scatter plot graph, this time I've decided to use bar graphs, with the counties grouped into 10 brackets of roughly 33.1 million Americans apiece.
Before I get to the animated version, let's take a look at a few key dates.
(I should also note that just as with the vaccination graphs, the graphs below don't include a relatively small number of COVID deaths among people whose county of residence is unknown or who had lived outside the state their death was recorded in.)
As is common knowledge by now, the COVID-19 pandemic hit the densely-populated major metropolitan areas first...which also happen to be heavily Democratic. New York and New Jersey were hit particularly hard. Meanwhile, the sparsely-populated rural areas of the country...which also happen to be heavily Republican...were relatively unscathed at first.
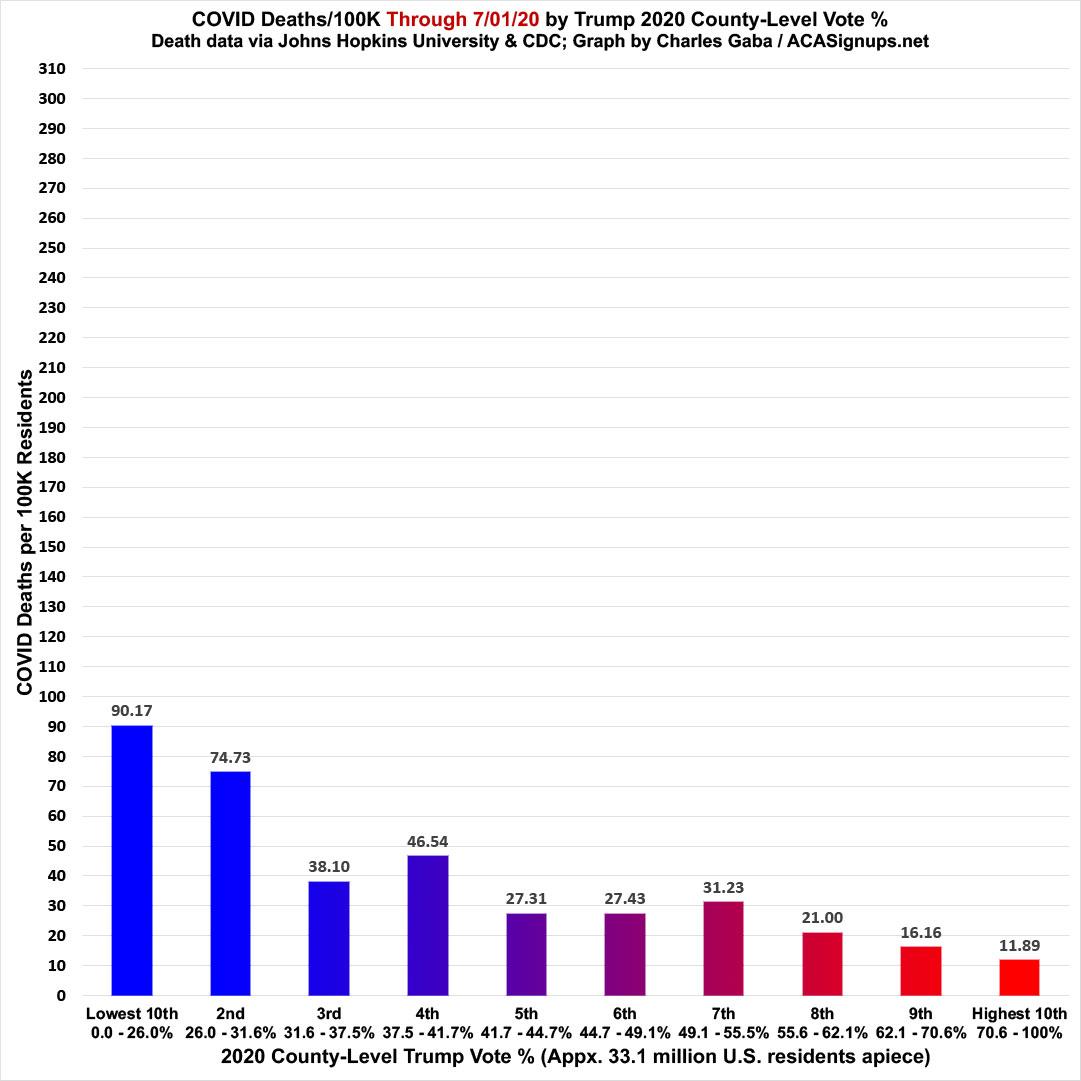
Here's what it looked like as of July 1st, 2020: The death rate in the bluest tenth of the country (first bracket) was nearly 7.6x higher than in the reddest tenth of the country (last bracket):
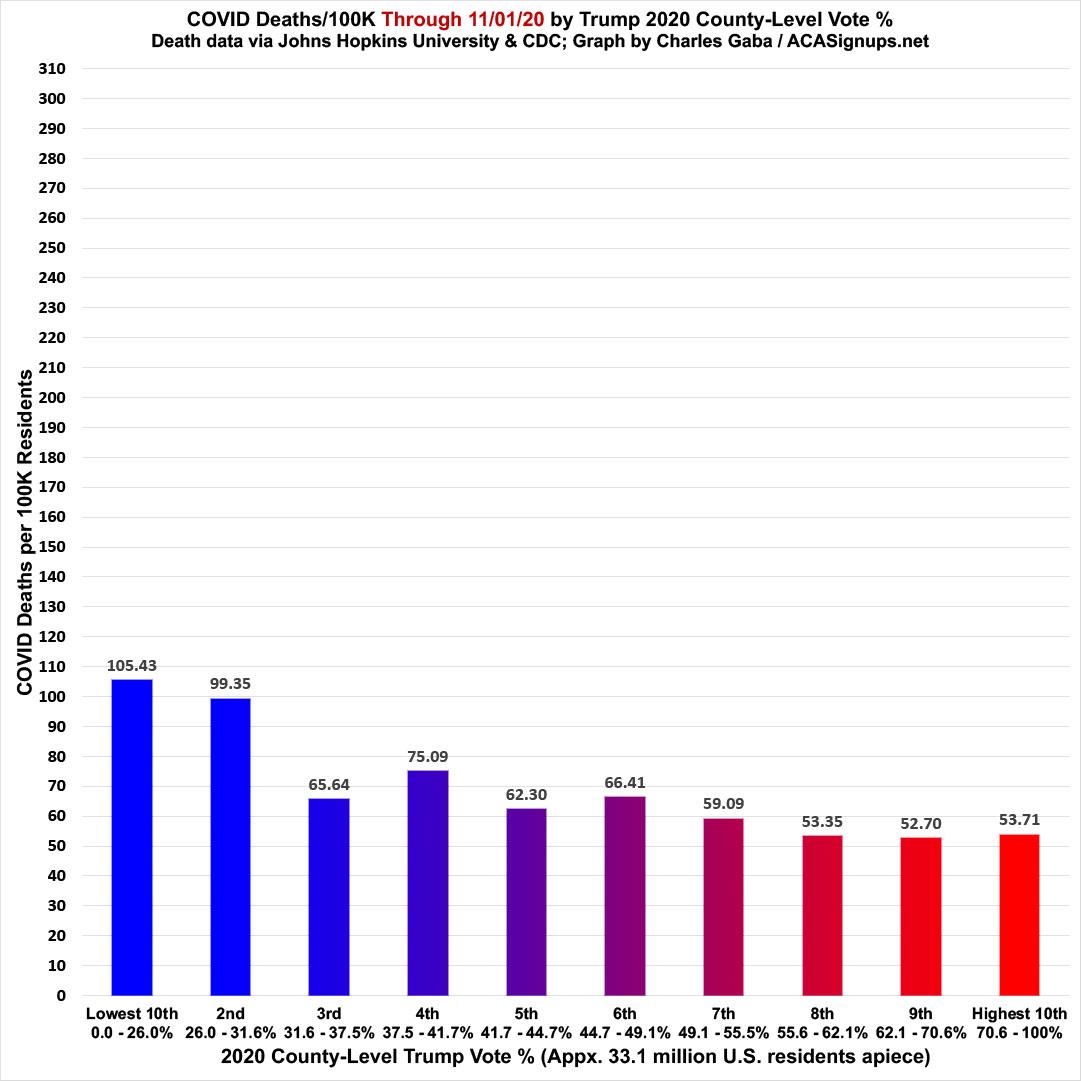
By last fall, however, the situation had changed: While the bluest parts of the country began to recover from the initial devastation, the rural red counties hadn't seemed to do a whole lot to prepare themselves. By Election Day 2020, the death rate in the bluest counties was only around 2.0x higher than in the reddest counties:
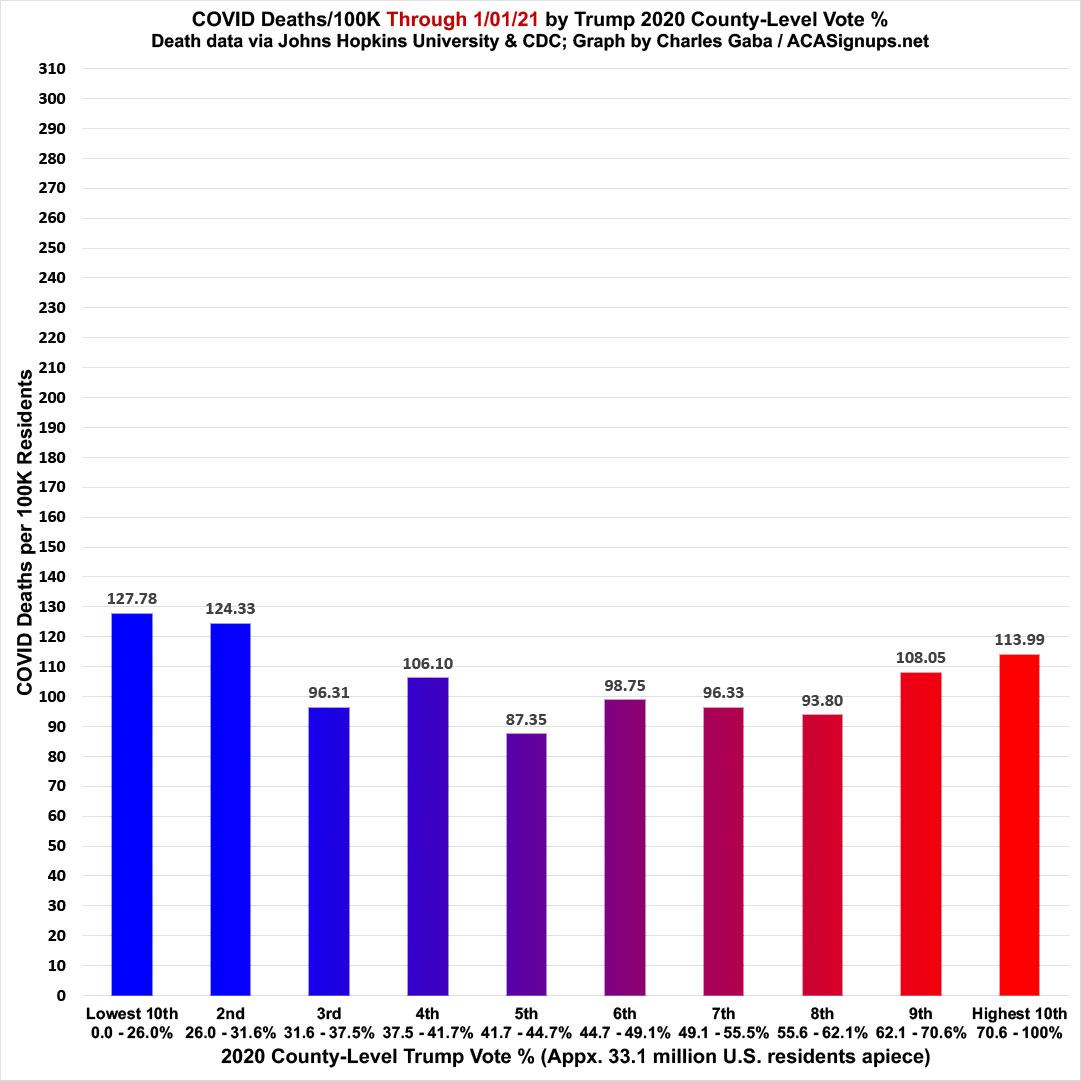
Here's where things stood on New Year's Day, 2021: The death rates in the reddest parts of the country had begun to quickly catch up, to the point that the cumulative death rate was only 12% higher in the bluest areas than the reddest areas:
Nationally, January & February 2021 saw the ugliest wave of the pandemic to date, with daily deaths hitting a high of over 5,000 deaths in a single day at one point...right around the same time that the newly-in-charge Biden Administration took the reins and began the massive nationwide vaccination program.
It was also around this point that the death rate in the reddest counties of the United States equalled and began to surpass the bluest counties.
Actually, "around this point" is seriously understating it. I double and then triple-checked the data on this to make sure I had this right...take a look at the exact date that the reddest bracket moved ahead of the bluest one:
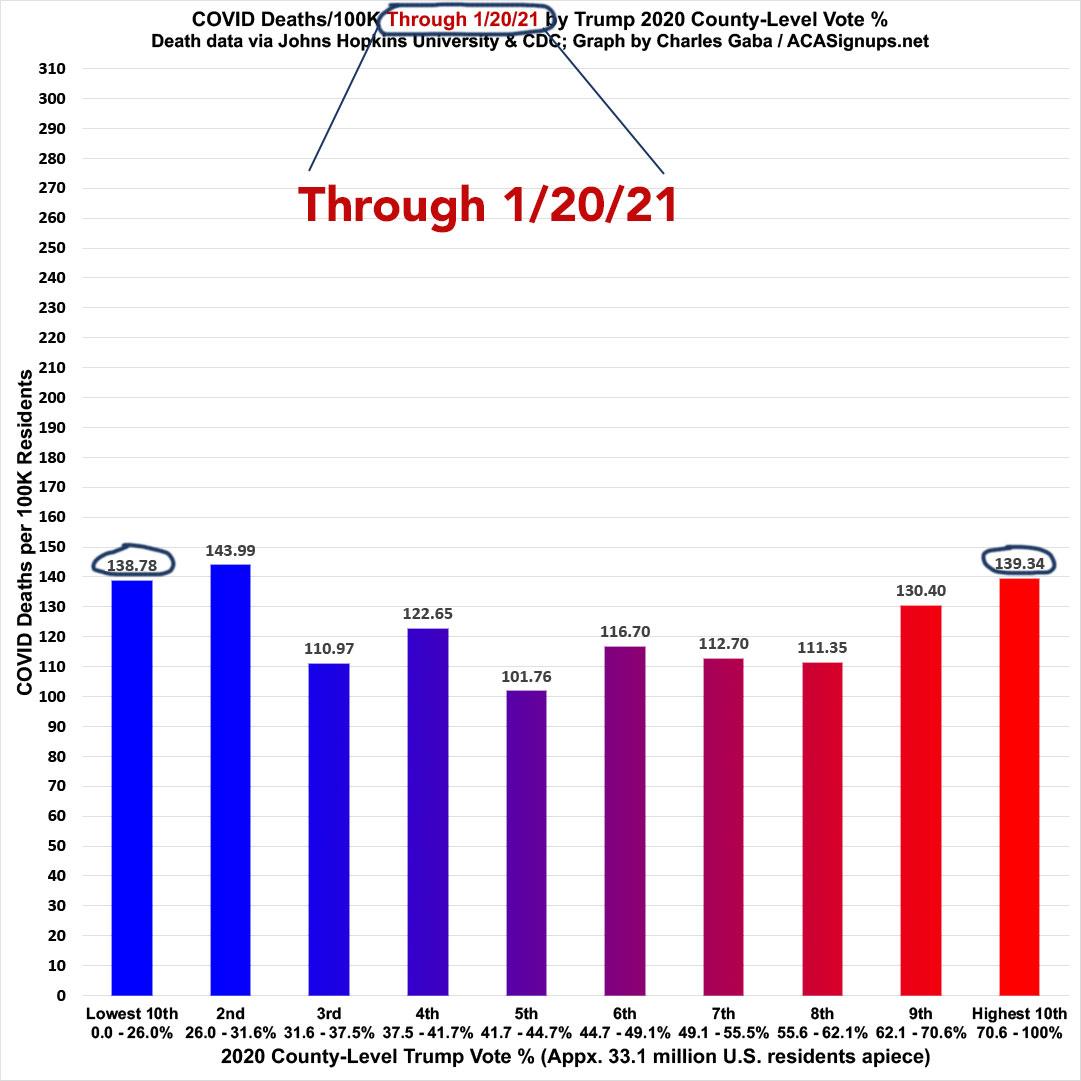
Holy smokes.
Even if you combine the first five and last five brackets to split the entire population rughly 50/50, you'll find that they were almost exactly equal on Inauguration Day (123.6/100K vs. 122.1/100K on average). Even measuring it that way, the flip from Blue to Red counties having a higher death rate would happen within a few days.
The COVID pandemic killed more Americans at a higher in Blue Counties than Red Counties right up until the moment Trump left office...after which it flipped to being more of a Red County crisis.
I realize this timing is pure coincidence (I also assume it would be a few days earlier or later if the home counties of the missing deaths were properly categorized), but it's one hell of an eerie one.
..........
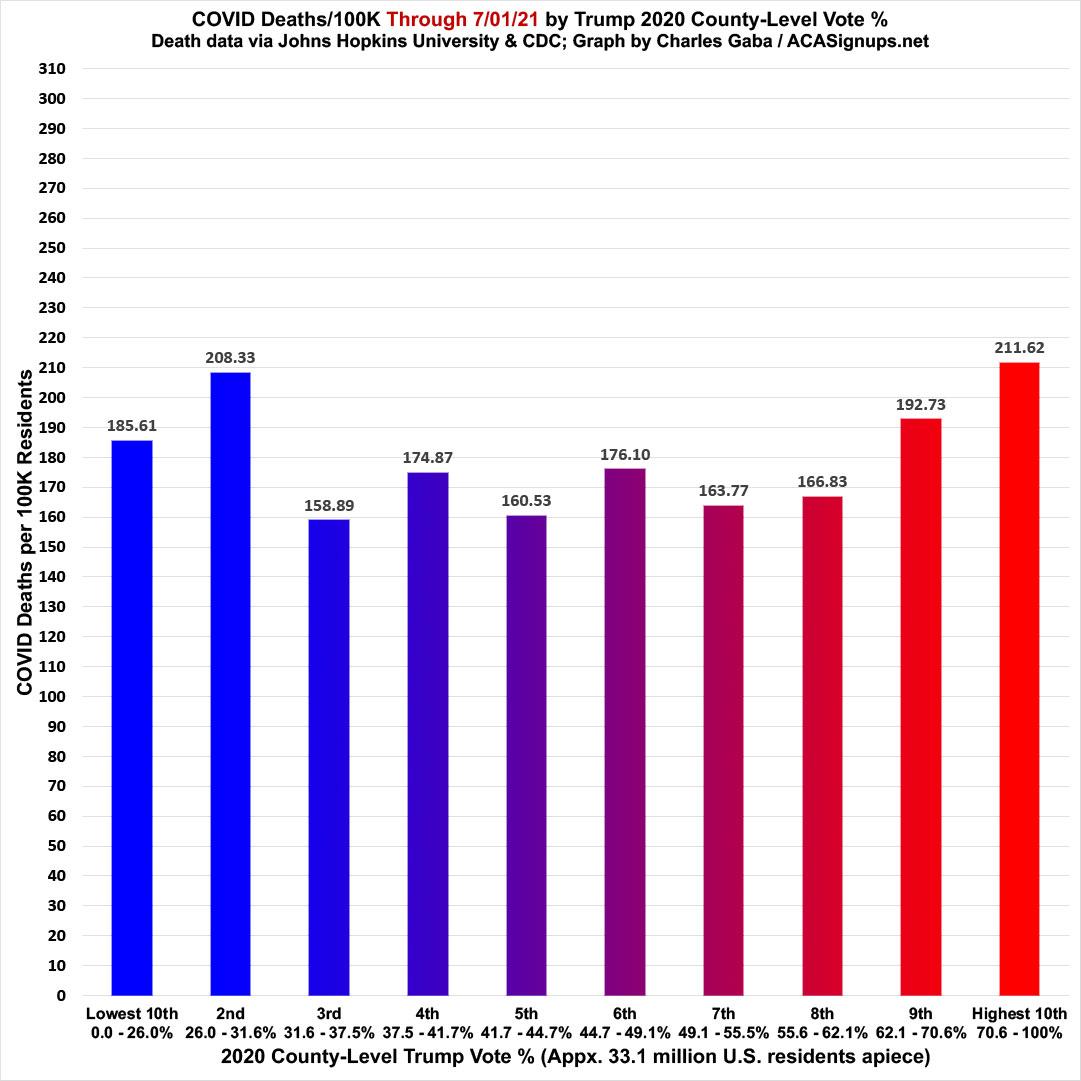
Here's what the situation looked like on July 1st, 2021...right around the point that the Delta Variant began to slam the unvaccinated half of the U.S. population. As you can see, by this point the death rate in the reddest tenth of the country was 14% higher than in the bluest tenth (and just barely higher than the 2nd bracket):
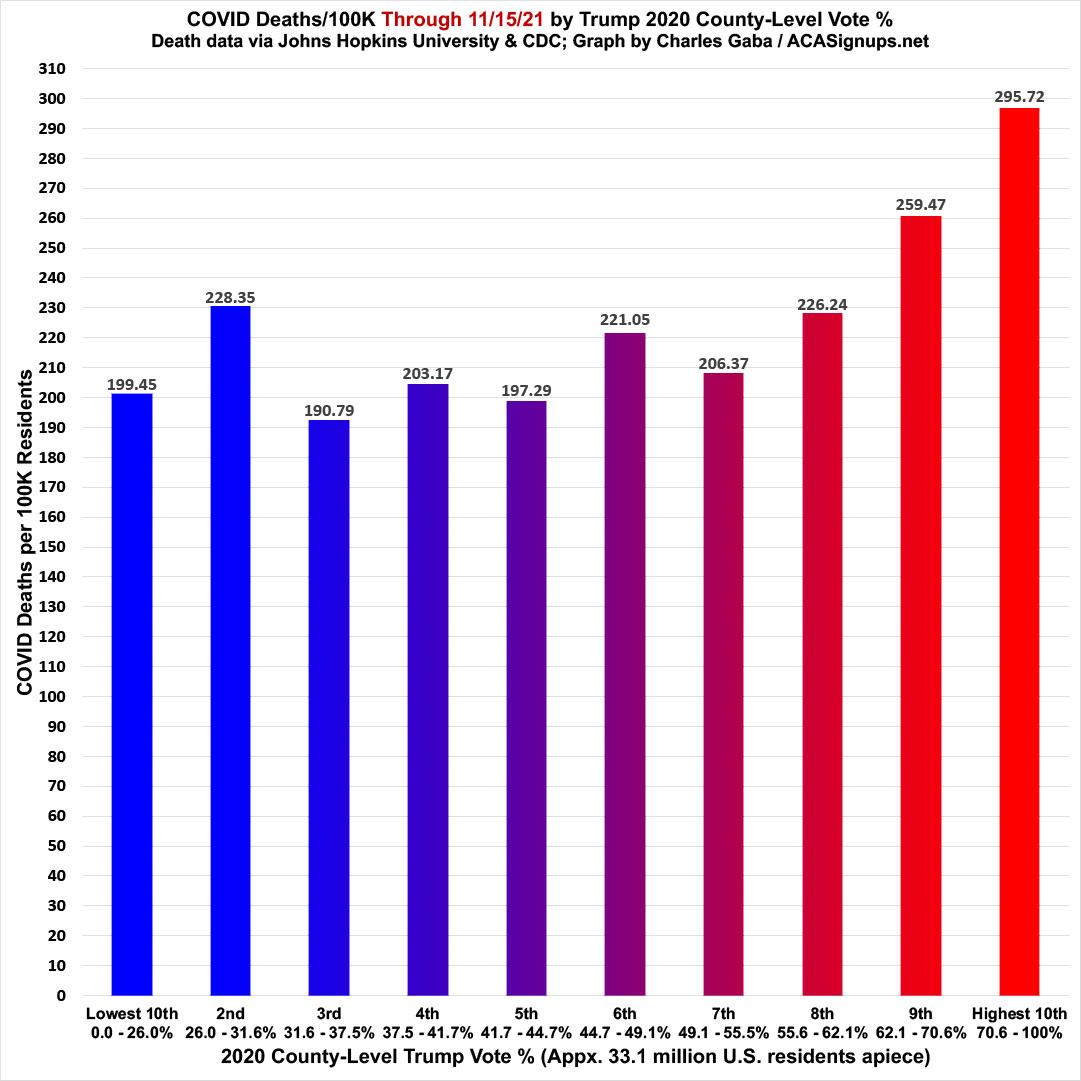
Since then, of course, Delta has been tearing through the unvaccinated population, killing well over 1,000 people per day for much of the fall...and the vast majority of those have been in the reddest parts of the country. Here's what it looked like as of just two days ago, on November 15th, 2021. The cumulative death rate in the reddest tenth is now over 48% higher than the bluest tenth:
..........
Finally, here's what it looks like when you put the entire history of the COVID-19 pandemic to date together.
I didn't start the vaccination animation until February 2021 because, of course the vaccines weren't available until shortly before then.
COVID deaths, on the other hand, have of course been happening in the U.S. since at least late January 2020. I'm starting this animation on March 15, 2020, when there were only around 200 known COVID deaths nationally; each frame covers about 2 weeks of time (the 1st and 15th of each month):

Get Vaccinated.
Get a booster shot when you can.
Keep wearing a mask.
Advertisement
