

2022 OEP Week 6 HC.gov Snapshot Report: 9.72M enrollees so far; up 21% year over year!
Wed, 12/22/2021 - 10:53am
Hot off the presses, via the Centers for Medicare & Medicaid:
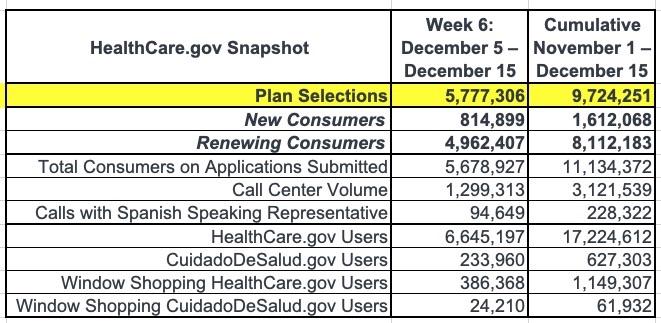
Week 6, December 5 - December 15, 2021
In week 6 of the 2022 Open Enrollment Period, approximately 5.8 million people selected individual market plans or were automatically re-enrolled in a plan through the 33 states that use the HealthCare.gov platform. During the Open Enrollment Period, to date, approximately 9.7 million people have selected individual market plans or were automatically re-enrolled in a plan through HealthCare.gov. While past snapshots this year have measured enrollment weeks Sunday through Saturday, this week’s snapshot for week six also includes the final few days prior to the deadline for January 1 coverage.
In other words, this report runs from Nov. 1st - the Dec. 15th preliminary deadline, which means I no longer have to account for the "missing" day that I have until now when comparing the data to last year. I do still have to subtract Kentucky, Maine & New Mexico from last year's federal exchange data, however, since all three are now state-based exchanges and are counted separately instead.
The number of plan selections associated with enrollment activity during a reporting period may change due to plan modifications or cancellations. In addition, the weekly snapshot only reports new plan selections and plan renewals and does not report the number of consumers who have paid premiums to effectuate their enrollment.
Approximately 2.8 million people newly gained access to affordable health care coverage through the 2021 Special Enrollment Period (SEP); 2.1 million who enrolled in the HealthCare.gov states for 2021, and 738,000 who enrolled in 2021 State-based Marketplaces ahead of the 2022 Open Enrollment Period.
For 2022, three states, Kentucky, Maine and New Mexico, transitioned to State-based Marketplaces (SBMs) for the 2022 Open Enrollment Period. These factors should be considered in any year-over-year HealthCare.gov enrollment comparisons. As in past years, the final Open Enrollment numbers, including SBM numbers, will be provided after Open Enrollment ends in all states.

At first glance this looks like it's 18% higher than last year's Week Six tally of 8,234,722 enrollees.
HOWEVER, as noted above, KY, ME & NM all split off onto their own ACA platforms this year, which means they have to be subtracted from the 2021 OEP total That gives:
- 2022 OEP: 9,724,251
- 2021 OEP: 8,053,842
Here's what the 33 states hosted via HealthCare.Gov look like year over year, apples to apples:
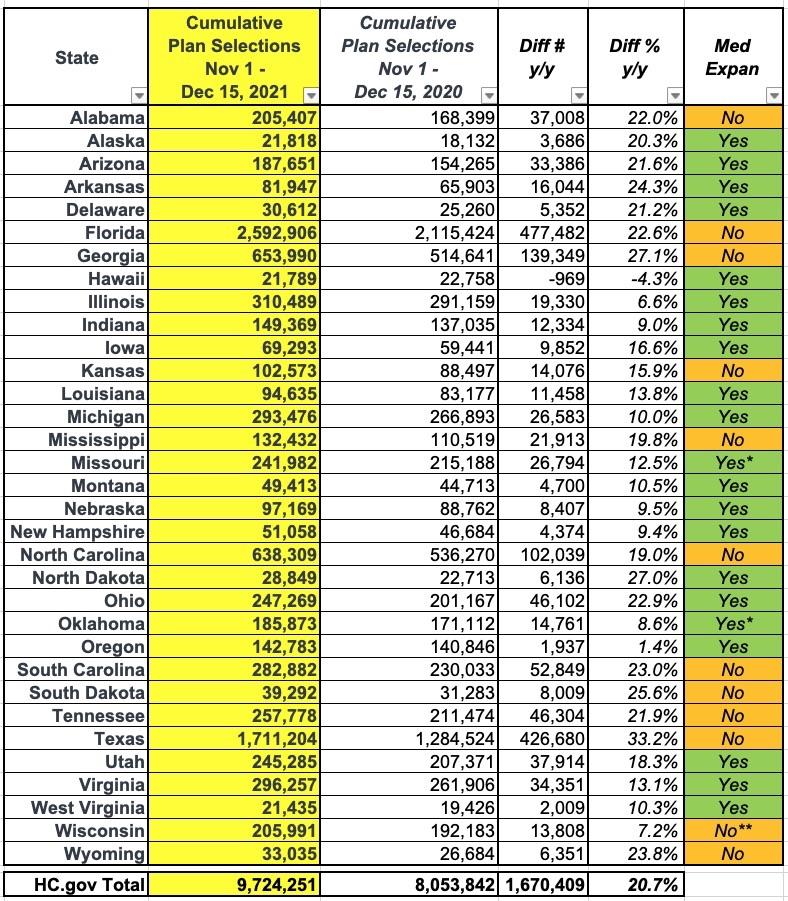
That's right: HC.gov enrollment is actually up 20.7% vs. the same point last year...with a solid 6 weeks of enrollment data left to go (January 15th is only 24 days from today but the data above only runs through 12/15).
It's also worth noting that this is also far higher than HC.gov's enrollment tally at this point in 2016 (around 8.25 million). This is significant because until now, 2016 held the record for the highest total Open Enrollment Period tally (~12.7 million). And even then, at the time HC.gov hosted 38 states vs. the 33 it hosts today.
Looking at new enrollment:
- New Enrollees 2022 OEP: 1,612,068
- New Enrollees 2021 OEP: 1,827,144 (actually ~1,786,946)
That's 11.8% behind...except if you knock off ~2.2% to account for KY, ME & NM, it's closer to a 9% new enrollee drop year over year.
While this is a bit disappointing, remember that unlike last year, HC.gov states still have an extra 6 weeks to enroll for 2022 coverage.
Meanwhile, here's what the renewals look like:
- Renewals 2022 OEP: 8,112,183
- Renewals 2021 OEP: 6,407,578 (actually ~6,266,611)
Again, when you account for the 3 missing states, renewals are up a whopping 29.5% vs. last year.
Today's report doesn't separate out auto-renewals from active renewals, but that will be forthcoming soon.
There's a couple more important things to note here.
First of all, the fact that both Oklahoma and Missouri saw exchange enrollment increase year over year is particularly impressive given that both states expanded Medicaid earlier this year (Oklahoma started in July; Missouri's state goverment was dragged into it kicking & screaming in October).
While most of the 275,000 Missouri residents & 190,000 Oklahomans who are eligible for Medicaid via ACA expansion weren't eligible for ACA exchange plans, a portion of them were (those earning between 100 - 138% of the Federal Poverty Level). I don't know exactly how many of those were actually enrolled in ACA plans prior to being shifted over to Medicaid, but according to the final 2021 OEP Public Use File report, nearly 150,000 of those who enrolled during the 2021 Open Enrollment Period earned between 100 - 150% FPL. Assuming around 85% of those earn 100 - 138% FPL, that suggests perhaps 125,000 who should be shifted over to Medicaid instead.
On the one hand, that doesn't take into account net attrition over the course of the year; on the other hand, it also doesn't include any of the 89,402 MO/OK residents who enrolled during the COVID SEP either (remember, while Oklahoma started their expansion program on schedule in July, which was halfway through the SEP, Missouri residents had no clue whether Medicaid would be expanded at all or not until after the SEP ended in mid-August). Assuming a similar ratio of all SEP enrollees were in the 100 - 150% FPL income bracket to the Open Enrollment Period, that means something like 28,000 additional 100 - 138% FPL enrollees will be shifted over to Medicaid as well.
In other words, across both states, you would expect Oklahoma & Missouri to see an exchange enrollment drop of up to ~150,000 people or so (38% of last year's OEP totals)...and yet instead, they're up 8.6% and 12.5% respectively!
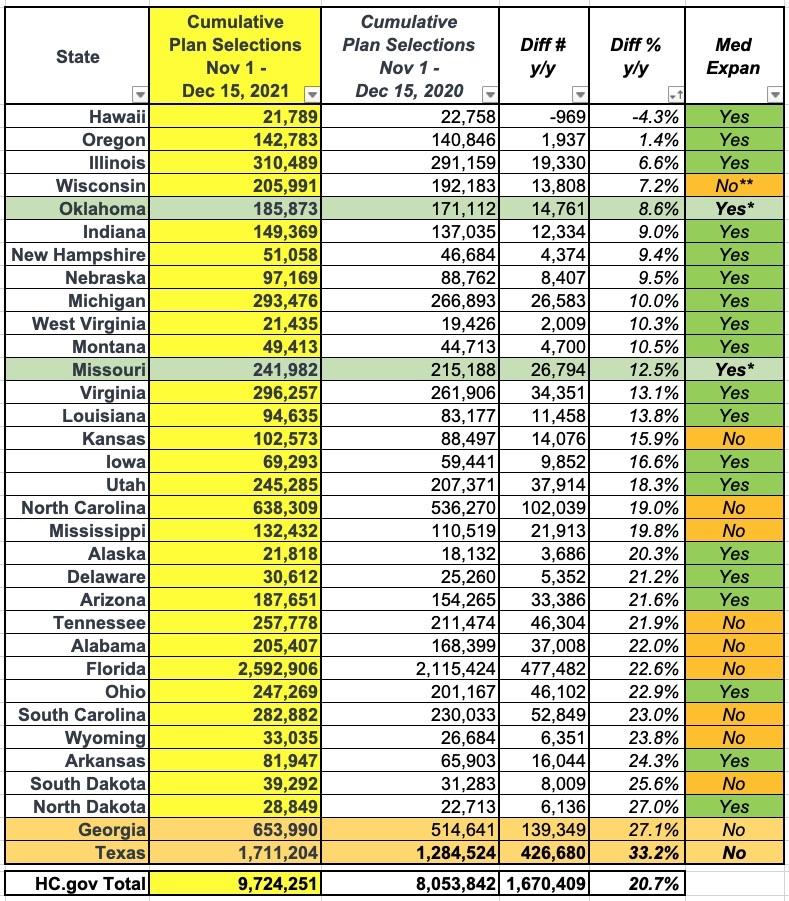
The second important thing to note, also related to Medicaid expansion, is that 11 of the 12 NON-expansion states saw double-digit exchange enrollment increases vs. last year (the 12th, Wisconsin, is a special case, since they haven't fully expanded Medicaid but did partly expand it and thus have no "Medicaid Gap"). Those massive increases in Texas, Georgia and so forth are almost certainly mostly made up of people in that 100 - 138% FPL income range (see above) who are eligible for $0-premium "Secret Platinum" ACA exchange plans for 2022.
In fact, if you look at the non-expansion states alone, their enrollment to date is up 24.4% y/y (the expansion-only states via HC.gov are up 12.8% y/y):
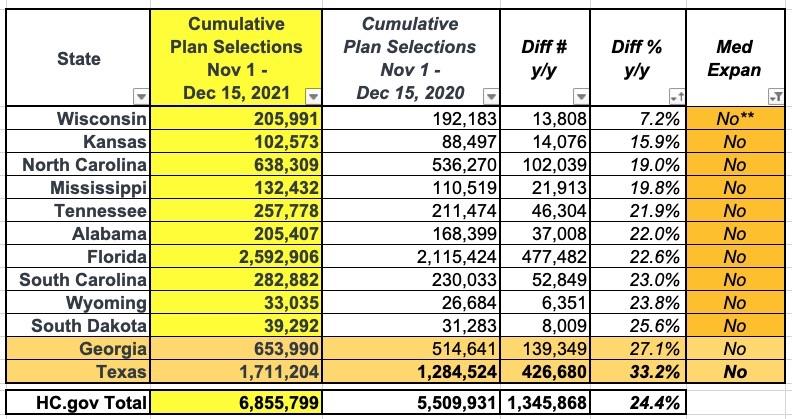
Also: While Texas saw its enrollment increase by a stunning 33%, Georgia's nearly-as-massive 27% y/y increase is especially noteworthy given that the state is currently attempting to opt out of participating in either HealthCare.Gov or any official state-based ACA exchange whatsoever.
That enrollment spike is incredibly important given that part of the justification given by the state of Georgia for kicking HCgov or a state-based exchange to the curb was that they were confident they could increase ACA enrollment by a mere 27,000 people in 2023 by relying exclusively on private brokers instead. The thing is, they were basing their own increase projections on Georgia's 463,000 enrollment figure as of 2020. Georgia assumed that scrapping HC.gov would cause their enrollment to increase to 490K by next year, which isn't exactly impressive given that it's actually already up to 654,000 this year.
Finally, I should also give a shout-out to Florida, which continues to raise eyebrows in terms of total enrollment, especially relative to its total population. Nearly 2.6 million Floridians are now enrolled in ACA exchange plans, which is over 12% of the entire state population! Nationally, that would extrapolate out to nearly 40 million people.
Advertisement
