

Updated/Corrected: Virginia: #COVID19 vaccination rates by county & partisan lean
Tue, 06/01/2021 - 6:40pm
UPDATE: As I figured, the original data was massivly wrong. Just as one simple example, Virginia's own data set puts Danville's vaccination rate at around 35.5% vs. the 0.1% according to the CDC data.
Someone on Twitter pointed me towards this COVID-19 Community Profile Report which explains the problem:
The following states have ≤80% completeness reporting vaccinations by county, which may result in underestimates of vaccination data for counties and CBSAs: VT (74%), CO (73%), WV (54%), VA (51%), GA (50%), HI (0%), AS (0%), TX (0%), PW (0%), FM (0%), MH (0%), MP (0%)
I'm not doing the U.S. territories anyway, and I gathered the data for Hawaii and Texas straight from the state health departments. Sounds like I'll have to do the same for Virginia if possible. I'll also have to go back and re-do Colorado, Georgia and Vermont, though there was at least some clear pattern in those states (Vermont has few enough counties that it'd be hard to see one anyway). I haven't gotten to West Virginia yet.
I'll leave this post up for the moment but will take it down this evening until I've corrected the data.
UPDATE 6/02/21 9:11pm: OK, I'm using the data from the COVID Act Now project instead, which appears to be pulling their data directly from the Virginia Health Dept's website. Oddly, they don't list any numbers for Manassas City and Manassas Park, so I've pulled it directly from the VA COVID Vaccine Tracker myself.
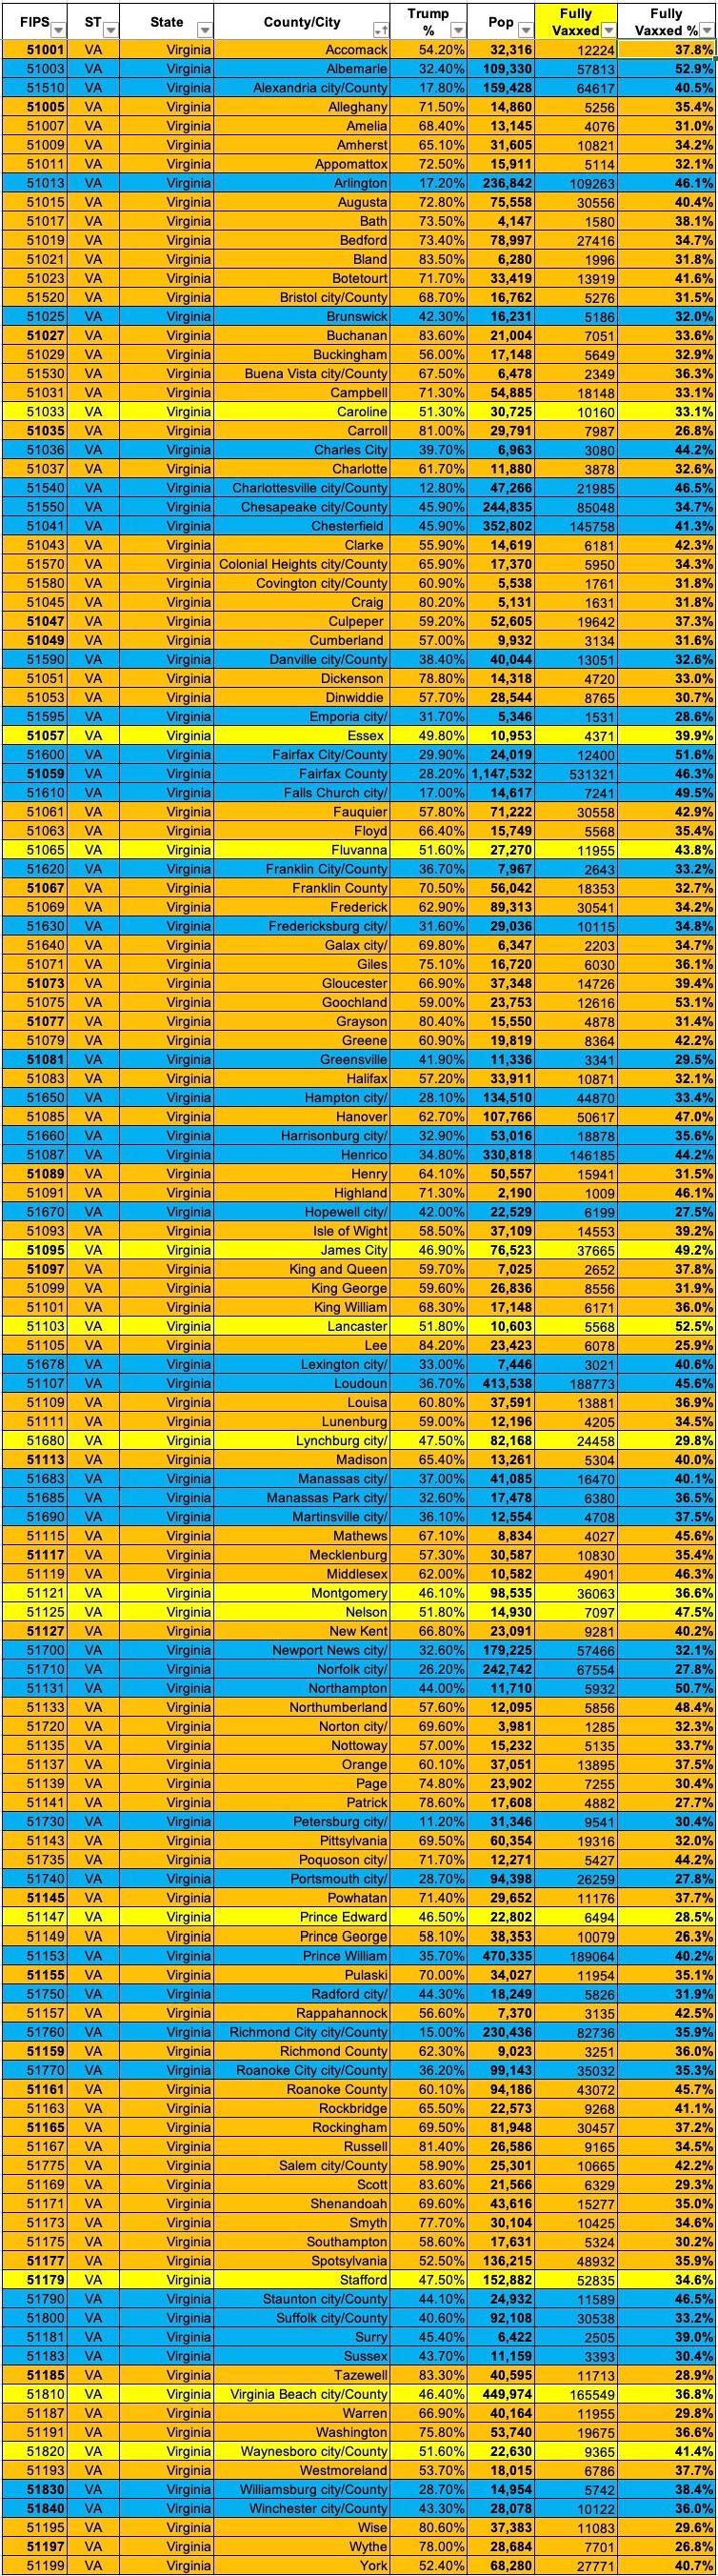
I've swapped out both the graphs and the county/city table with the corrected versions below.
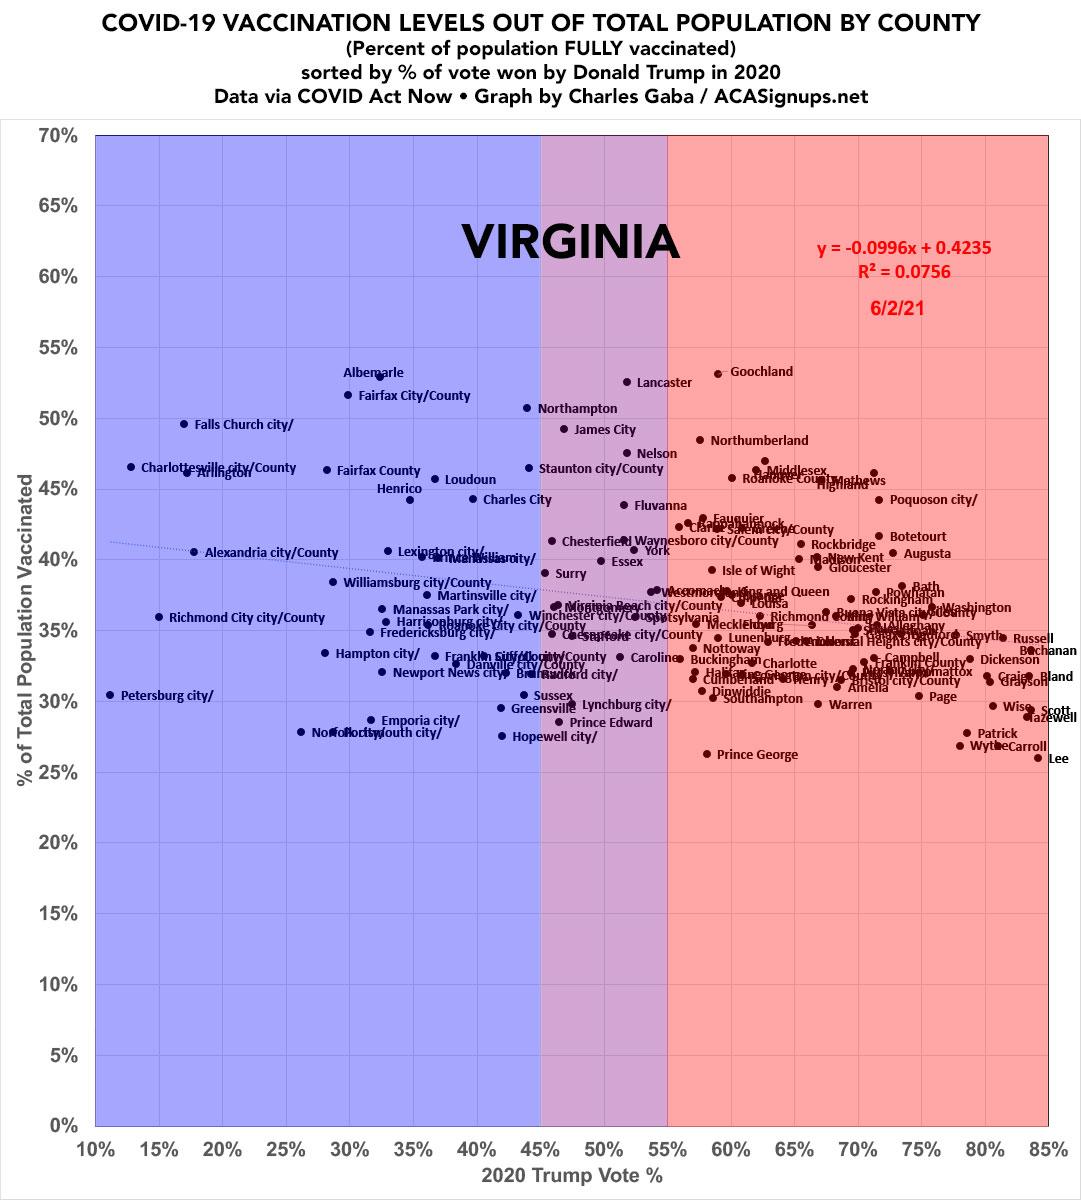
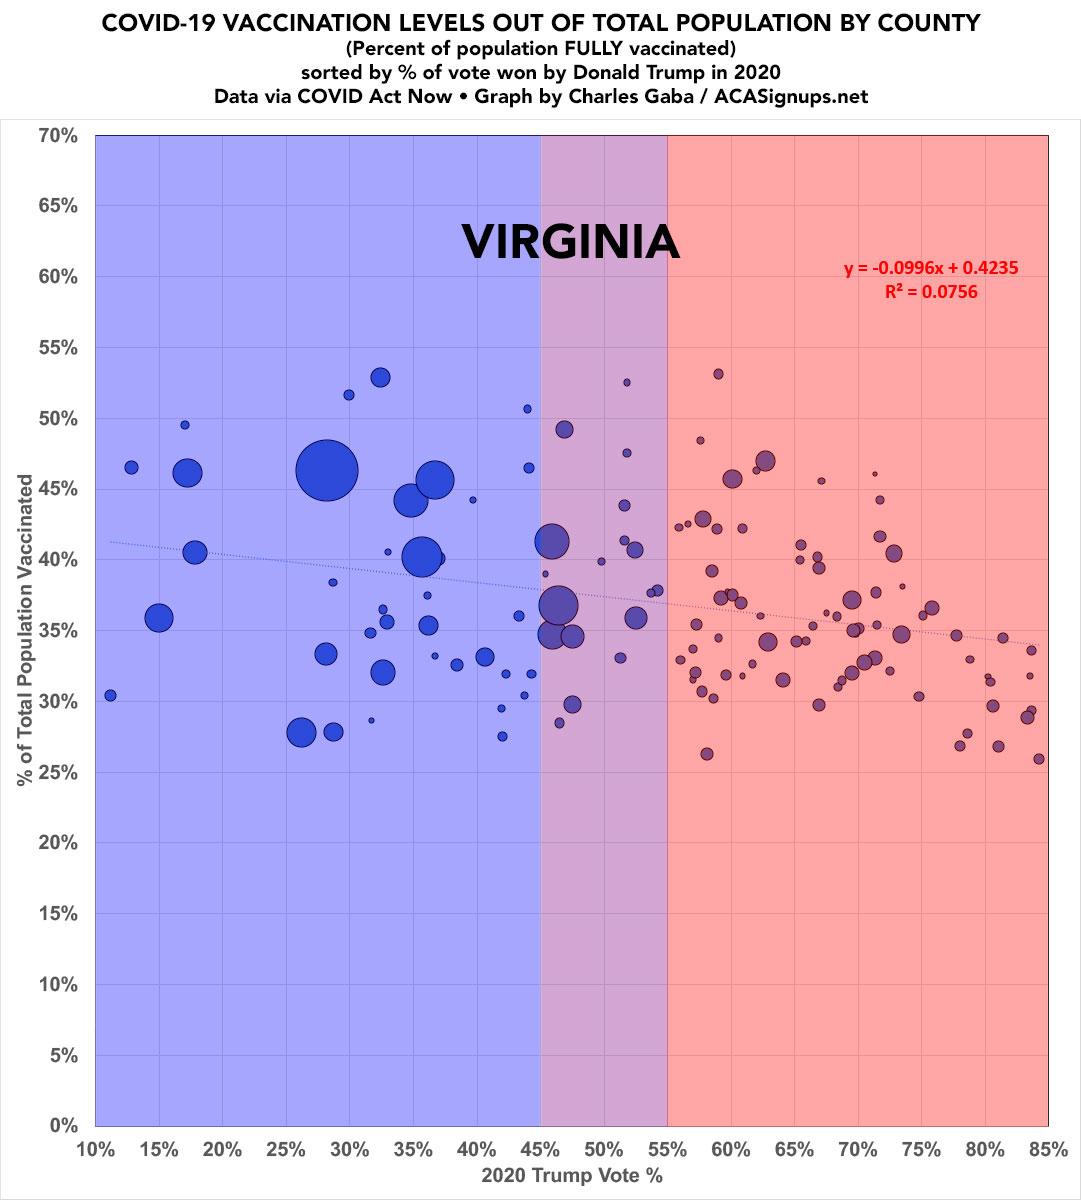
There still doesn't appear to be much of a partisan lean correlation in Virginia--it's more apparent in the "bubble view" which sizes the dots by population--but at least the numbers are accurate and make sense now, which is the main point.
Now that I've developed a standardized format/layout & methodology for tracking both state- and county-level COVID vaccination levels by partisan lean (which can also be easily applied to other variables like education level, median income, population density, ethnicity, etc), I've started moving beyond my home state of Michigan.
Here's Virginia:
- 2020 Presidential Election results via VA Secretary of State's office (thru Wikipedia)
Vaccination data via Centers for Disease Control database- Vaccination data via the COVID Act Now database & the VA COVID Dashboard
NOTE: The CDC lists ~1.895 million Virginia residents (9.6% of the total fully vaccinated) whose county of residence is unknown. In addition, there are 9 counties which don't list any vaccination data at all. Both of these could skew the trendline significantly.
Even with those factors accounted for, the Virginia graphs below are still massively out of whack with almost every other state. I don't mean because the trendline tilts slightly upwards towards the right side--New Jersey does that as well--I mean because there's massive ranges in vaccination rates across the board regardless of partisan lean, relative county population, etc. Even New Jersey still seems to form some sort of coherent pattern.
I don't know if this is a data error or what. Will update if I find out more.
Advertisement
