

New Jersey: #COVID19 vaccination rates by county & partisan lean
Tue, 06/01/2021 - 4:32am
Now that I've developed a standardized format/layout & methodology for tracking both state- and county-level COVID vaccination levels by partisan lean (which can also be easily applied to other variables like education level, median income, population density, ethnicity, etc), I've started moving beyond my home state of Michigan.
Here's New Jersey:
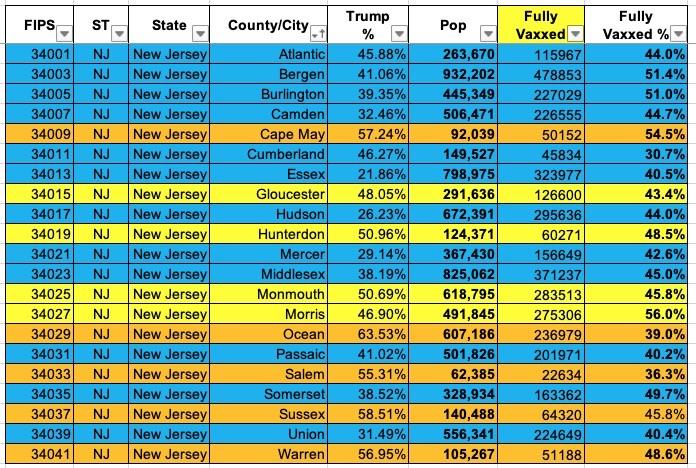
- 2020 Presidential Election results via NJ Secretary of State's office (thru Wikipedia)
- Vaccination data via Centers for Disease Control database
Note: The CDC lists ~323,000 New Jersey residents (8.1% of the total fully vaccinated) whose county of residence is unknown.
Huh. I'll have to double-check, but I believe New Jersey is the first state out of the 30 I've generated graphs for so far where the vaccination rate isn't higher in the more blue-leaning counties than the red-leaning ones. Of course, it's only an extremely slight tilt, and this is a blue state so even in the reddest county (Ocean), Trump still only received 63.5% of the vote, but it's still worth noting. NJ also has an unusually high percentage of vaccinated residents whose county of residence is unknown (over 8% of the total) which could be a factor as well.
New Jersey also happens to be the U.S. state with the highest cumulative COVID-19 death toll. I have no idea if that has anything to do with anything, but figured I should throw it out there.


Advertisement
