

Michigan: #COVID19 vaccination rates by county & partisan lean
Tue, 05/18/2021 - 5:52pm
A few weeks ago I noted that my year-long tracking of COVID-19 cases and deaths along partisan lines has proven to be very much justified, as recent headlines in major news outs have proven:
Nearly half of Republicans say they don’t want a Covid vaccine, a big public health challenge.
But more than two in five Republicans said they would avoid getting vaccinated if possible, suggesting that President Biden has not succeeded in his effort to depoliticize the vaccines — and leaving open the question of whether the country will be able to achieve herd immunity without a stronger push from Republican leaders to bring their voters on board.
‘I’m still a zero’: Vaccine-resistant Republicans warn that their skepticism is worsening
...Although more than half of U.S. adults have received at least one dose of coronavirus vaccine, more than 40 percent of Republicans have consistently told pollsters they’re not planning to be vaccinated — a group that could threaten efforts to tamp down the virus’s spread, public health officials fear.
Least Vaccinated U.S. Counties Have Something in Common: Trump Voters
...The disparity in vaccination rates has so far mainly broken down along political lines. The New York Times examined survey and vaccine administration data for nearly every U.S. county and found that both willingness to receive a vaccine and actual vaccination rates to date were lower, on average, in counties where a majority of residents voted to re-elect former President Donald J. Trump in 2020. The phenomenon has left some places with a shortage of supply and others with a glut.
As I stated, I've decided to drill down more closely into my own home state of Michigan, noting that...
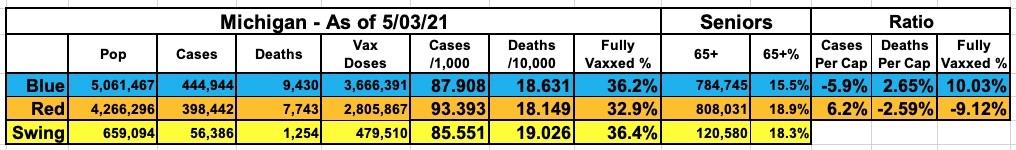
...On the vaccine front, meanwhile...yep, as of today, Michigan's handful of large Blue counties (the 12 counties which voted for Biden last fall have 55% of the population) have vaccinated 36.2% of their residents, while the other 71 Trump-voting counties have only vaccinated 32.9% of theirs.
(I should note that I'm counting the entire population of each county, not just those 16 & older, and I'm defining "% vaccinated" as the total number of doses divided by 2, then divided by the total population, since both Pfizer & Moderna require 2 shots apiece, and the single-shot Johnson & Johnson vaccine only makes up a tiny portion of the whole).
While this may not seem like much (3.3 percentage points), but that means vaccinations are running 10% higher in the Biden counties than the Trump counties. More significantly, the Red counties have 22% more senior citizens per capita. Seeing how those 65+ had something like a 3-month head start on the rest of us, all else being equal you'd expect Trump areas to be way ahead of Biden areas at this point...and yet they're 9% behind.
Here's what the gap looked like as of May 3rd:
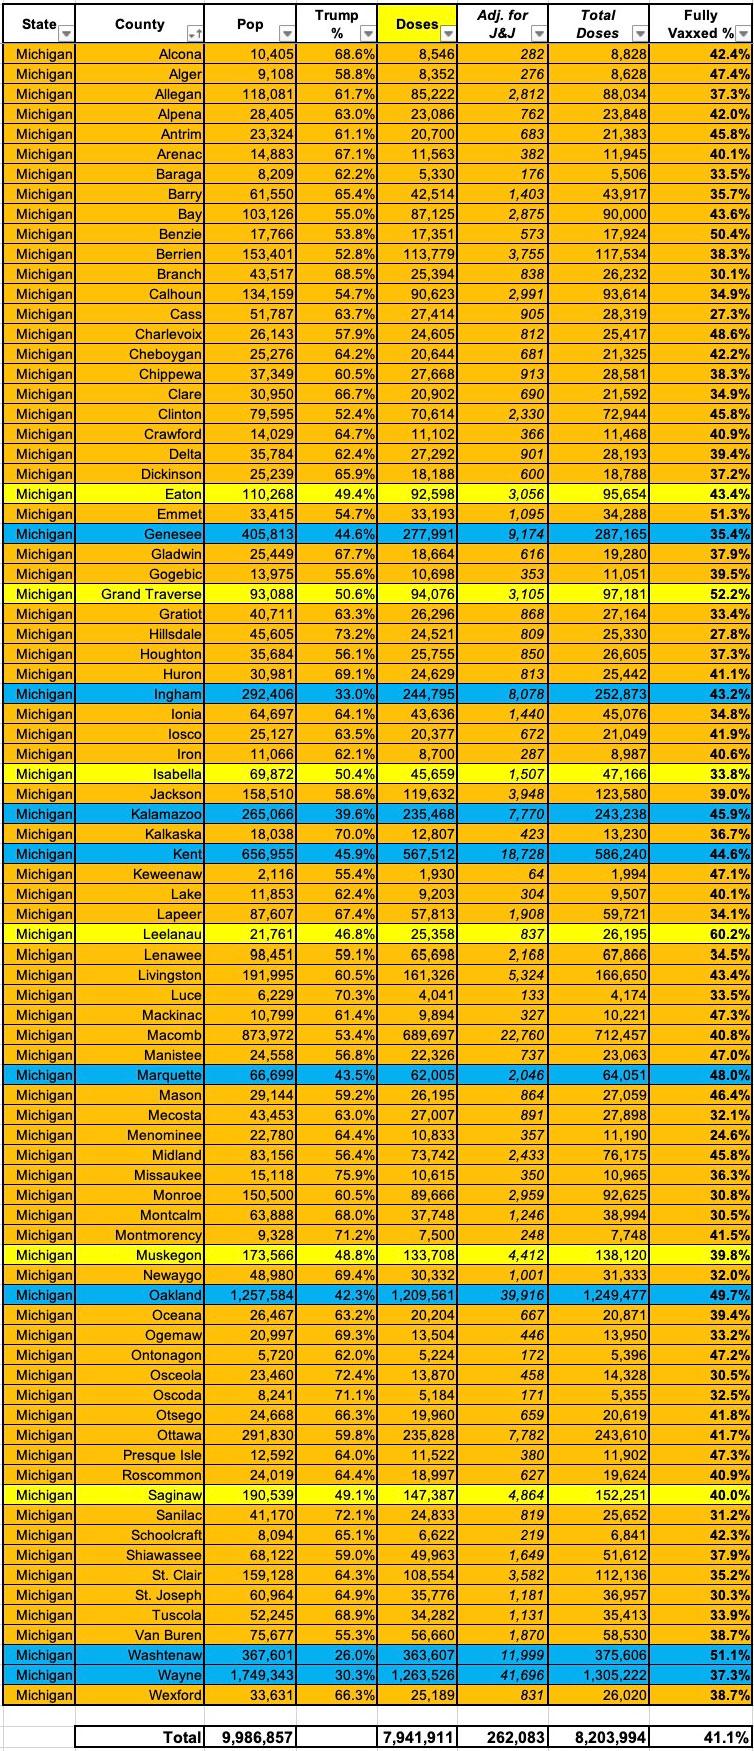
Well, it's two weeks, and Michigan's COVID-19 vaccination tracker has just been updated with data as of today, so I've plugged in the latest numbers and here's what it looks like as of May 17th (I've simplified the table a bit and am now adjusting for the ~3.5% of Johnson & Johnson vaccines):
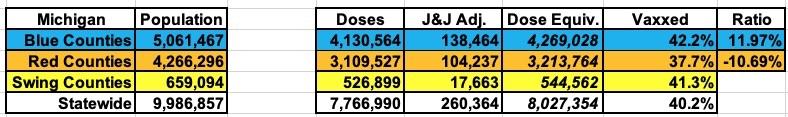
In just two weeks, the vaccination rate in Blue counties has gone from 10.0% higher to 12.0% higher.
Here's the scatter plot graph (again, I don't have the ability to size the dots by population, but believe me, the blue counties collectively have more people than the red counties):
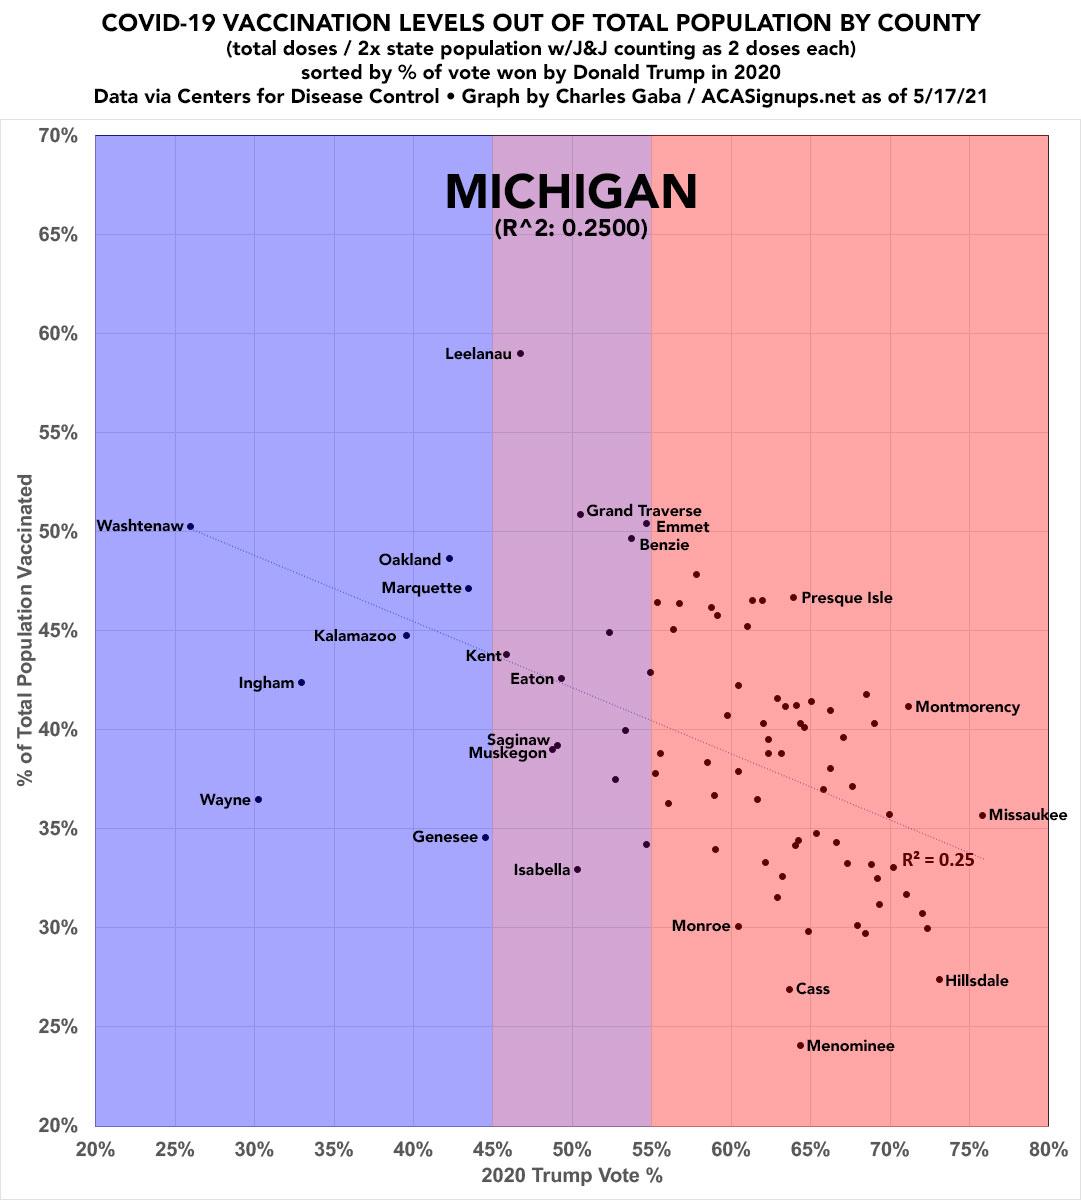
I've started including the R^2 number, which has increased over the past 2 weeks from around 0.22 to 0.25. This isn't nearly as dramatic as the 0.65 R^2 found at the national/state level, but it's still telling.
UPDATE: Here's where Michigan stands as of 5/21/21. I've also added the county-level spreadsheet as of today:

Advertisement
