

So how'd I do on the average ACA premium rate changes this year?
Thu, 04/29/2021 - 4:38pm
Every year, I spend months painstakingly tracking every insurance carrier rate filing for the following year to determine just how much average insurance policy premiums on the individual market are projected to increase or decrease, and over the years I have a pretty good track record of nailing the average unsubsidized premium changes in each state.
However, it's never going to be dead on target, for a number of reasons: Rounding errors in the rate filings, missing enrollment data, outdated enrollment data, last-minute filing changes and so forth. In some states I'm only able to find on-exchange enrollments and have to estimate the corresponding off-exchange number for each carrier; in some cases the percent changes being approved don't match from the official Uniform Rate Review Template (URRT) form to the Actuarial Filing Memo, and sometimes neither of them match up with what shows up at RateReview.HealthCare.Gov!
Even then, the estimates that I come up with in the summer/fall of each year assume that 100% of current enrollees will re-enroll in the exact same plan from the exact same carrier the following year, which of course never happens. Some people drop ACA coverage, some switch to a different plan with the same carrier, some switch to a whole new carrier, and some carriers discontinue product lines in certain counties or states entirely.
Even with all of this, I usually come out pretty close to the actual rate changes in each state as well as the nationwide weighted average...and 2021 is no exception.
The table below compares my final 2021 monthly premium estimates from last October for every state against the actual average premium being paid by 2021 Open Enrollment Period (OEP) enrollees according to the official CMS 2021 OEP Public Use File. CMS doesn't include the actual averages for 2 states (Idaho and Nevada):
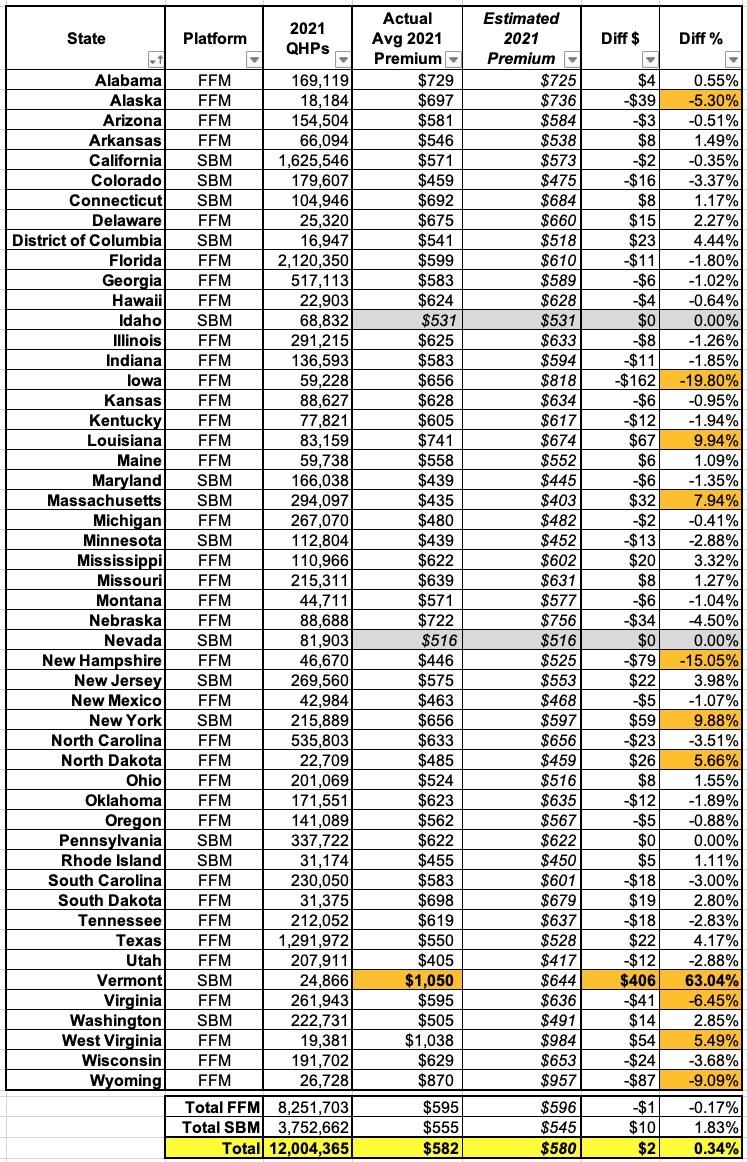
I've highlighed Idaho and Nevada in grey, and I've highlighted any other state where I was over or under by more than 5% in orange.
Vermont is a special case...I'm quite certain that the $1,050 figure included in the CMS report is an error...their premiums went up this year, but they sure as hell didn't go up that much. Oddly enough, they did the exact same thing last year as well.
Setting aside those three states, Iowa and New Hampshire's average premiums ended up being dramatically lower than I had estimated (20% & 15% respectively), while Louisiana, Massachusetts and New York increased by 8 - 10% more than I expected.
Otherwise, I came in pretty close, and nationally I was off by a mere 0.3%, which is pretty stunning given all the variables I noted above.
Utah holds the crown for lowest avg. unsubsidized premiums for the 2nd year in a row (Massachusetts had previously held the lowest position for 6 years running) at just $405/month. West Virginia remains the most expensive state in the nation for unsubsidized individual market coverage at over $1,000/month on average (again, disregarding Vermont's weird entry).
It's worth noting, of course, that the reasons for "average premiums" being higher or lower can include a lot more than certain states being "better at keeping costs down" etc. For instance, as Greg Fann reminds me, in Utah, 52% of all enrollees chose Bronze plans with another 46% choosing Silver...while only 1.1% chose Gold plans. Utah may have lower premiums, but their average deductibles are presumably quite a bit higher. On the other hand, only 5.2% of West Virginia enrollees chose Gold, but they have the highest premiums in the nation.
I should also note that Wyoming is the only state where the majority of enrollees chose Gold plans this year (which helps explain their high unsubsidized premiums). Why? Probably because insurance carriers in Wyoming have fully embraced Silver Loading to the point that anyone earning less than 250% FPL is now eligible for a FREE Gold plan statewide.
Advertisement
