

State by State: OEP 2021 vs. 2020 (updated)
Tue, 02/09/2021 - 2:19pm
(updated 2/12/21 w/final approximate data from DC & VT)
With a 3-month COVID Enrollment Period about to launch in most states (and already ongoing in a few), this is another good point to take a look at how the official 2021 Open Enrollment Period went on a state-by-state basis.
Note that the table below still, frustratingly, only includes partial data for California and no data at all for New York or Rhode Island. I hope to have final data for several of these soon, but in the meantime this is the best I can do:
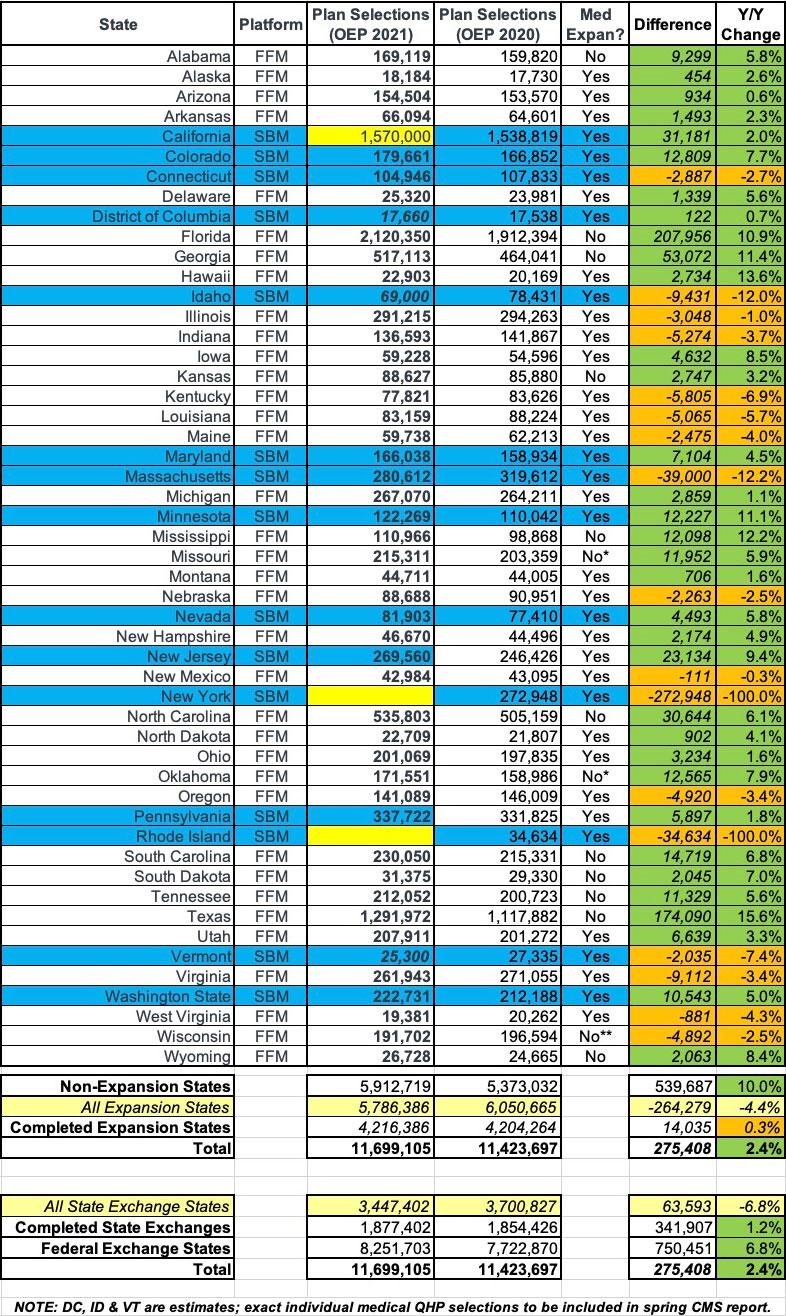
This table includes final OEP 2021 data for all 14 of the non-expansion states (Missouri & Oklahoma expanded the program last year, but it hasn't actually gone into effect in either state yet). In those states, total Qualified Health Plan (QHP) selections during Open Enrollment is up an impressive 10% vs. last year.
Of the 37 Medicaid expansion states which have expanded Medicaid, I have final OEP 2021 data for 34 of them. In those states, QHP selections are only up 0.3% vs. last year. As Andrew Sprung and I have pointed out before, the reason for this discrepancy is pretty obviously due to the 100 - 138% FPL income overlap between Medicaid expansion and APTC subsidy eligibility.
When you include all 37 expansion states, they're showing as being behind 4.4%, but of course that's meaningless given that 2 of the fields are blank and one other is incomplete. Assuming New York and Rhode Island come within 5% of their 2020 OEP enrollment, and assuming California tacked on, say, another 100,000 enrollees in January (the number above only runs through 12/30/20), that would bring the expansion states up to around 6.18 million, or perhaps 2.1% above last year. This would also bring the grand total up to around 12.1 million nationally.
In non-expansion states, people in that income range aren't eligible for Medicaid...but are eligible for heavily-subsidized ACA exchange plans. In expansion state, it's the opposite, so anyone who saw their incomes fall below the 138% FPL range due to losing their jobs and/or an income drop shifted off of exchange plans entirely.
Similarly, the 36 states on the federal exchange (complete) are up 6.8% year over year, while the completed state-based exchanges are only up 1.2% vs. last year so far. Again, assuming NY & RI come in at 95% of 2020's total and CA tacked on another 100K or so, the state exchanges should be up around 3.7% in the end. There's a heavy correlation between Medicaid expansion and having a state-based exchange for obvious reasons (both tend to be favored by states which are heavily supportive of the ACA), so this isn't surprising either.
Advertisement
