

State by State: OEP 2021 vs. 2020
Wed, 01/27/2021 - 12:35pm
I just realized that while I've broken out state-level 2021 Open Enrollment data between Medicaid expansion & nonexpansion states, I haven't posted the state-level 2021 vs. 2020 data in a single table yet, so I'm rectifying that today. Note that this still only includes partial data for 5 states (CA, DC, MA, NJ & WA) and no data at all for 3 others (NY, RI, VT).
For that matter, Open Enrollment is still ongoing in either 5 or 6 states (Maryland depends on your POV...they ended OEP in December but re-launched it a few weeks ago in response to the COVID-19 pandemic).
While the data below is incomplete, this seems like a good time to see where things stand given that President Biden is widely expected to announce a re-launch of Open Enrollment tomorrow.
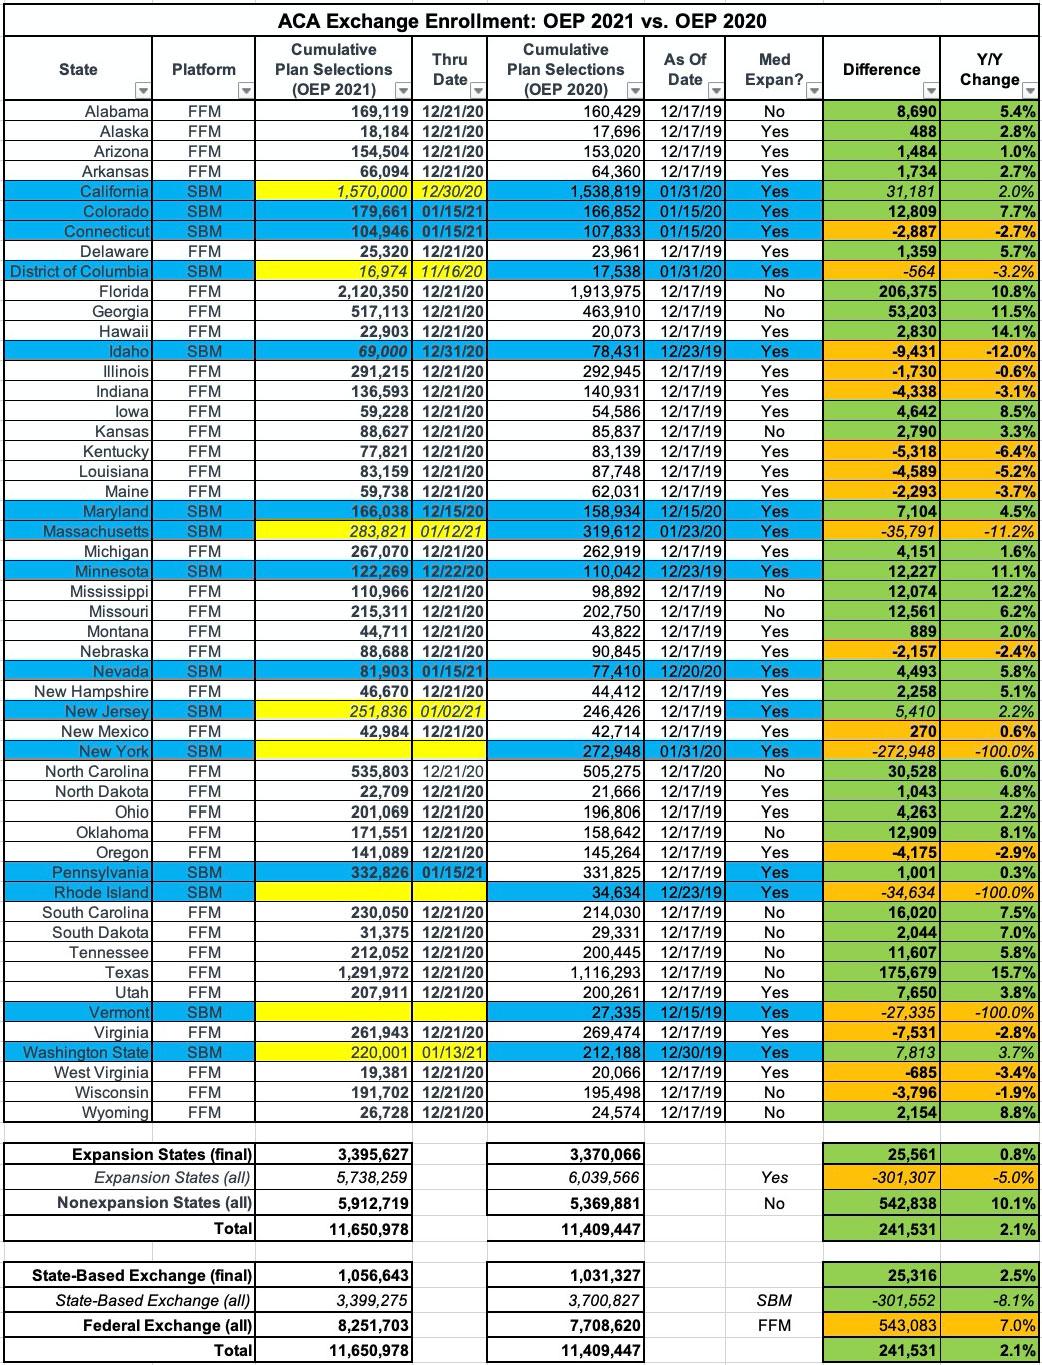
This table includes final OEP 2021 data for all 14 of the non-expansion states (Missouri & Oklahoma expanded the program last year, but it hasn't actually gone into effect in either state yet). In those states, total Qualified Health Plan (QHP) selections during Open Enrollment is up an impressive 10% vs. last year.
Of the 37 Medicaid expansion states which have expanded Medicaid, I have final OEP 2021 data for 29 of them. In those states, QHP selections are only up 0.4% vs. last year. As Andrew Sprung and I have pointed out before, the reason for this discrepancy is pretty obviously due to the 100 - 138% FPL income overlap between Medicaid expansion and APTC subsidy eligibility.
In non-expansion states, people in that income range aren't eligible for Medicaid...but are eligible for heavily-subsidized ACA exchange plans. In expansion state, it's the opposite, so anyone who saw their incomes fall below the 138% FPL range due to losing their jobs and/or an income drop shifted off of exchange plans entirely.
Of course, those 29 states only represent a little over half of the enrollments in the expansion states; the 9 with partial/missing data include big ones like California and New York, so those could shift these numbers significantly once the final data is in.
The table above also sums up the Federal Exchange vs. State-Based Exchange divide. HealthCare.Gov has seen total enrollment drop each year since 2016...until now. QHP selections via the federal exchange are up 6.8% over last year after accounting for New Jersey & Pennsylvania splitting off onto their own exchanges this year.
Meanwhile, of the 7 state-based exchanges with final data published, 2021 OEP enrollment is only up 2.5%, although again, these states only represent 28% of of total SBE enrollment; the other 8 SBE states only have partial data or none at all.
Advertisement
