

Weekly Update: Which COUNTIES have the highest per capita rates of #COVID19 cases and fatalities?
Sun, 06/28/2020 - 10:21am
Now that I've brought all 50 states (+DC & the U.S. territories) up to date, I'm going to be posting a weekly ranking of the 40 U.S. counties (or county equivalents) with the highest per capita official COVID-19 cases and fatalities.
Again, I've separates the states into two separate spreadsheets:
Most of the data comes from either the GitHub data repositories of either Johns Hopkins University or the New York Times. Some of the data comes directly from state health department websites.
Here's the top 40 counties ranked by per capita COVID-19 cases as of Saturday, June 27th:
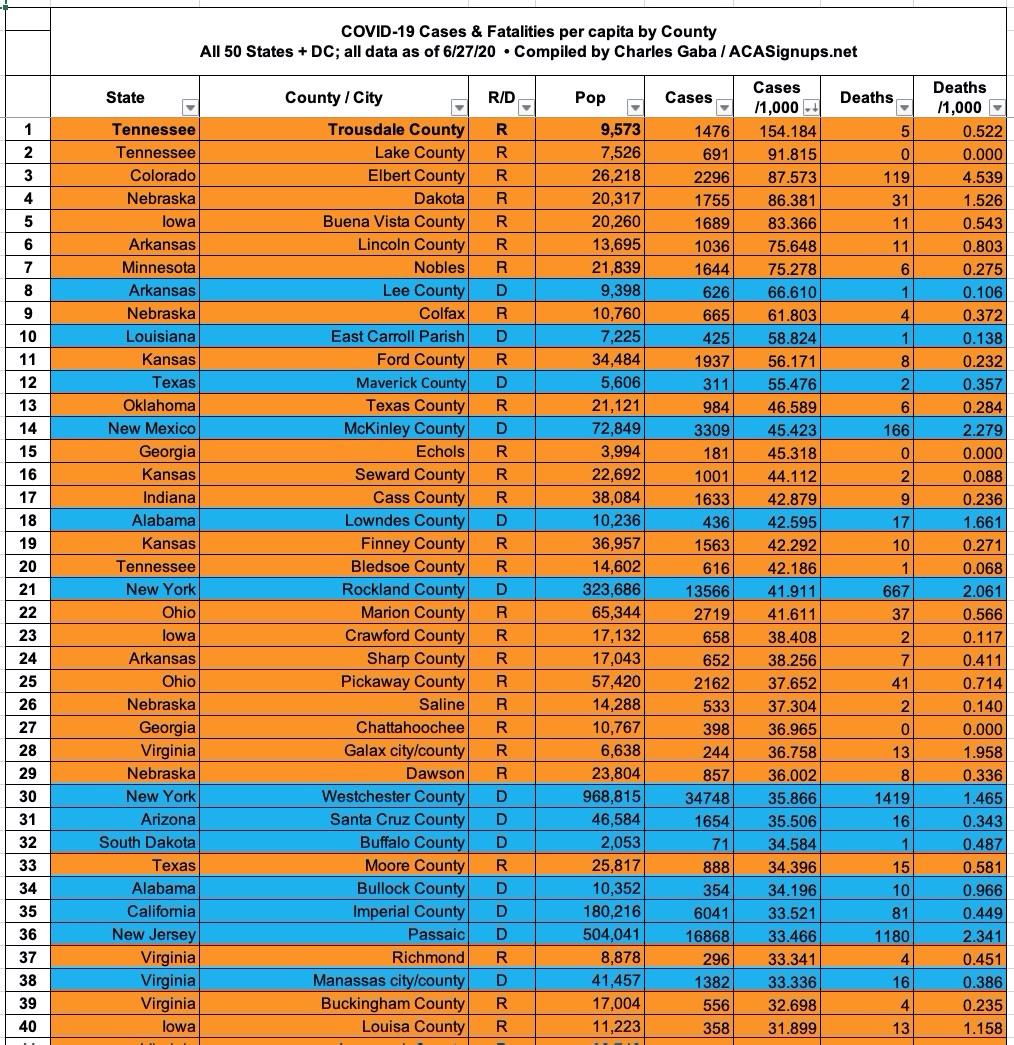
There's still clear disconnect between the counties with the highest rates of infection and the ones with the worst mortality rate. 15 of the 20 counties with the highest rate of infection are low-population rural counties which voted for Donald Trump...and four of the other five are in states Trump won by wide margins (Alabama, Arkansas, Louisiana and Texas). No county in New York even makes the top 20 anymore.
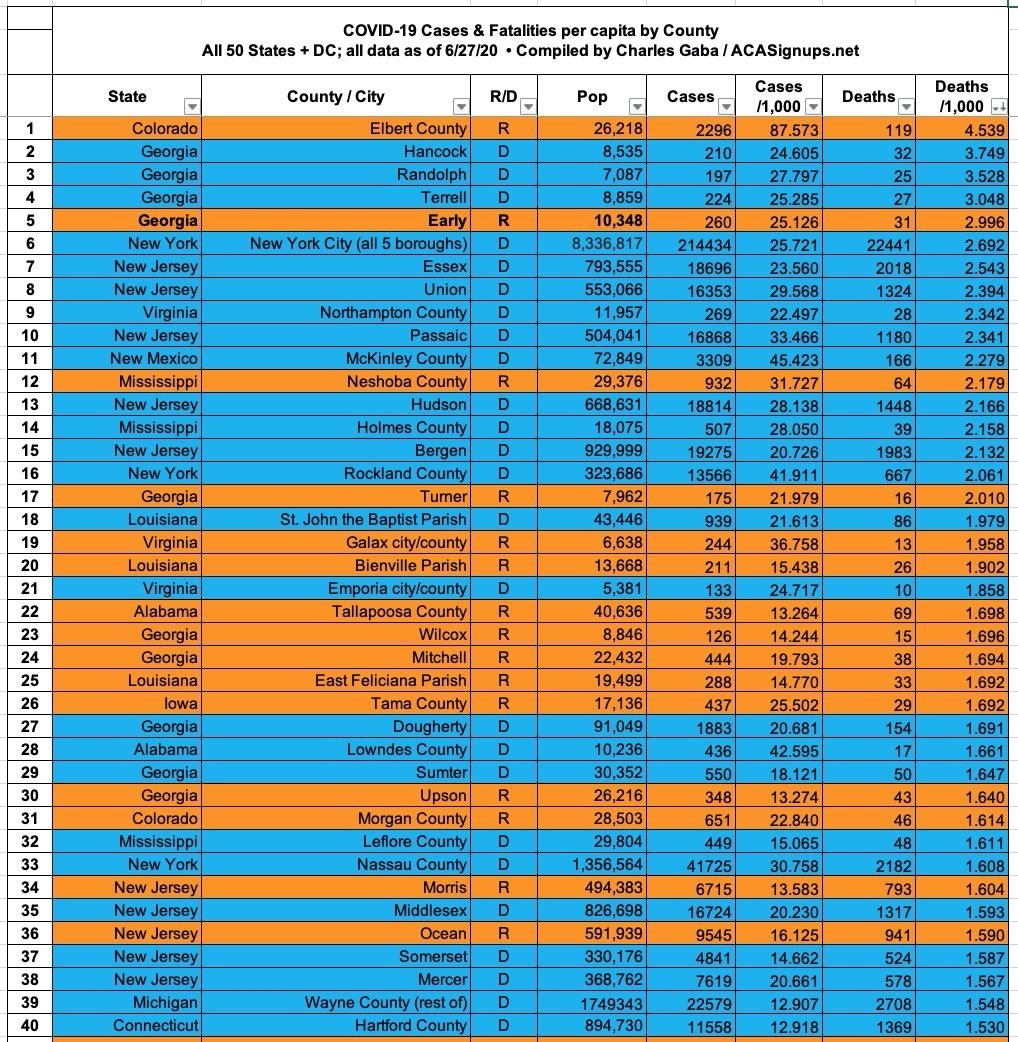
On the other hand, as you can see below, 14 of the 20 counties with the highest COVID-19 mortality rates voted for Hillary Clinton. It's actually more like 17 out of 20, since both the NY Times and John Hopkins University data files lump all 5 New York City boroughs (which are actually counties) into a single listing. Four of the five are solid blue (the exception is Richmond County, aka Staten Island).
Setting political lean aside, while it's not exactly news that New York and New Jersey hold multiple top spots, it's noteworthy that four of the five deadliest COVID counties are located in Georgia. In fact, 10 of the top 40 are Georgia counties regardless of red or blue status.
Here's the top 40 counties ranked by per capita COVID-19 fatalities as of Sunday, June 27th:
Advertisement
