

Weekly Update: Which COUNTIES have the highest per capita rates of #COVID19 cases and fatalities
Mon, 05/25/2020 - 12:02am
I've made major progress in updating and revising my breakout of COVID-19 cases and fatalities at not just the state level but the county level. Again, I've separates the states into two separate spreadsheets:
Most of the data comes from either the GitHub data repositories of either Johns Hopkins University or the New York Times. Some of the data comes directly from state health department websites.
I hope to fill in the back-data for every state within the next few days, bringing them all up to date. This should allow for plenty of interesting analysis of trends and counties to keep an eye on. It will also allow me to get back to posting more regular ACA policy updates/etc.
Here's the 25 counties with the highest official per capita rates of COVID-19 cases and fatalities as of Saturday, May 23rd:
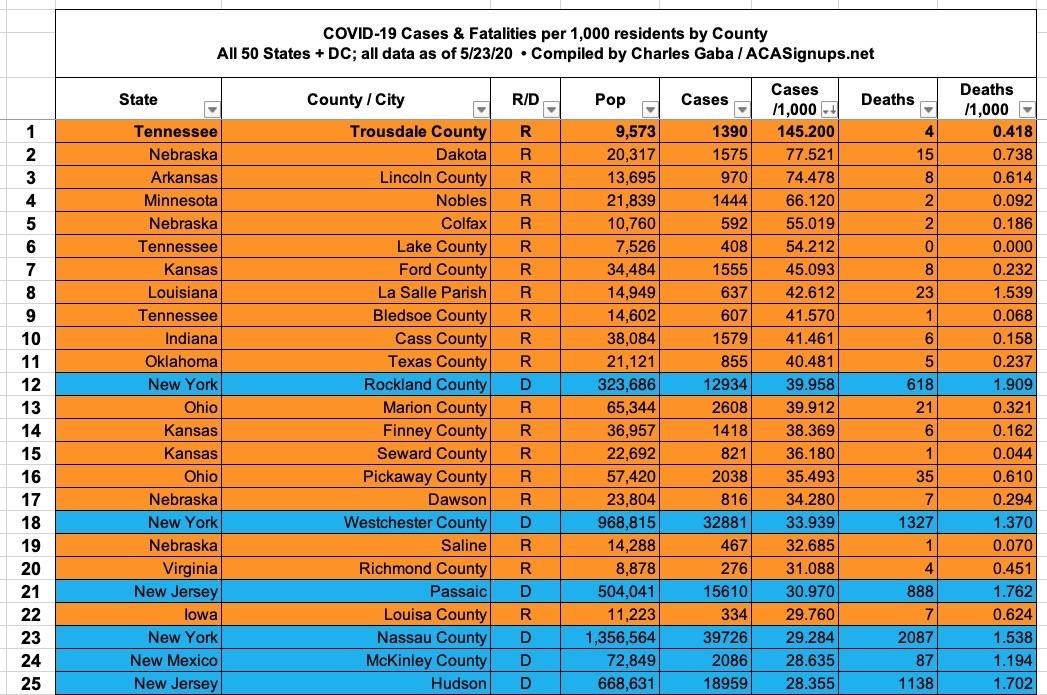
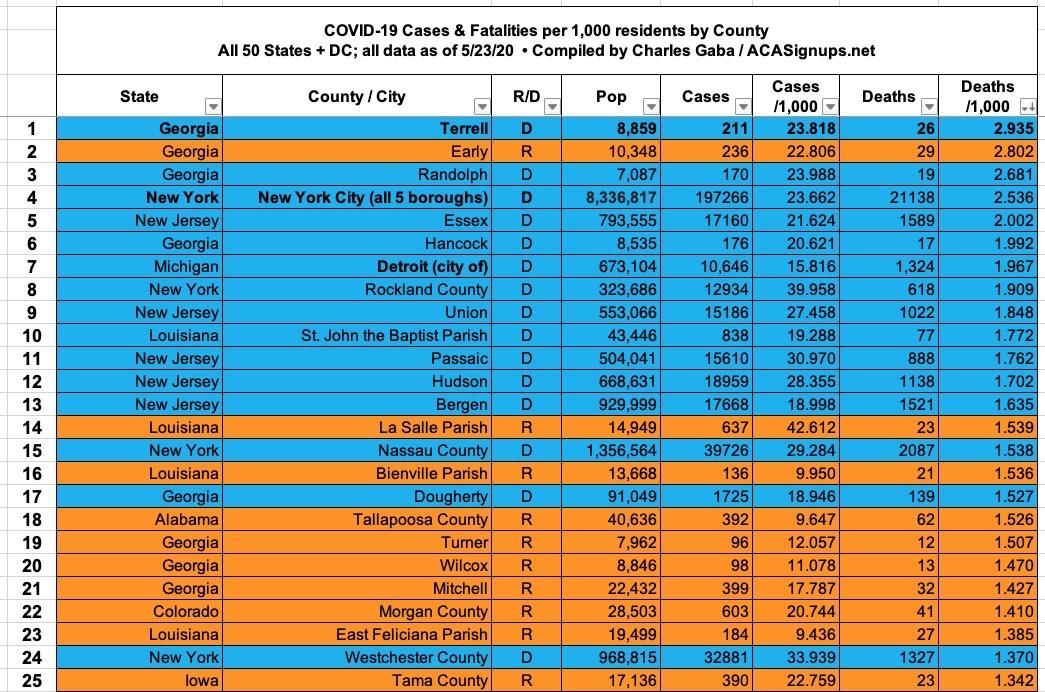
There's a clear disconnect between the counties with the highest rates of infection and the ones with the worst mortality rate. All 10 of the counties with the highest rate of infection are low-population rural counties which voted for Donald Trump, as are 19 of the top 25. On the other hand, 9 of the 10 counties with the highest COVID-19 mortality rate voted for Hillary Clinton, as are 15 of the top 25. It's actually more like 19 of the top 25, really, since both the NY Times and John Hopkins University data files lump all 5 New York City boroughs (which are actually counties) into a single listing. Four of the five are solid blue (the exception is Richmond County, aka Staten Island).
Setting political lean aside, while it's not exactly news that New York, New Jersey (and Detroit) hold multiple top spots, it's noteworthy that four of the top six deadliest COVID counties are located in Georgia. In fact, 8 of the top 25 are Georgia counties regardless of red or blue status.
Advertisement
