

Full ACA repeal would screw 16 million in Clinton country and 10 million in Trump country.
Wed, 03/29/2017 - 1:01pm
There's been a lot of talk, by myself and others, about just which populations would be screwed over by a full repeal of the Affordable Care Act. Analysts, reporters and pundits have sliced and diced the numbers every which way...by race, income level, geography and of course political leanings.
Of course, this gets awfully messy right out of the gate because some ACA provisions apply to everyone in the country, such as the cap removal on annual/lifetime coverage limits; the reassurance that you can't be denied coverage for having pre-existing conditions (which applies to those covered by employer insurance as well, I should note, since many of them may have to switch jobs or be without one at some point in their lives), and so on. Other benefits apply to subgroups which aren't talked about much, such as the Medicare fund being extended by years and the Medicare Part D "donut hole" being closed.
However, for the most part, analysis of this nature is referring to three very specific groups: The ~12.2 million ACA exchange enrollees, the ~15 million (or ~13 million...see below) ACA Medicaid expansion enrollees and the 760,000 enrolled in the Basic Health Programs in Minnesota and New York (I seem to be the only one who ever remembers to include these folks). Since around 10% of exchange enrollees never actually pay their first premium, the actual total is somewhere around 26.8 million people nationally (in my earlier County/Congressional District analysis, I reduced the total further still by removing those not receiving any tax credits at all or only nominal ones, bringing it down to around 24 million).
How about politically? How many of those at risk voted for Hillary Clinton (ie, to save the ACA) vs. how many voted for Donald Trump (ie, to repeal the ACA and rip away their own coverage, whether they "knew" that's what they were doing or not)?
Back in November, I posted a piece over at healthinsurance.org which tried to answer this question at the state level. It wasn't a particularly deep analysis, and my takeaway was that somewhere between 4-9 million Trump voters likely voted to shoot themselves in the foot, so to speak (or at least voted to leave themselves crippled for life if they did get shot). The rest, presumably, either voted for Hillary Clinton, a third party or in many cases didn't vote at all. However, this was obviously a pretty sloppy, back-of-the-envelope way of doing it.
But here yet another problem intrudes: Such a course of action could end up hurting a lot of Republican and Trump voters. By encouraging insurers to exit the marketplaces, it could leave many of the 12 million people who have obtained coverage on the individual markets with no remaining options — no way to get coverage or to access subsidies to cover that coverage. And Larry Levitt, a senior vice president at the Kaiser Family Foundation, tells me that this would hurt marketplaces in all regions of the country, which means deep red Trump territory, too, particularly because some of that includes rural areas where there are fewer insurers.
“Trump country tends to be areas where there’s less competition,” Levitt says.
Right on cue, Julia Belluz of Vox.com posted the following piece today, which notes:
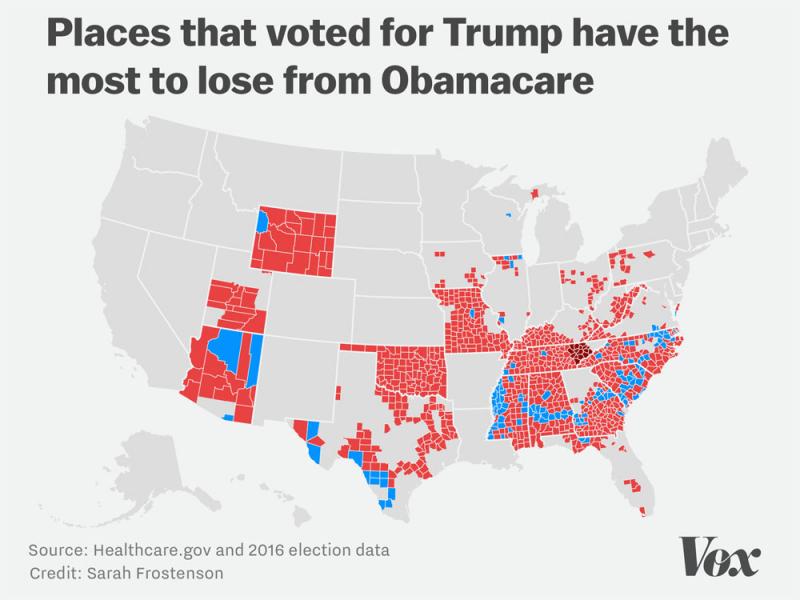
If Trump sabotages Obamacare, rural America will suffer the most
These are the patients most at risk.
...Of the nearly 1,000 counties with only one insurer in 2017 (which is probably true of 2018 as well), 87 percent voted for Trump. And the 16 counties in dark red are the counties in Tennessee without a single insurer.
I decided to take this one step further by comparing the results of the 2016 Presidential election agains the number of ACA exchange enrollees, BHP enrollees (MN/NY only) and Medicaid expansion enrollees in every county to see how the numbers break out by who won each county.
And then...I placed it all in a Google Docs spreadsheet.
(Thanks to the folks at The Guardian and townhall.com, along with Tony McGovern for providing the county-level election data in downloadable format)
Now, there's a few important caveats:
- Due to some data glitches and uncertainty about some county-level numbers, I wasn't able to include 5 states: Alaska, Colorado, Connecticut, Rhode Island and Vermont. Given the states in question AK = Red; CO = Purpls; CT/RI/VT = Blue), I tried to adjust for this at the bottom of the spreadsheet by assuming roughly 80% of the missing exchange enrollees are in Clinton counties, along with about 65% of the Medicaid expansion enrollees.
- To keep the spreadsheet less unwieldy, I've lumped the BHP enrollees in Minnesota and New York in with the exchange enrollment columns. I debated whether to include these with Medicaid instead, but BHP enrollees mostly have incomes between 138 - 200% of the Federal Poverty Line, meaning that they're "cannibalizing" the exchange population, not Medicaid expansion.
- There's some data glitches buried somewhere in the Medicaid column of the spreadsheet which caused the Medicaid expansion totals at the bottom to be nearly 400,000 too high nationally. It took a lot of work to get it this far, and this doesn't change the overall conclusion by more than a percent or so, so I'm not going to try and track it down at this point.
- In addition, as noted above, due to around 10% of exchange enrollees never paying up (and thus never being enrolled at all) and other attrition factors, the exact numbers are a bit fuzzy, so let's just say that each of the totals is accurate to within plus or minus 100,000 people.
- Finally: I had to think carefully about the best way to word the title of this entry. I can't say "10 million Trump voters", since there's no way of proving a direct correlation. Remember that even the grand total (27 million) is much smaller than the total number of votes cast...and for all I know, many of the exchange/BHP/expansion enrollees didn't vote at all. Furthermore, many of the counties were only won by Clinton or Trump by a bare minimum, so who knows what the voter split among the enrollees there actually was? All this study measures is where these particular people live, not who they specifically voted for.
What I can say with a high level of confidence is this:
- Of the ~13 million exchange + BHP enrollees nationally, around 7.6 million live in counties won by Hillary Clinton. The other 5.4 million live in counties won by Donald Trump. Knock off about 10% to account for non-payments and it's roughly 6.8 million and 4.9 million respectively.
- Of the ~15 million Medicaid expansion enrollees nationally, around 9.7 million live in Clinton counties, 5.2 million in Trump counties.
- Add these up and that's around 16.5 million living in Clinton counties, 10.1 million in Trump counties.
I admit to being a bit surprised by this, although there are three major factors which help account for it somewhat:
- Officially the total Medicaid expansion population is around 13 million...but there are ~2 million more in New York who are covered via pre-ACA expansion waivers which have since expired...meaning that if the ACA is repealed, they get kicked off Medicaid as well. The question of whether to include these folks or not is up for debate, but the bulk of them live in blue counties. Subtract them and the "gap" is lowered (to perhaps ~15.0 million / ~9.6 million)
- The only two states which are participating in the BHP program happen to be Democratic ones...Minnesota and New York...so it's not surprising that they would skew heavily blue. Again, remove the 760K BHPs from these states and the gap drops somewhat further.
- The much smaller Medicaid number may seem surprising given how many Trump voters live in poor/rural areas...until you remember that 19 states haven't expanded Medicaid at all, 15 of which are pretty solid red (the other 4 are "blue" Maine and "purple" Florida, Virginia and Wisconsin). Kaiser Family Foundation estimates around 2.6 million people caught in the Medicaid Gap across these 19 states, which include deep red ones like Texas, Oklahoma, South Carolina and so forth. My guess is that ~80% live in Trump counties, which would bring "her" tally up another 500K to roughly 17 million and "his" total up another 2.1 million, or 12.2 million total. In addition, Kaiser estimates there's roughly 1.4 million people with incomes between 100-138% FPL who are uninsured but eligible for heavily-subsidized exchange plans in those 19 states; if those states expanded, these folks would also be eligible for Medicaid. Again, assuming an 80/20 Trump/Clinton county split, "her" county total would increase to around 17.3 million and "his" to around 13.3 million. That's pure speculation, of course.
So, what does this all tell us?
Well, Republicans would probably claim this somehow "proves" that the ACA "only helps Clinton voters anyway!" since "her" number is higher...but that ignores the fact that regardless of how high the "Clinton county" number is, the fact remains that over ten million people living in counties which voted for Trump are at risk of losing coverage.
When you combine that with the fact that 87% of the counties with only a single exchange carrier (or none whatsoever) also voted for Trump, the threats of either outright repeal or sabotage (by scaring off carriers) is very real for a lot of his supporters as well.
Advertisement
