

Yes, I'm updating the "How Many Could Lose Coverage..." tables, but it'll take some time.
Wed, 03/15/2017 - 1:14pm
As I noted earlier today, CMS has released the official 2017 Open Enrollment Period report, along with a whole mess of State, County and Zip Code-level breakouts and related demographic information, including APTC/CSR recipients, Metal Levels, Income Levels and so on.
This means I now have to dive back into my "How Many Could Lose Coverage?" project and update/revise the numbers for every state, county and Congressional district. Fun times!
On the one hand, this will take some time, so please bear with me. It took nearly 2 months to compile this data for all 50 states; it might take another week or so to update them with the latest numbers. Also note that it may only be the 39 states on the federal exchange which get updated, unless some of the state-based exchanges release their own updated reports.
On the other hand, it's important to note that for most counties/congressional districts, the numbers are likely to be fairly close to where they already are. For example, I've already completed Michigan; here's a before/after comparison:
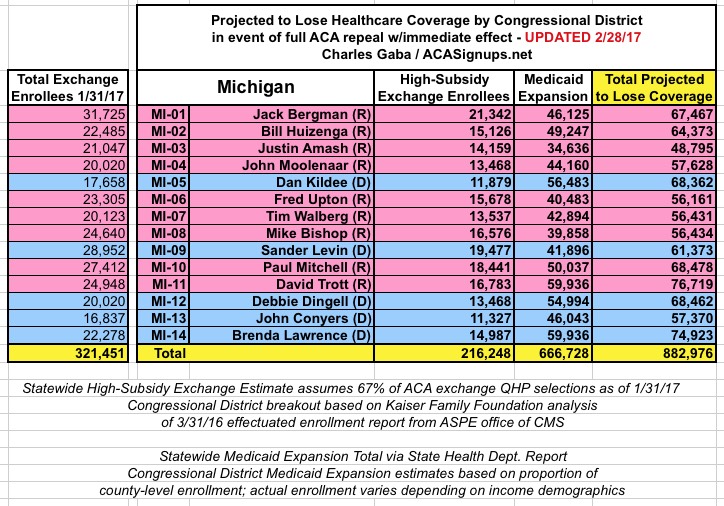
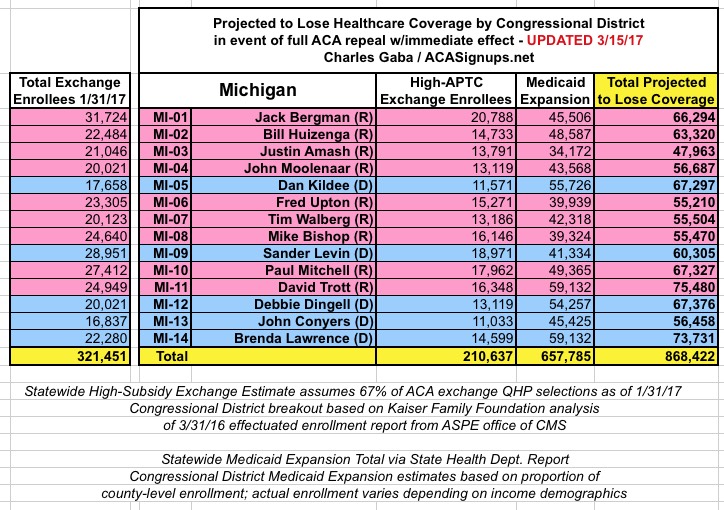
As you can see, the changes are pretty nominal. The High-APTC (Subsidized) number is about 6,000 lower, while the Medicaid expansion number is about 8,000 lower, for a statewide total of around 868,000 vs. 883,000. The individual district numbers are slightly lower accordingly.
In some states the numbers will be slightly lower, in others they may be higher. The national total is still around the 24 million mark, however.
More to come...
Advertisement
