

Week 5 & 6 Snapshot: 4.02M QHPs thru 12/10 (I was off by 0.4%)
Wed, 12/14/2016 - 2:05pm
...There's a simple reason for this: When I whipped up this year's Graph, I forgot to take into account that November 1st fell on a Tuesday this year instead of a Sunday. Since enrollments tend to drop off substantially on weekends, this means that the slowdown comes 2 days earlier each week. For most weeks this is barely visible on the Graph, but this week in particular it can make a huge difference...up to a couple hundred thousand people per day.
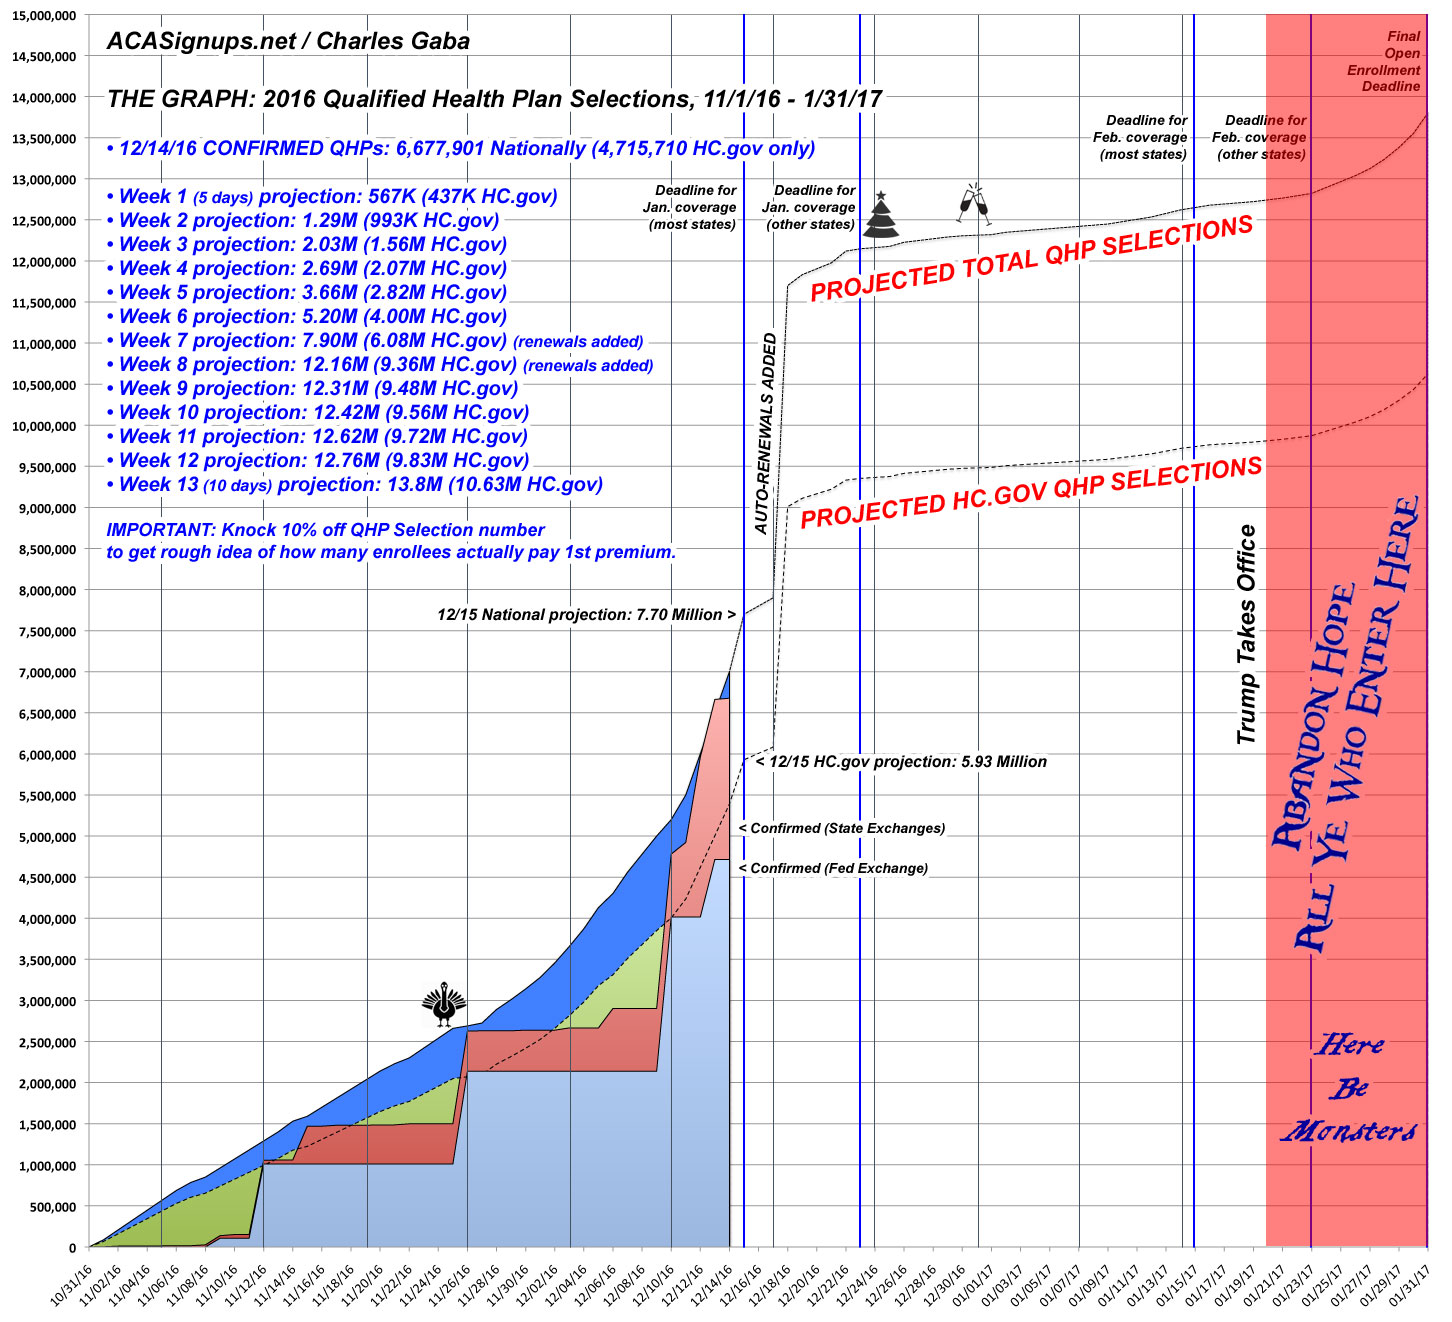
In addition, normally CMS officially adds several million auto-renewals in a big lump sum around December 17-18th. Since those dates also fall over the weekend this year, I'm assuming they'll all be plugged in at once on Monday the 19th, resulting in an even more dramatic vertical line shooting up on that date.
With these tweaks in mind, here's what The Graph now looks like. Again, I haven't changed my key deadline projections, just the day-to-day flow within the current week or so.
CMS should be releasing their Snapshot Report for Weeks 5 and 6 tomorrow; with this revision, I now expect that report to show roughly 4.0 million QHP selections across the HC.gov states as of 12/10/16.
WEEKS 5 AND 6, NOV 27 – DEC 10, 2016
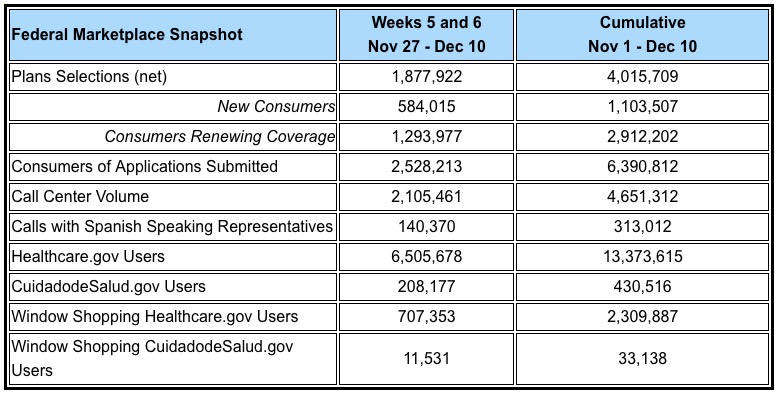
Heading into the final days before the December 15 deadline for January 1 coverage, millions of Americans are coming to HealthCare.gov and signing up for Health Insurance Marketplace plans, demonstrating the strong demand for quality, affordable coverage. As of December 10, over 4 million people had selected plans using HealthCare.gov since Open Enrollment began November 1, including over 1.1 million new consumers and 2.9 million renewing their coverage.
Since December 10, sign-up activity has accelerated. With the December 15 deadline for January 1 coverage approaching, the last two days – Monday, December 12 and Tuesday, December 13 – have been two of the biggest days of any Open Enrollment, with more than 700,000 sign-ups.
...This report covers the period from November 27 through December 10, 2016. In addition to national and state-by-state data, today’s snapshot is the first this year to include plan selection estimates for top local markets in states using HealthCare.gov.
As in past years, enrollment weeks are measured Sunday through Saturday. Since Open Enrollment began on a Tuesday this year, the cumulative totals reported in this snapshot reflect two fewer days than last year’s Week 6 snapshot. There were over 250,000 more plan selections during the first 40 days of Open Enrollment this year than last year.
OK, so the total number is almost precisely what I expected it to be after correcting for the 2-day weekend shift. Yay, me!
The new enrollee factor is still concerning, although the issue isn't as bad as it had been in the first four weeks:
One important item to keep an eye on is the percent of new enrollees versus renewing enrollees. These are still holding at around 24% of the total 4 weeks in. This is significantly lower percent-wise than last year's 35%, but some of that makes sense since the new enrollees are being added to a larger existing base. In raw numbers, it's still lower, however: Last year there were 714,000 new enrollees added to the federal exchange in the first 4 weeks; this year it's 519,000, about 27% fewer new additions.
So, compared to last year:
- After 4 weeks: 35% new last year / 24% new this year
- After 6 weeks: 36% new last year (thru 12/12) / 27.5% new this year
In raw numbers, at this point last year around 1.50 million new enrollees vs. just 1.10 million this year. However, again, this week in particular, that 2-day difference is crucial. As noted in the snapshot report, they had over 700,000 people sign up on the 12th and 13th. Unfortunately, they don't say how many enrolled on the 11th, nor do they break out the 12th & 13th separately, but seeing how things have been pacing almost precisely how I expected so far, I can use that as a guideline.
My revised projections from yesterday for this week were:
- 12/11: 250K
- 12/12: 350K
- 12/13: 400K
...which is fairly close. Assuming that 27.5% new enrollee ratio stayed consistent on the 11th & 12th, that would mean another 160,000 new enrollees, bringing the total up to 1.26 million. Still about 16% fewer new additions than last year at the same point.
I should also note that my projections for the 12th & 13th specifically (350K + 400K = 750K) are slightly ahead of what CMS just reported ("over 700K") for those two days. This also suggests that my 250K estimate for Sunday is a bit high as well; it was likely more like 230K. However, without knowing the actual number from the 11th, I can only report a confirmed total of just over 4.7 million for HC.gov.
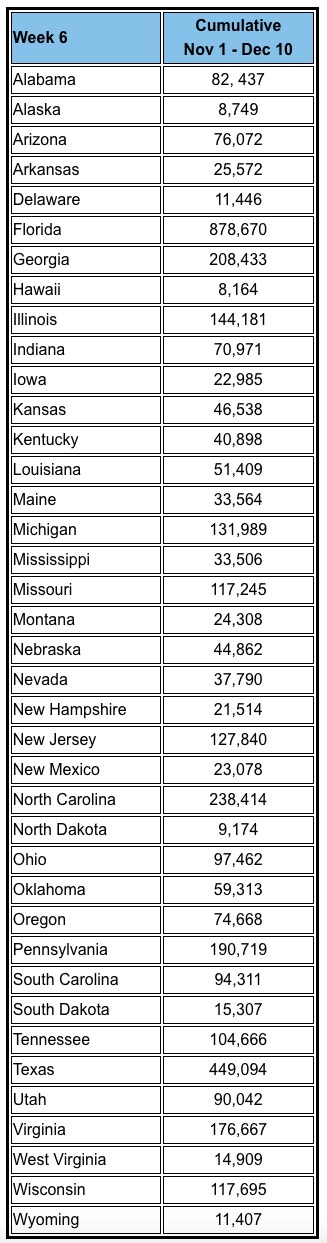
Here's the state-by-state breakout (only runs through the 10th, of course):
Advertisement
