

Avg. UNSUBSIDIZED Indy Mkt Rate Hikes: 25% (49 states + DC)
Sun, 08/14/2016 - 5:47pm
UPDATE 10/27/16: See below for FINAL update (for real!)
UPDATE 10/19/16: As you can see, I've locked in the approved weighted average rate hikes for 40 states plus DC, leaving 10 states to go. I do plan on filling in the remaining approved rate hikes as the data for those 10 states comes in, but at this point it's quite clear that 25% is the magic number. The weighted average has been hovering between the 23-26% range since the first few approvals started being publicized in mid-August, and has stabilized in the 24-25% range for the past month. Over 77% of the total U.S. population is represented by these 40 states (+DC); unless there's some dramatic final rate changes in the remaining 10 states, that national 25% average isn't likely to budge by more than a rounding error.
As proof of this, I assumed that the requested rate hikes are approved exactly as is for all 10 states.
Result? The national, weighted average rate hikes went from 25.25%...to 25.36%.
But what if the largest missing state, Texas, were to go from an already-ugly 38.1% requested hike to, say, ten points higher (48.1%)? Well, that would only bump the national average up to 26.3% overall. In fact, even if all 10 states come in 10 points higher than their requests, the net effect would only be to push the national average up to 27.5%. Of course, if any of the states have their requests trimmed by a point or two, that would have the opposite effect.
In short, barring any dramatic last-minute development in one or more large states, nationally speaking, 25% is where unsubsidized, ACA-compliant individual market rate hikes are for 2017. With the 2017 Open Enrollment Period bearing down upon us at breakneck speed, it's time to close the books on this project and move on to the original purpose of this website: Tracking the actual enrollment numbers.
NOTE: Scroll down for updates as more states are added to average.
After I posted my "I'm Calling It!" post last week re. the 2017 requested rate hikes for the ACA-compliant individual market, I noted that since I originally crunched the numbers for some states as far back as April, the situation in some states has likely changed somewhat due to carriers dropping out, joining in or re-submitting their rate request filings.
Since it would take 10x as much time as it does now (which is already a lot) to recreate the tables and graphs every time there's a change, I've been holding off on doing so until I've accounted for several states...which is what I'm doing here.
There have been significant changes to the requested rate filings in at least four states: Arizona, Connecticut, Maryland and Tennessee. In all four cases, I'm afraid the statewide weighted average has increased, either due to resubmitted filings, a carrier dropping out or both.
As a result of these updates, the national average increase requested now stands at 23.9%, up from the previous average of 23.3%.
Normally an increase of just 0.6 percentage points wouldn't be enough for me to write up a full post, but there's a second new feature I'm adding today as well: APPROVED rate hikes. At least 5 state insurance departments/commissioners have now signed off on their approved rates for 2017 individual market policy rates, which is enough for me to start plugging in the approved rate data: Mississippi, New York, Oregon, Rhode Island and Vermont. Of course, several of these states are pretty small; combined all 5 only make up around 6.3% of the total population...the numbers will no doubt jump around quite a bit as additional, larger states are plugged into the mix.
As I keep reiterating, there are many caveats to these "statewide weighted averages":
- Off-exchange policies are included whenever possible, but only if they're ACA-compliant (grandfathered/transitional plans are in a different risk pool anyway). The ACA-compliant individual market totals roughly 18-19 million people nationally (11 million on-exchange, another 7-8 million off-exchange). Grandfathered/Transitional plans likely total around 2-3 million more.
- Only individual market policies are included (there's a few states where the small group market has been merged with the individual market risk-pool wise, but I only include indy enrollees for purposes of weighting). The small group market was around 13.5 million people, according to Mark Farrah Associates.
- Some carriers are pulling out of either specific counties or entire states next year, or are dropping certain plans while keeping others. There's no way of estimating the "average rate increase" for anyone who's losing their existing plan altogether.
- Some states are based on very rough, partial data; for these I've used my best efforts to calculate an educated guesstimate based on available data.
- In some cases, estimates that I ran as recently as a few weeks ago may prove obsolete. For instance, Aetna is currently planning on renewing policies in 15 states...but also just announced that they may pull out of some or all of these. If they do, I'd have to go back and remove some or all of the Aetna data from those states (depending on whether they drop the entire state or just certain counties).
- AGAIN, none of these data have ANYTHING to do with deductibles, co-pays or network size. Those are all important factors, but I simply can't take them into account here.
- I can't stress the importance of this enough: These average rate hikes are only valid if one assumes that 100% of all current enrollees in each state renew their existing policy (where those policies are still being offered next year). This will not end up being the case, of course; in addition to the 2 million or so people who will have no choice but to shop around (due to co-ops going out of business, UnitedHealthcare/Humana pulling out of their state, other carriers dropping plans, etc), there will naturally be a large chunk of people who choose to shop around for different policies next year, either due to changing circumstances at their end or for simple comparison shopping purpose.
- UPDATE: As Margot Sanger-Katz reminded me, the flip side of this is that these requests also don't reflect the cost of any new plans being offered next year (either from new entrants or from existing carriers replacing existing plans or adding new ones).
- Finally, as of this writing, the actual 2017 rates have only been approved in five states (Mississippi, New York, Oregon, Rhode Island and Vermont). I've included those three in the tables below, but the sorting/color-coding is based (for now) on the requested rates only. As more state insurance commissioners post approved rates, I'll start posting them side by side with the requests so people can compare the before/after differences.
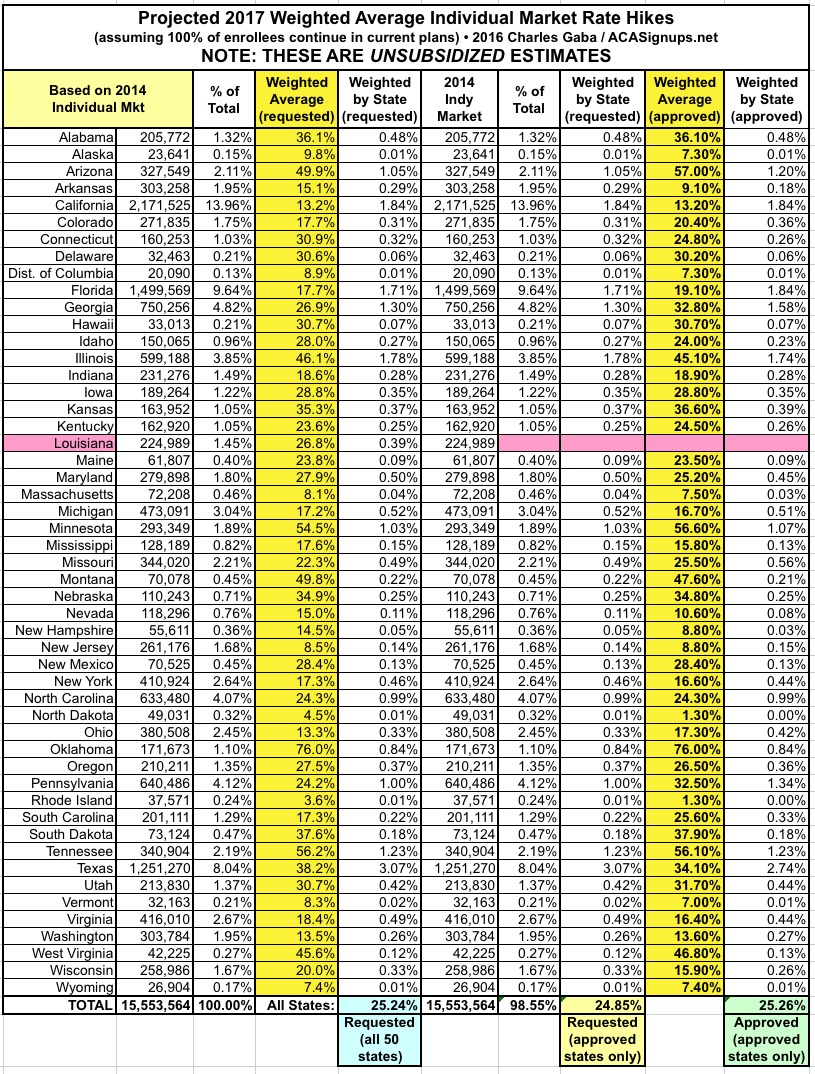
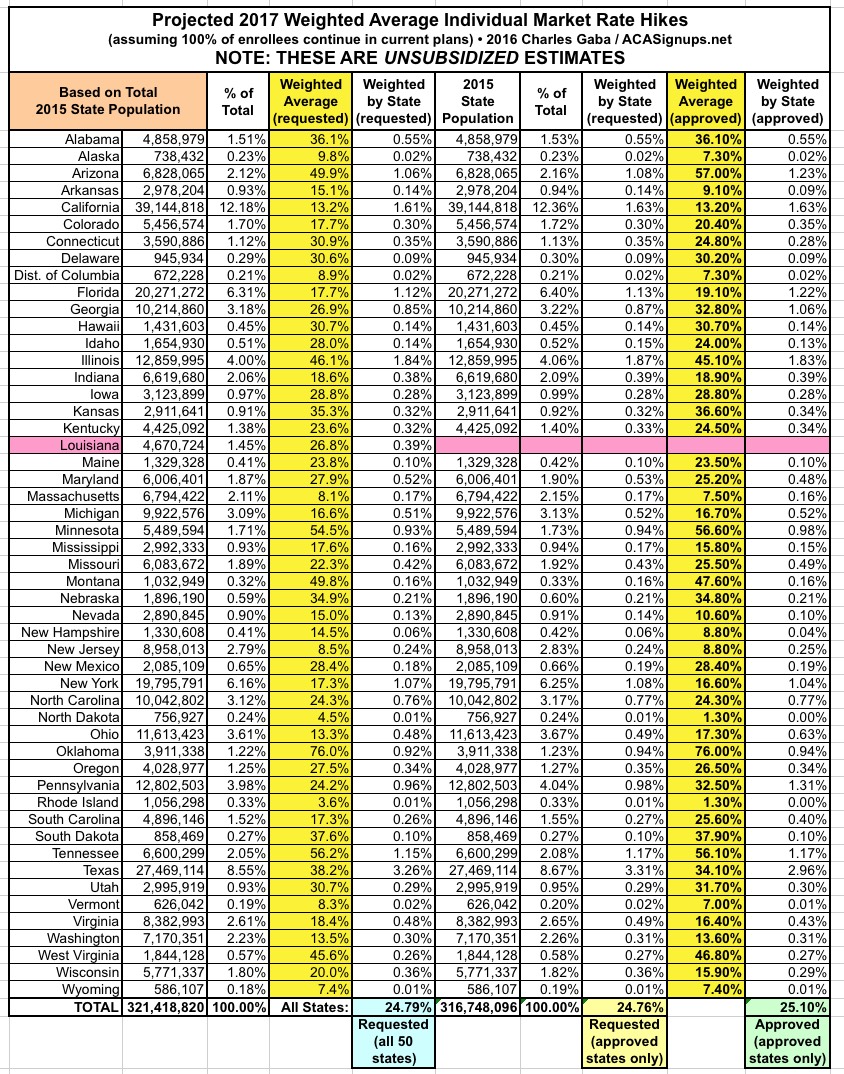
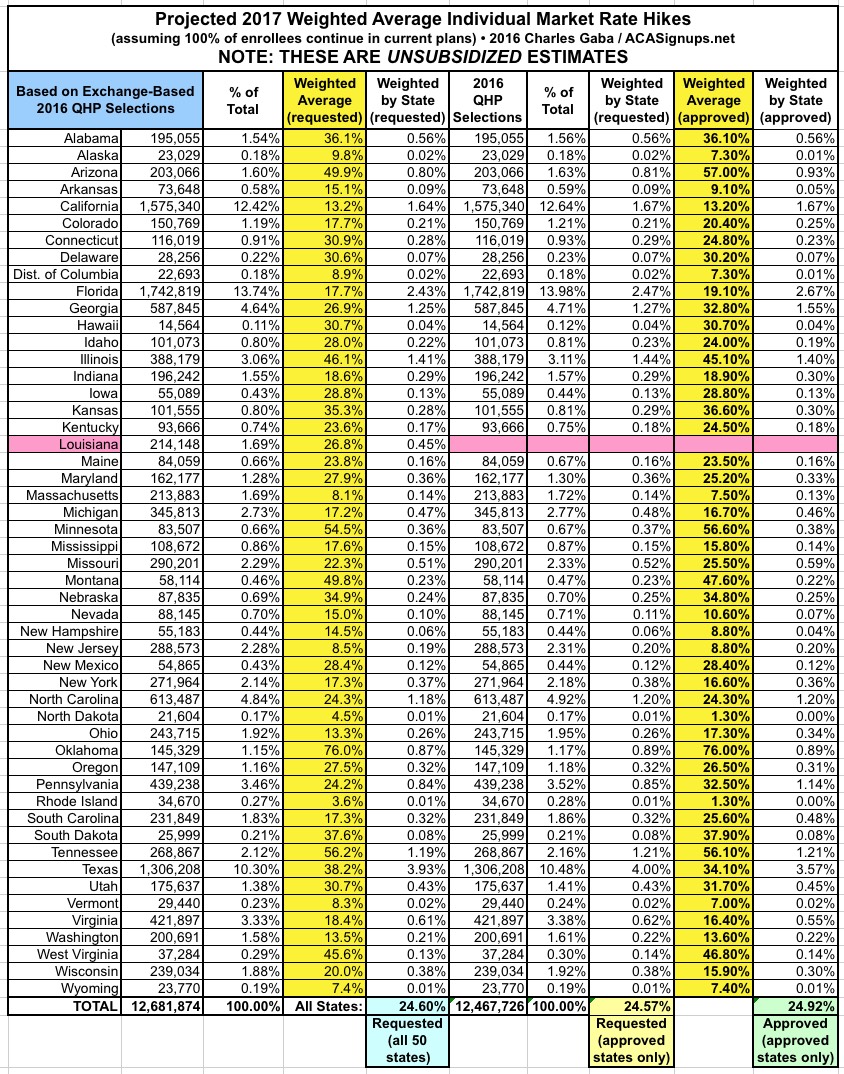
WITH ALL THAT IN MIND, here's what the numbers look like:
When you plug in both the revised statewide requested rate hikes (noted in pink below) along with the approved average hikes for these 5 states, here's what the table looks like. Note that the extra columns make it too unwieldy to line the 3 weighting tables up side by side anymore, so they're listed single-column below.
UPDATE 08/21/16: I've added Kentucky and Arkansas to the tables...they effectively cancel each other out, with KY bumping things up a point and AR dropping it back down again, so the overall average remains at around 17%.
UPDATE 08/23/16: I've updated a bunch of requested rate hikes for various states after removing Aetna and a few other carriers which are dropping out next year. In addition, I've added Tennesse to the approved rate hike tables; with a whopping 60% and no smaller-hike states added to balance it out, this skews the average to around 25.6% across 8 states (representing about 10% of the total population). Again, bear in mind that this number will continue to jump around every time a new state is added--California, with over 12% of the population regardless of how you slice it, will knock the national average down considerably once their approved rates are factored in.
UPDATE 08/24/16: I've added Georgia, for a total of 9 states representing about 14.8% of the total population. In addition, I've made adjustments to Virginia, Indiana and Michigan:
UPDATE 08/26/16: I've added Illinois and Indiana, for a total of 11 states representing about 20% of the total population. Again, the Tennessee and Illinois hikes skew the average much higher; once states like California and Florida are plugged in, the overall average should drop back down again:
UPDATE 08/30/16: I've added Iowa, for a total of 12 states representing about 21% of the population:
UPDATE 09/05/16: I've updated the requested averages in Arizona and New Hampshire, while adding the approved rates in Florida and Maine, so I now have approved rates for 31% of the population:
UPDATE 09/08/16: I've added the approved rates in Nebraska, Washington State and New Mexico (where I also had to update the requested rates), so I now have approved rates for 35% of the population:
UPDATE 09/14/16: I've made updates to the requested rates in several states and have added approved rates in Maryland and Connecticut, so I now have approved rates for states representing 37% of the population:
UPDATE 09/22/16: I've updated the requested rates in Idaho and have added approved rates in Colorado and Idaho, so I now have approved rates for states representing 40% of the population:
UPDATE 09/29/16: I've updated various requested rate hikes and/or modified approved rate hikes in Indiana, Iowa, Maine and Tennessee, while also adding approved rate hikes in Massachusetts, Montana, North Dakota and South Dakota, so I now have approved rate changes for 25 states representing 42% of the population. (Late update: I also have the official approved District of Columbia rates now):
UPDATE 10/06/16: I've added three more states to the mix. Two of them have very ugly hikes (Minnesota and Oklahoma)...but the third state is California, whose (relatively) low rate hikes and massive population effectively "cancels out" those two (on a national level). As a result, I now have approved rate hikes for 28 states representing 57% of the population:
UPDATE 10/06/16: Delaware's approved rates were just released, so I now have approved (unsubsidized) rate hikes for 29 states covering 58% of the population:
UPDATE 10/07/16: I've plugged in both Kansas and Nevada (and it looks like I somehow undercounted by 1 state earlier), so I now have the approved, unsubsidized rate hikes for 32 states covering 59% of the population:
UPDATE 10/13/16: I've added Alaska, Hawaii, Wisconsin and Utah, as well as updating Arkansas (down!) and Oregon (up!). This brings the approved tally up to 36 states covering 63% of the population:
UPDATE 10/14/16: BCBS of North Carolina has confirmed their 2017 rates. This brings the approved tally up to 37 states covering 2/3 of the U.S. population:
UPDATE 10/16/16: Alabama's 36.1% unsubsidized hike has been approved, so that's 38 states accounted for. New Hampshire's requested average is also updated:
UPDATE 10/17/16: Two major pieces of the puzzle filled in: Pennsylvania and Michigan have both posted their approved indy market rates for 2017, bringing the tally to 40 states covering 75% of the population:
UPDATE 10/17/16: A third major gap filled today: Arizona's DOI also issued their final rate increases, so that's 41 states covering 77% of the population:
UPDATE 10/25/16: With just 1 week to go and Window Shopping having gone live on HealthCare.Gov, this will be the final update (for real!) to this page: I've been able to plug in 5 of the 10 missing states all in one shot, including Missouri, New Jersey, Texas, West Virginia and Wyoming. Adding all of these nudges the national weighted average up to 25.6%. However, as noted here, assuming the remaining 5 states come in at the same as their requested averages, the national average will still end up just below the 25% threshold:
UPDATE 10/27/16: (sigh) OK, I was actually able to plug in the final approved numbers for both South Carolina and Ohio, as well as a corrected number for Washington State. As expected, this has resulted in the national average nudging back down slightly. I now have approved rates for every state except Louisiana, New Hampshire and Virginia:
UPDATE 10/28/16: Annnnnnnd now I've plugged in New Hampshire and Virginia. This leaves just Louisiana as the odd man out:
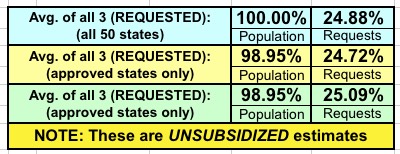
When you average all three methods together, the weighted UNSUBSIDIZED approved rate hike average for EVERY state except for Louisiana comes in at 25.1%:
Advertisement
