

The 2017 Requested Rate Hike Challenge!! (currently: 23.3% across all 50 states + DC)
Fri, 05/13/2016 - 1:56pm
NOTE: SCROLL TO BOTTOM OF ENTRY FOR UPDATES!
Regular readers know that I spent countless hours last summer tracking down the requested average 2016 rate change filing forms for every single state in the country, and then compiling them into my best guesstimate about the overall, weighted average rate changes for the individual policy market in each state and nationally.
In the end, I came up with a national projected weighted average increase of 12-13%, although I also made sure to note that I expected the effective average to only be around 9% after the dust settled...due to people shopping around.
As it happens, I turned out to be pretty much dead on target: The "presumptive" average (ie, assuming every single enrollee stayed with the same policy whenever possible) ended up being 11.6% nationally, while the effective average ended up being 8%.
I've started doing the same thing this year for 2017.
Since there are a lot of demographic variables which can skew the "average" up or down for any given state, last year I plugged the averages for each state into tables and weighted them based on 3 different criteria: The total (on plus off-exchange) individual market (based on 2014 data); the total exchange-based QHP selections as of the end of Open Enrollment; and the total population of each state. However, the 2014 data is too outdated by now (the national indy market has grown from around 15.6 million to around 20-21 million by now), so until the Kaiser Family Foundation or another trusted source compiles 2015 data, I'm dropping that method. Besides, all three methods still hovered in the same 12-13% range last year anyway.
IMPORTANT CAVEATS:
- This is for the total ACA-compliant individual market only. It does include ACA-compliant off-exchange policies, but does not include the small group market (which I may or may not add later)
- Due to the nature of this project, I have no way of estimating the average rate changes for enrollees of carriers which are pulling out of that state. For instance, UnitedHealthcare has around 18,000 people enrolled in ACA-compliant policies in Maryland, but is pulling out of the state next year. Those 18,000 people will have to shop around and go elsewhere. Without knowing which policies they're enrolled in now, or what the premiums for those policies are, I have no way of even guessing at how much their 2017 premiums will go up (or down).
- Some states are very rough estimates based on partial carrier data. For instance, in Iowa, Wellmark holds around 75% of the individual market and is requesting 40% hikes (ouch!). Medica is requesting 20%, but has a very tiny market share. Coventry holds nearly 24% of the market, but hasn't posted their request yet, so for the time being, I'm assuming around a 35% state-wide average.
- All rate changes are requested only, not approved unless otherwise noted. Some carriers re-submit revised request filings later on, and even then, in most states (not all) they still have to be approved by state regulators, who often reduce the amount of the increase (or even make the carriers lower the rates). In some cases, the regulators will make the carrier increase rates even more than they asked for.
- As a result of all of the above and more, not only will I be adding states to the tables above over the next few months, I'll also be adjusting/updating some of the states which are already included, so take all of these figures with a large grain of salt.
WITH ALL THAT IN MIND, as of this writing, I've compiled the requested, weighted, average rate hikes for the following states:
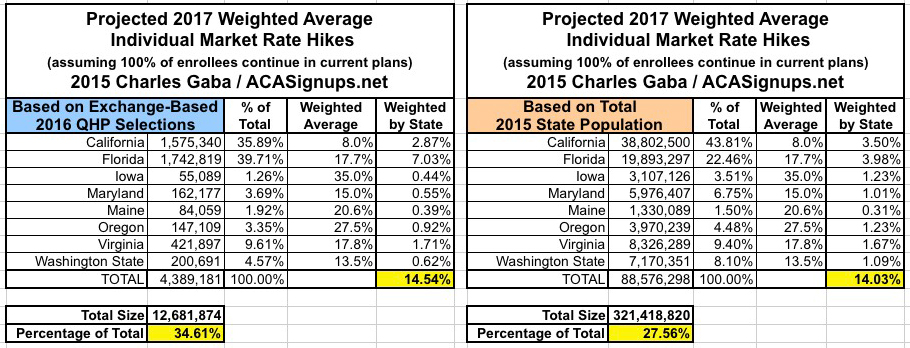
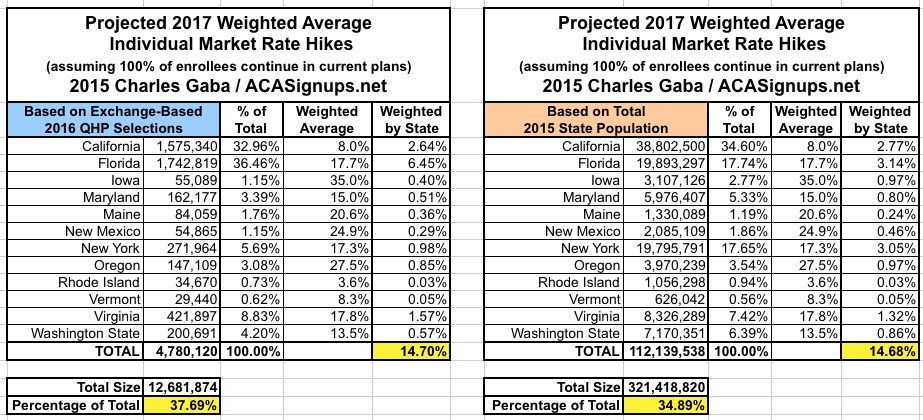
As of May 16, I have data for 8 states representing either 28% or 35% of the nation depending on which method you go by. Either way, the national average currently looks like it's roughly 14-15%.
HOWEVER, it's important to note that this is mostly being held down by California's outlier 8% projection, with over 12% of the total population (and total QHP selections). Take CA out of the loop and the other states would be averaging close to 20%.
A few people have started sending me bits and pieces of rate filings for other states, which I appreciate. However, there are still a lot of other states (+DC) to go, so this year I've decided to formally offer to let everyone join in the fun!
Below this entry I've listed the direct links to each state's Department of Insurance website and/or their NAIC System for Electronic Rate & Form FIling (SERFF) database*. Feel free to comb through piles of confusing (and often seemingly contradictory) PDF files to figure out a) the average rate changes each carrier is requesting on the individual (and/or small group) market and b) just how many currently-enrolled individuals would actually be impacted by those rate changes next year assuming they end up keeping the same policy!
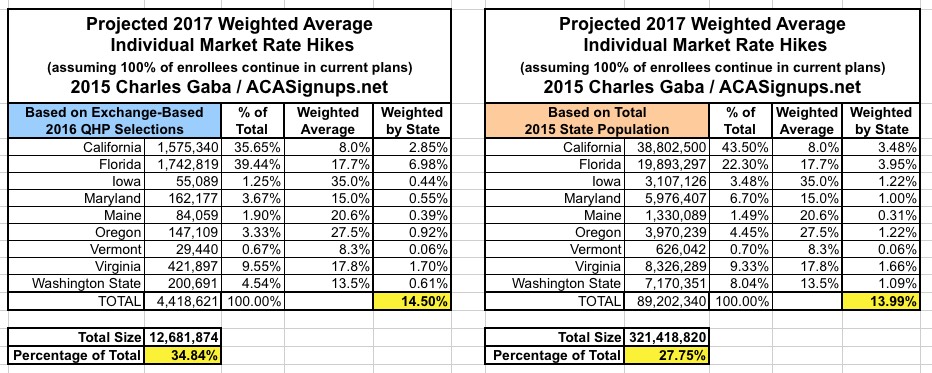
UPDATE: With the addition of Vermont, as of May 17th, I have data for 9 states representing 28-35% of the nation depending on your method. Either way, the national average currently looks like it'll be around 14-15%:
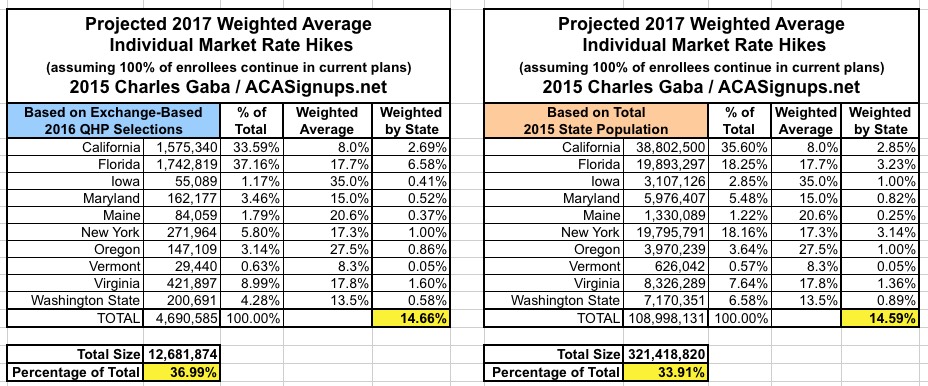
UPDATE 5/18/16: With the addition of New York, as of May 18th, I have data for 10 states representing around 35% of the nation. The national weighted average currently looks like it'll be around 14-15%:
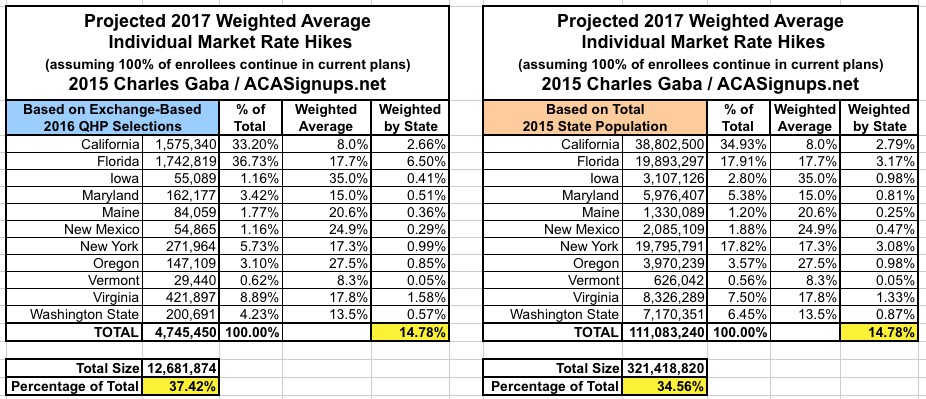
UPDATE 5/18/16: With the addition of New Mexico, as of May 18th, I have data for 11 states representing around 36% of the nation. The national weighted average currently looks like around 14.8%:
UPDATE 5/23/16: With the addition of Rhode Island, I have data for 12 states representing about 36% of the nation. RI is a tiny state, so it doesn't impact the national picture much at all:
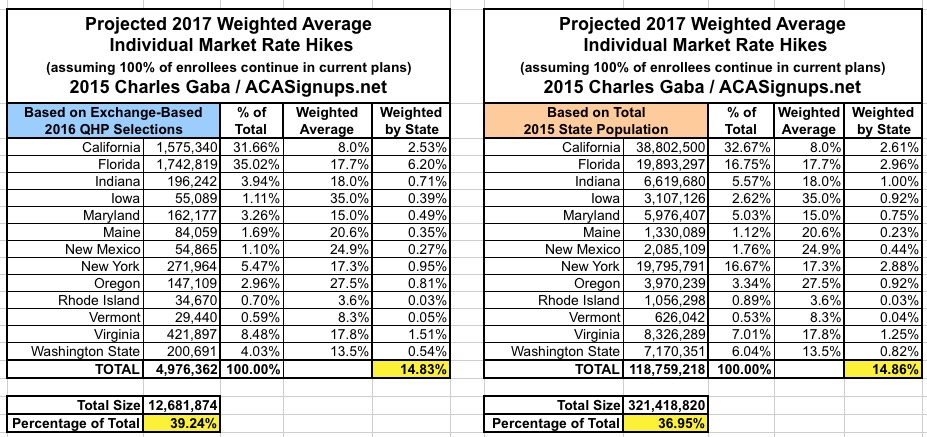
UPDATE 5/24/16: With the addition of Indiana, I now have data for 13 states representing about 38% of the nation. This inches the overall average up to about 14.9%:
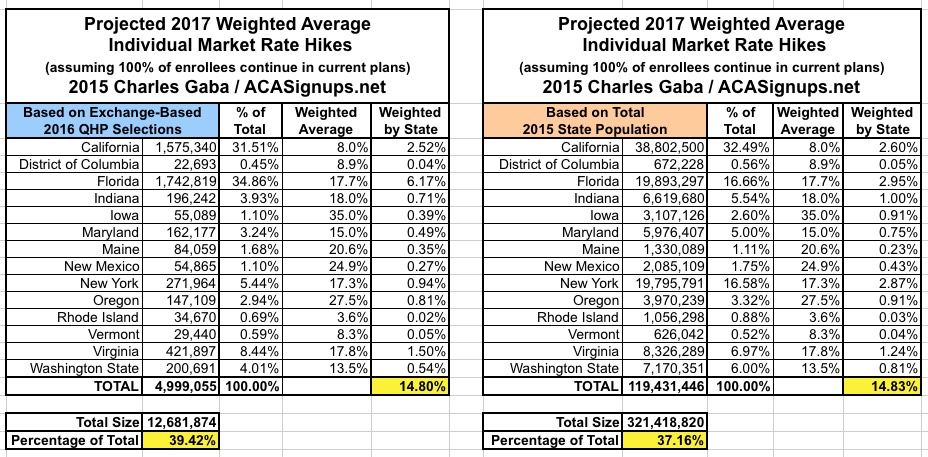
UPDATE 5/25/16: With the addition of the District of Columbia, I now have data for 13 states + DC representing about 38% of the nation. DC's 8.9% knocks the overall average back down a smidge to 14.8% overall:
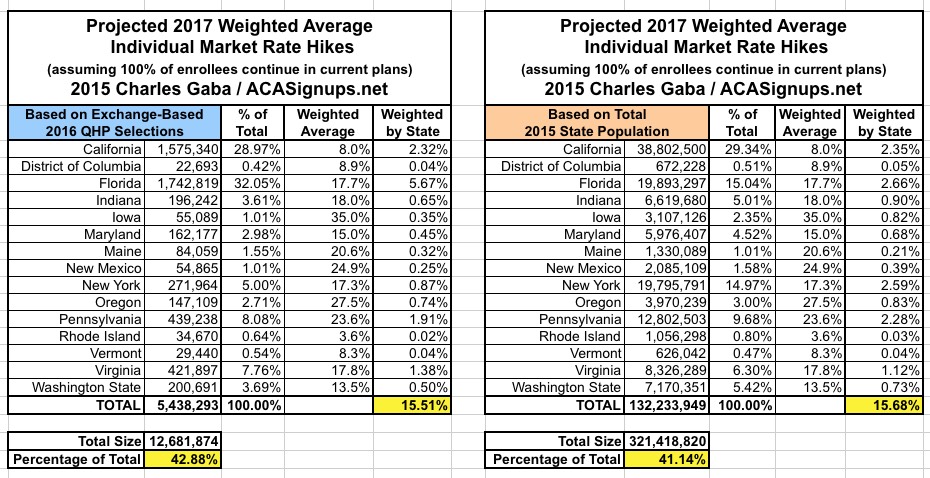
UPDATE 5/25/16: With the addition of Pennsylvania, I now have data for 14 states + DC, represnting about 42% of the nation. Pennsylvania is a large state and their carriers are seeking an ugly 23.6% average increase, so the national weighted average just got bumped up nearly a point to 15.6% overall:
UPDATE 5/26/16: With the addition of Texas, I now have data for 15 states + DC, representing about half the total population. Texas is one of the largest states in the country, and their carriers are requesting admittedly painful 35% average rate hikes, so the national average requested increase just jumped dramatically to around 19%:

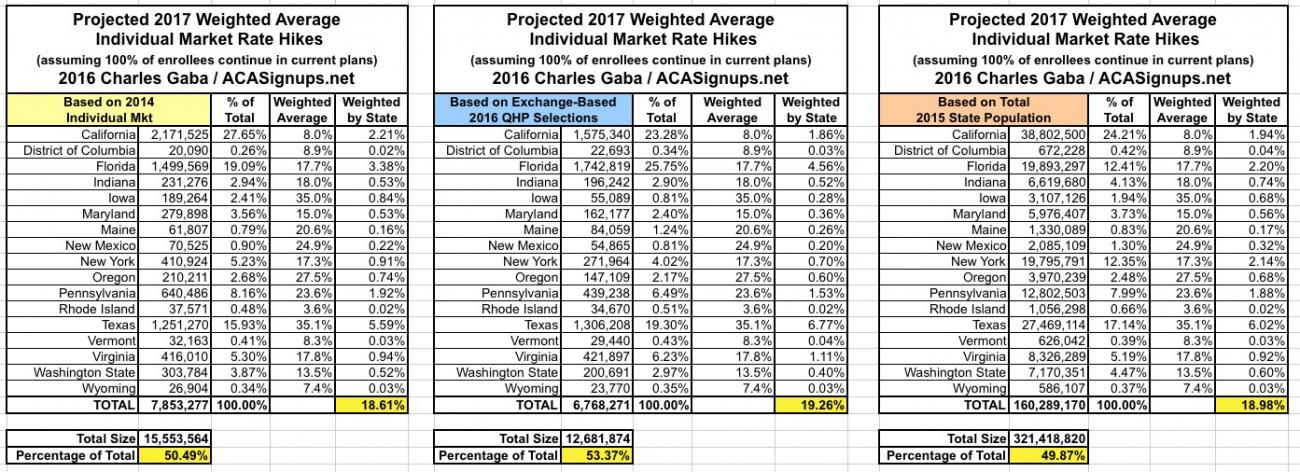
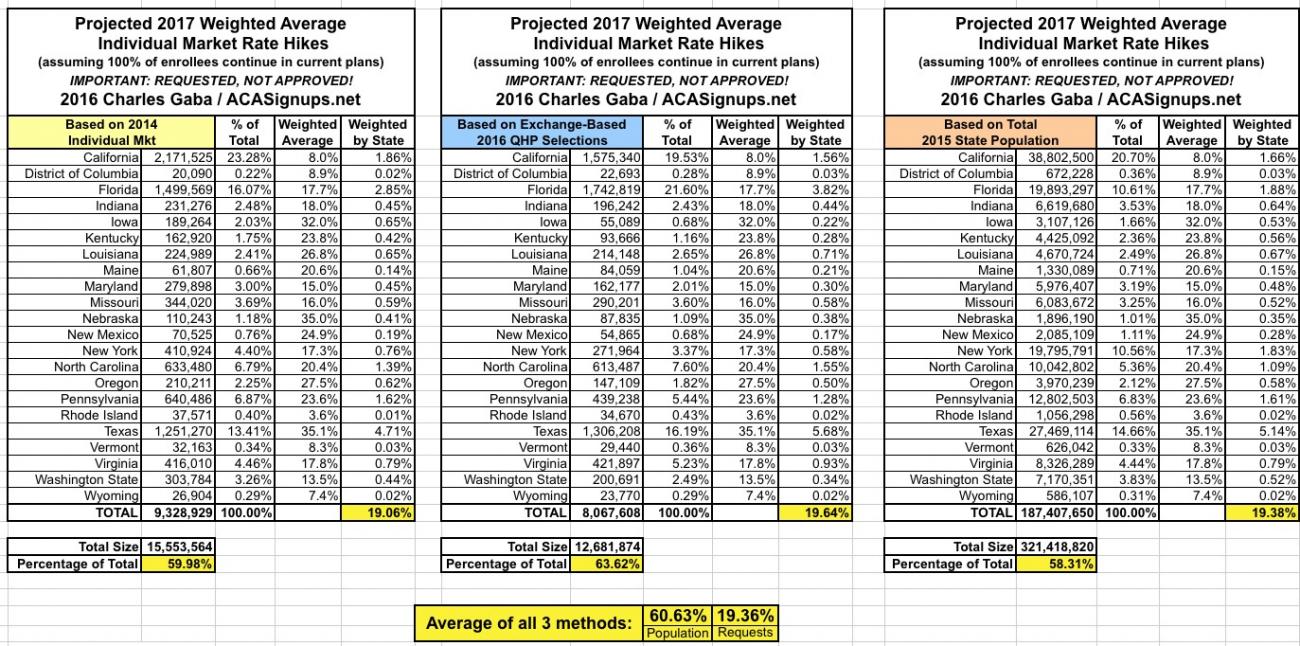
UPDATE 5/27/16: With the addition of Wyoming, I now have data for 16 states + DC, representing 50% of the total population. Wyoming is the smallest state, so even though they're only looking at a 7.4% average requested rate hike, it amounts to a rounding error on the national results, which remain at around 19% on average.
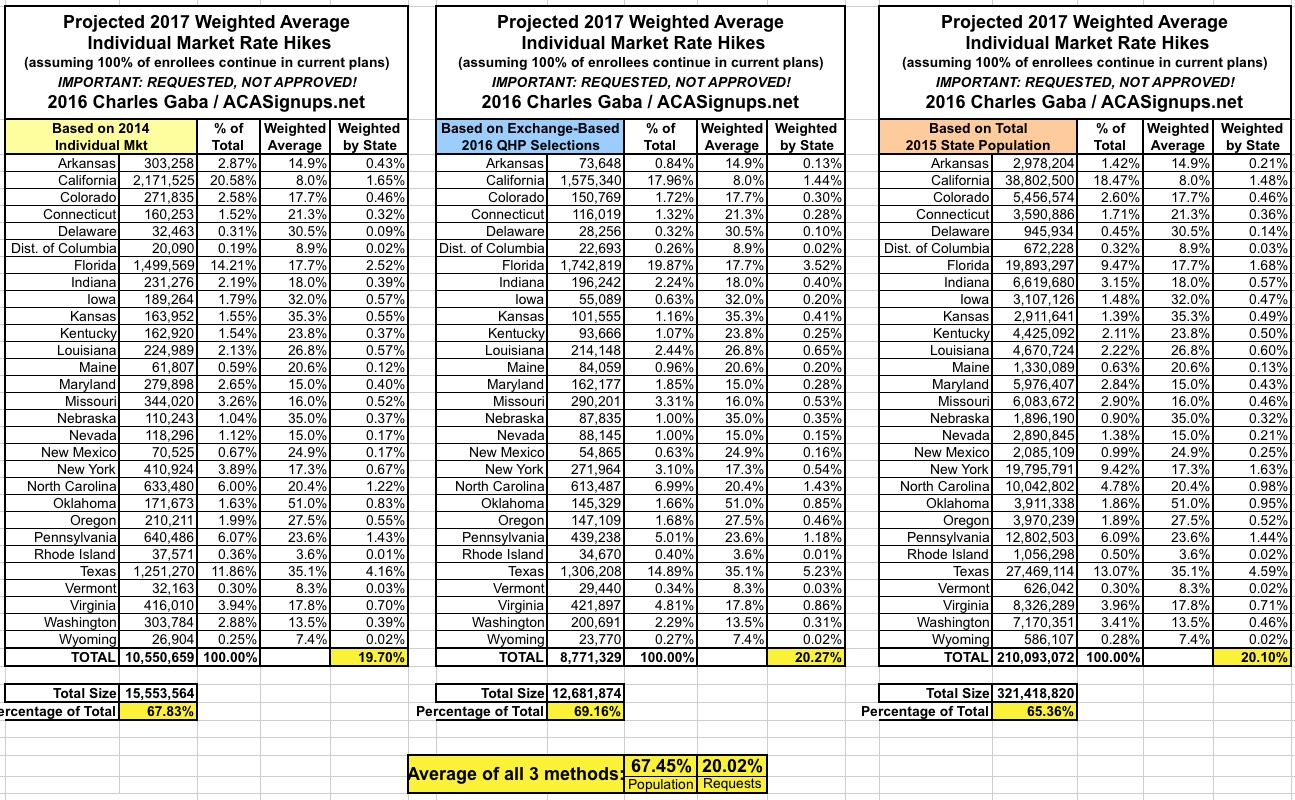
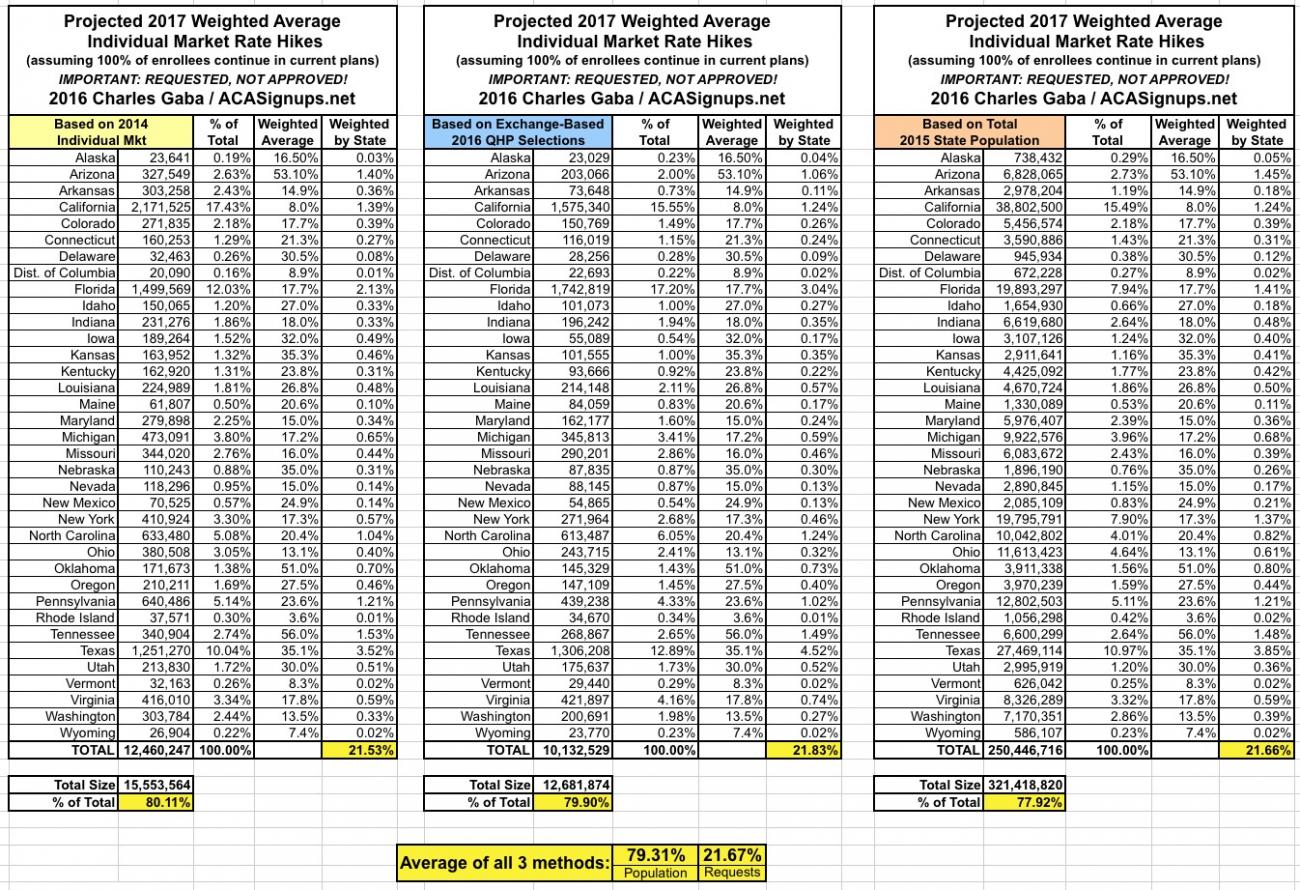
Also, note that I've changed my mind and decided to go ahead and start including the third method of weighting by state, based on the total 2014 individual market in each state (according to data from Mark Farrah & Associates by way of the Kaiser Family Foundation). As you can see, the national average is remarkably similar regardless of which method you use, ranging from 18.6% - 19.3%:
NOTE: Click image for higher-resolution version!
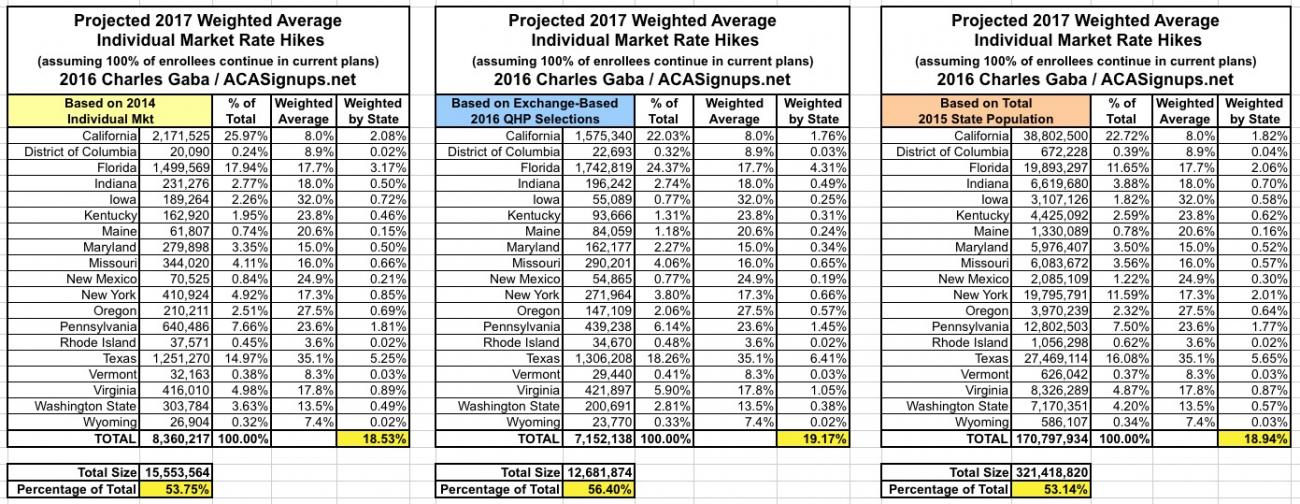
UPDATE 5/31/16: With the addition of Kentucky and Missouri, as well as an update to Iowa, I now have data for 18 states + DC, representing around 55% of the total population.
Kentucky's 23.8% average requested rate hike bumped things up, but this was effectively cancelled out by Missouri's 16.0%, leaving things at around 19% overall nationally.
UPDATE 6/01/16: With the addition of North Carolina, I now have data for 19 states + DC, representing around 58% of the total population.
As you can see below, I've also added cells at the bottom showing both the "percent of population represented" and "weighted increase requests by state" averaged together across all 3 measurement methods; it's still coming in at roughly 19.0% nationwide.
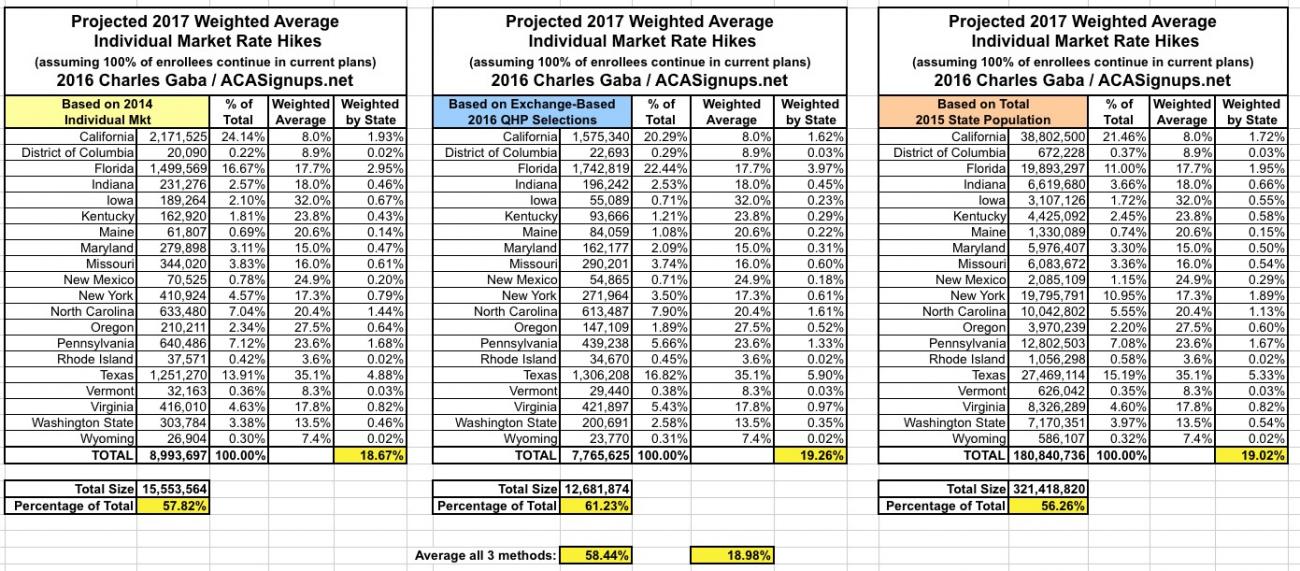
At this point, with nearly 60% of the total population baked into the mix, the addition of each of the remaining 31 states will have an increasingly smaller influence on the national average. For instance, let's say that the other 31 states average around 30% increases--that would raise the national average to around 23.6%. If they average 10%, that would only lower the national average to roughly 15.2%. The point is that while I'll continue to plug additional states into the mix, I wouldn't expect the national number to shift around too dramatically going forward; it's likely to end up somewhere in the 20% ballpark.
Remember once again, however, that these are all merely requested increases; some of them will be reduced by regulators (although in a hopefully-very-few cases, they might even be increased). Even then, the approved increases assume that 100% of current enrollees renew the exact same policy that they already have (assuming those policies are still available). After shopping around, the effective increase will almost certainly be somewhat lower, though we won't know that until next spring.
if I had to make a guess right now, I'd estimate the overall approved rates will come in at somewhere between 16-19% nationally, while the effective (full price) rate increases will end up being somewhere between 12-16% by next spring.
Note that none of this has anything to do with co-pays, deductibles or how wide/narrow the networks are; those are all important as well, but just aren't something which I'm tracking as part of this project.
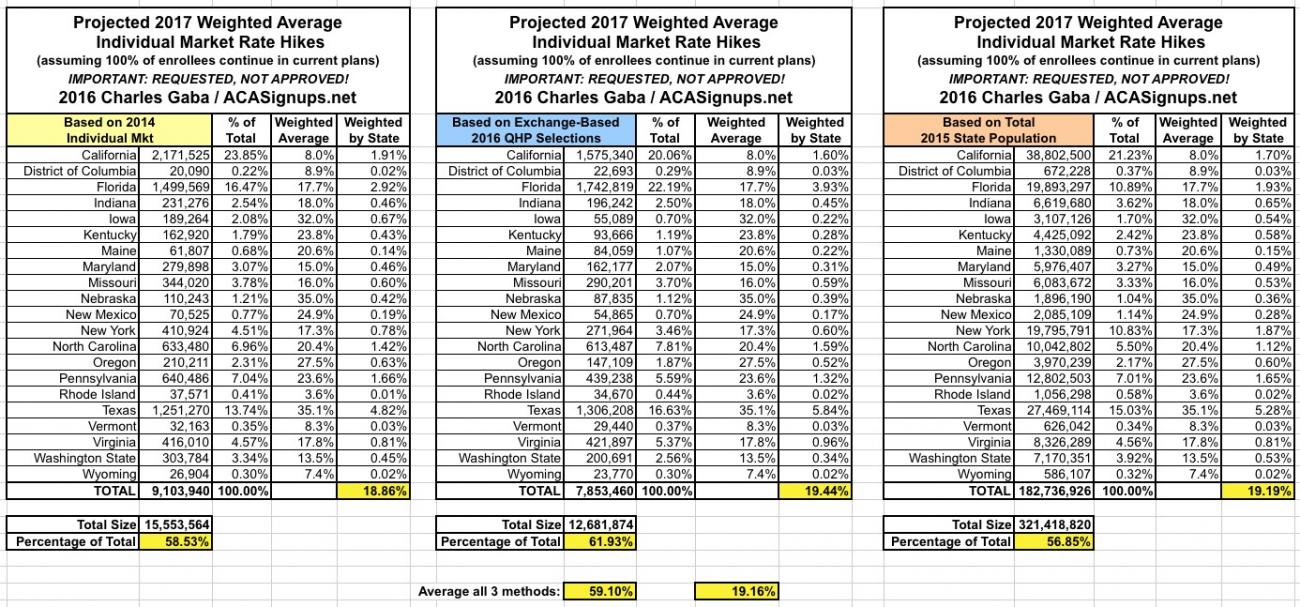
UPDATE 6/01/16: With the addition of Nebraska, I have data for 20 states + DC representing 59% of the country:
UPDATE 6/02/16: With the addition of Louisiana, I now have data for 21 states + DC, representing 61% of the population:
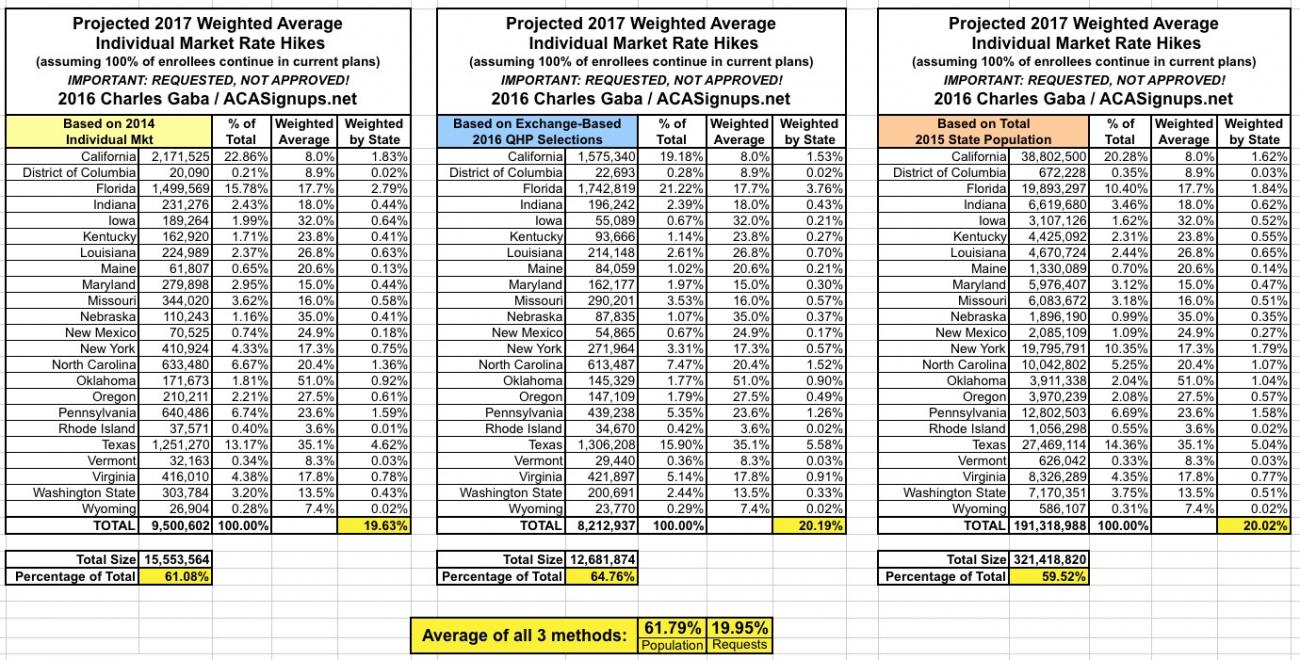
UPDATE 6/02/16: With the addition of Oklahoma, I now have data for 22 states + DC, representing 62% of the population:
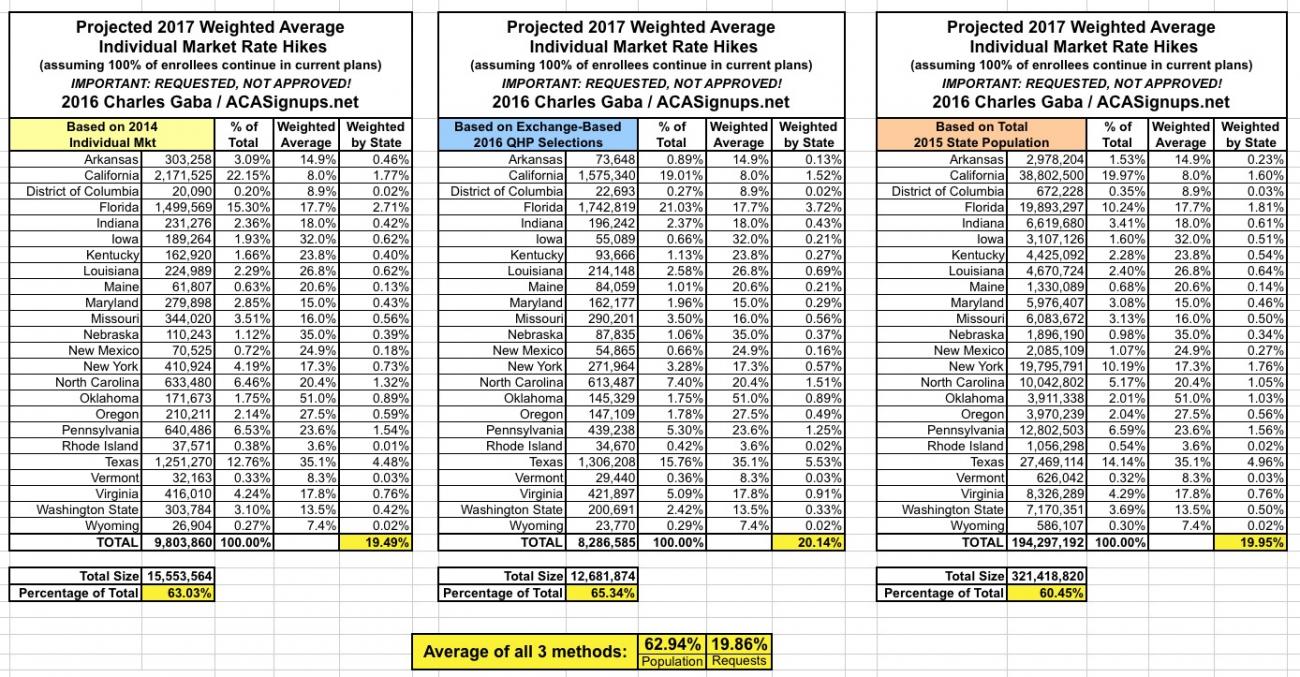
UPDATE 6/03/16: With the addition of Arkansas, I now have data for 23 states + DC, representing about 63% of the population:
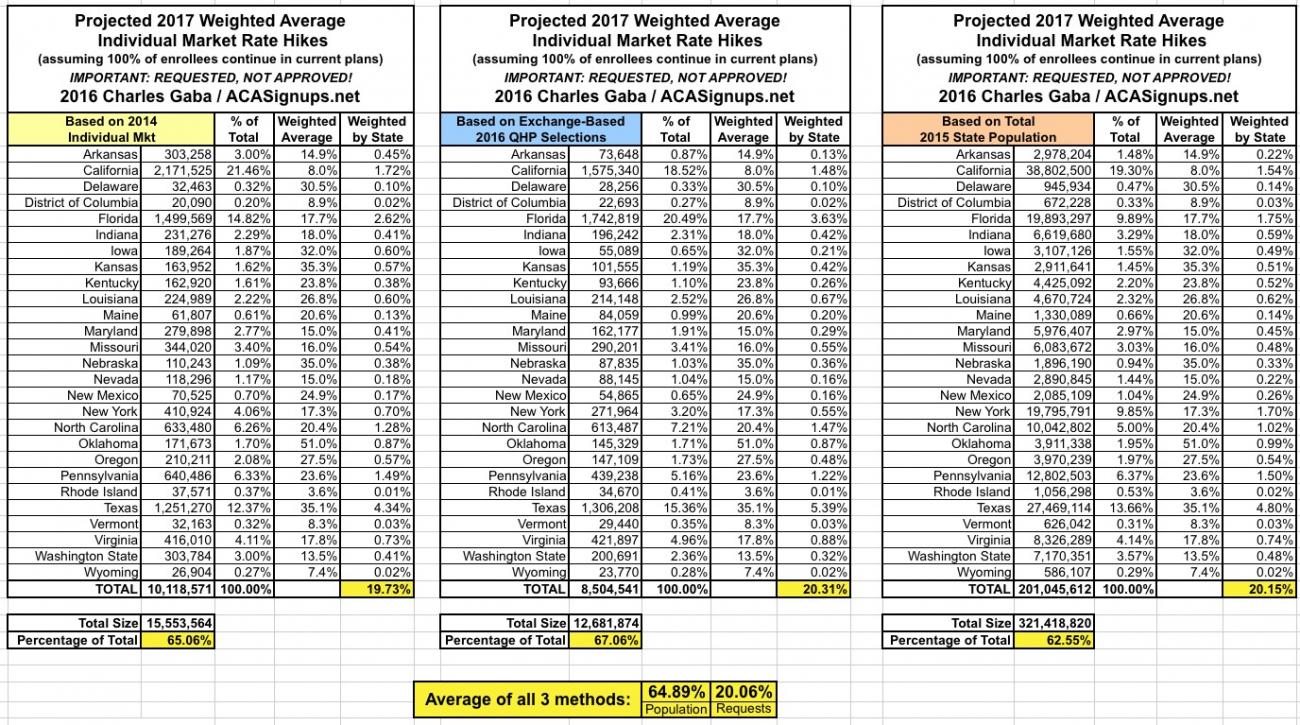
UPDATE 6/03/16: With the addition of Kansas and Delaware, I now have data for 25 states + DC, representing about 64% of the population:

UPDATE 6/03/16: With the addition of Nevada, I now have data for 26 states + DC, representing about 65% of the population:
UPDATE 6/06/16: With the addition of both Colorado and Connecticut, I now have data for 28 states + DC, representing over 2/3 of the total population:
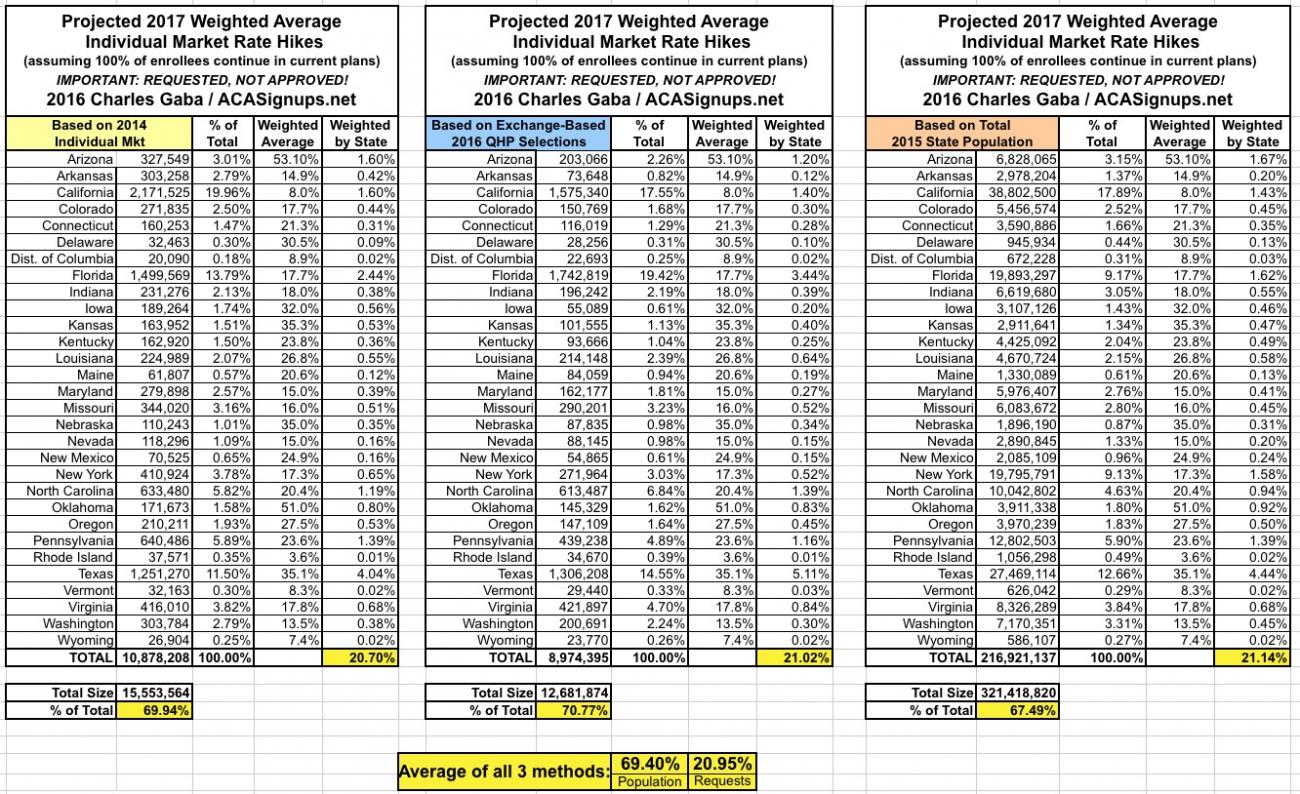
UPDATE 6/07/16: With the addition of Arizona, I now have data for 29 states + DC representing nearly 70% of the population:
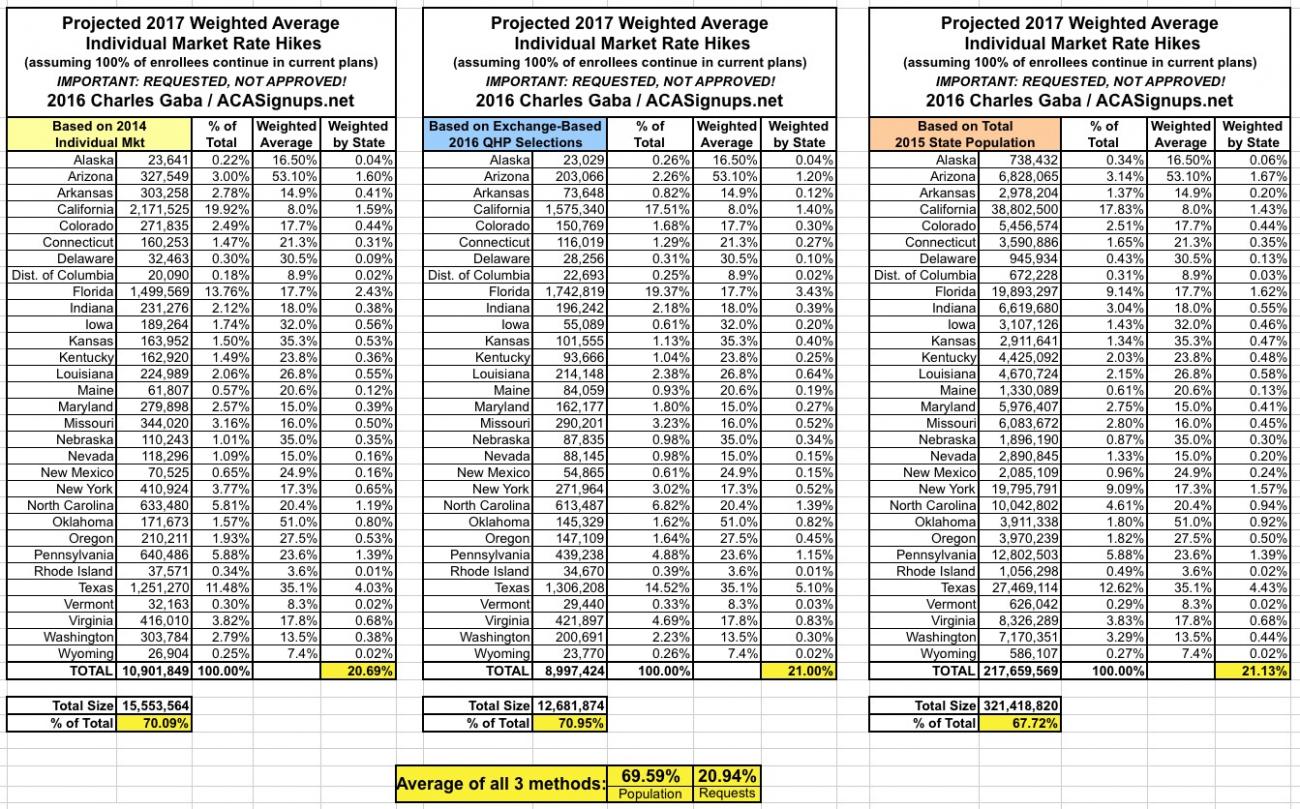
UPDATE 6/09/16: With the addition of Alaska, I now have data for 30 states + DC, representing 70% of the population:
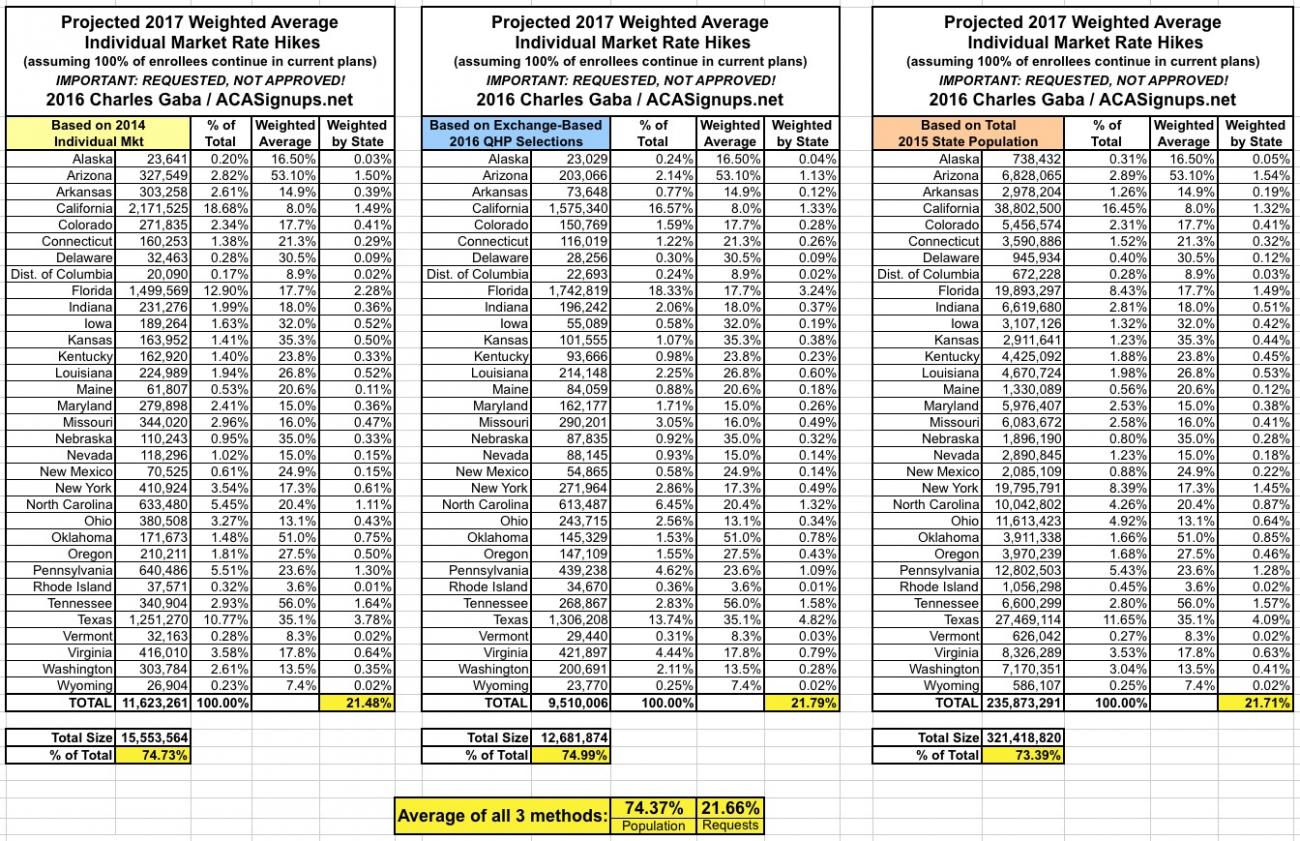
UPDATE 6/13/16: With the addition of Tennessee, I now have data for 31 states representing 72% of the population:

UPDATE 6/20/16: With the addition of Ohio, I now have data for 32 states representing 74% of the population:
UPDATE 6/20/16: With the addition of Utah, I now have data for 33 states, representing 76% of the population:

UPDATE 6/21/16: With the addition of Idaho, I now have data for 34 states, representing 76% of the population:

CHECKING IN AGAIN: At this point, with over 3/4 of the total population baked into the mix, the addition of each of the remaining 16 states will have an increasingly smaller influence on the national average.
- Let's say that the other 16 states average around 30% increases--that would raise the national average to around 23.8%.
- If they average 10%, that would only lower the national average to roughly 19.0%.
While I'll continue to plug additional states into the mix, I wouldn't expect the national number to shift around too dramatically going forward; it's likely to end up somewhere in the 22% ballpark that it's at right now.
Remember once again, however, that these are all merely requested increases; some of them will be reduced by regulators (although in a hopefully-very-few cases, they might even be increased). Even then, the approved increases assume that 100% of current enrollees renew the exact same policy that they already have (assuming those policies are still available). After shopping around, the effective increase will almost certainly be somewhat lower, though we won't know that until next spring.
if I had to make a guess at this point, I'd estimate the overall approved rates will come in at somewhere around 18% nationally, while the effective (full price) rate increases will end up being somewhere around 14% by next spring.
Note that none of this has anything to do with co-pays, deductibles or how wide/narrow the networks are; those are all important as well, but just aren't something which I'm tracking as part of this project.
UPDATE 6/22/16: With the addition of Michigan, I now have data for 35 states + DC, representing 79% of the population:
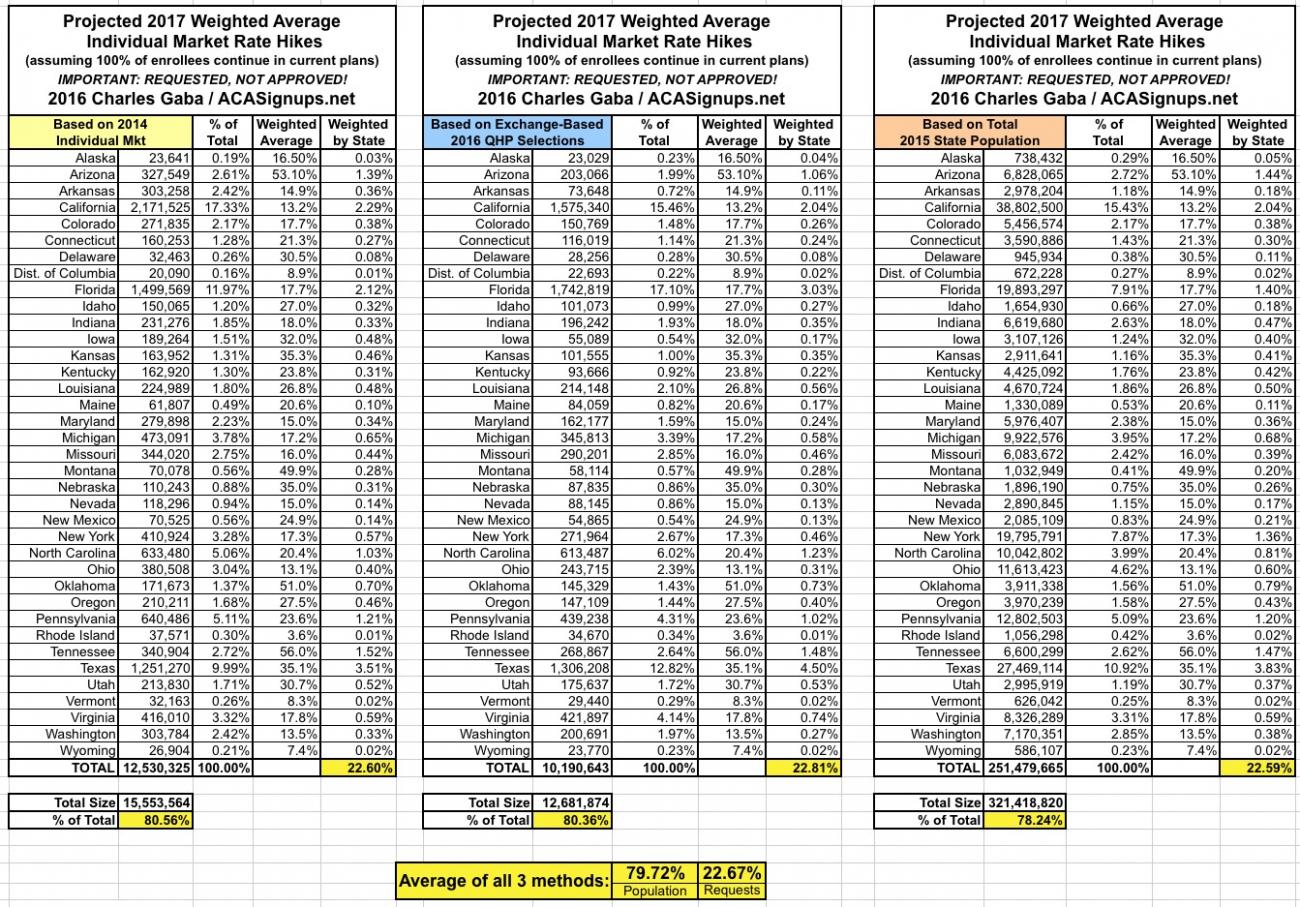
UPDATE 7/8/16: With the addition of Montana, I now have data for 36 states + DC, representing 80% of the population:

UPDATE 7/19/16: With the updated California average included, the national weighted average has increased by 0.9 percentage points to 22.7%:
I should also note that while I'm still checking the remaining 14 states every day to see if they've finally posted their requested rate hikes, the odds are that the approved hikes will be released in many states before the requested ones show up in some of them (Oregon has actually already posted their approved hikes, in fact).
Since the 36 states + DC I have on record make up about 80% of the population, the impact of the remaining 14 states is likely to be minimal one way or the other. Once again:
- 80% x 22.7% = 18.2% base (i.e., even if the remaining 14 states have a zero % rate change, the national average would still be 18.2%)
- If the balance average around 15%, that would drop the national average down to 21.2%
- If the balance average around 30%, that would raise the national average up to 24.2%
The remaining states consist of Alabama, Georgia, Hawaii, Illinois, Massachusetts, Minnesota, Mississippi, New Hampshire, New Jersey, North Dakota, South Carolina, South Dakota, West Virginia and Wisconsin.
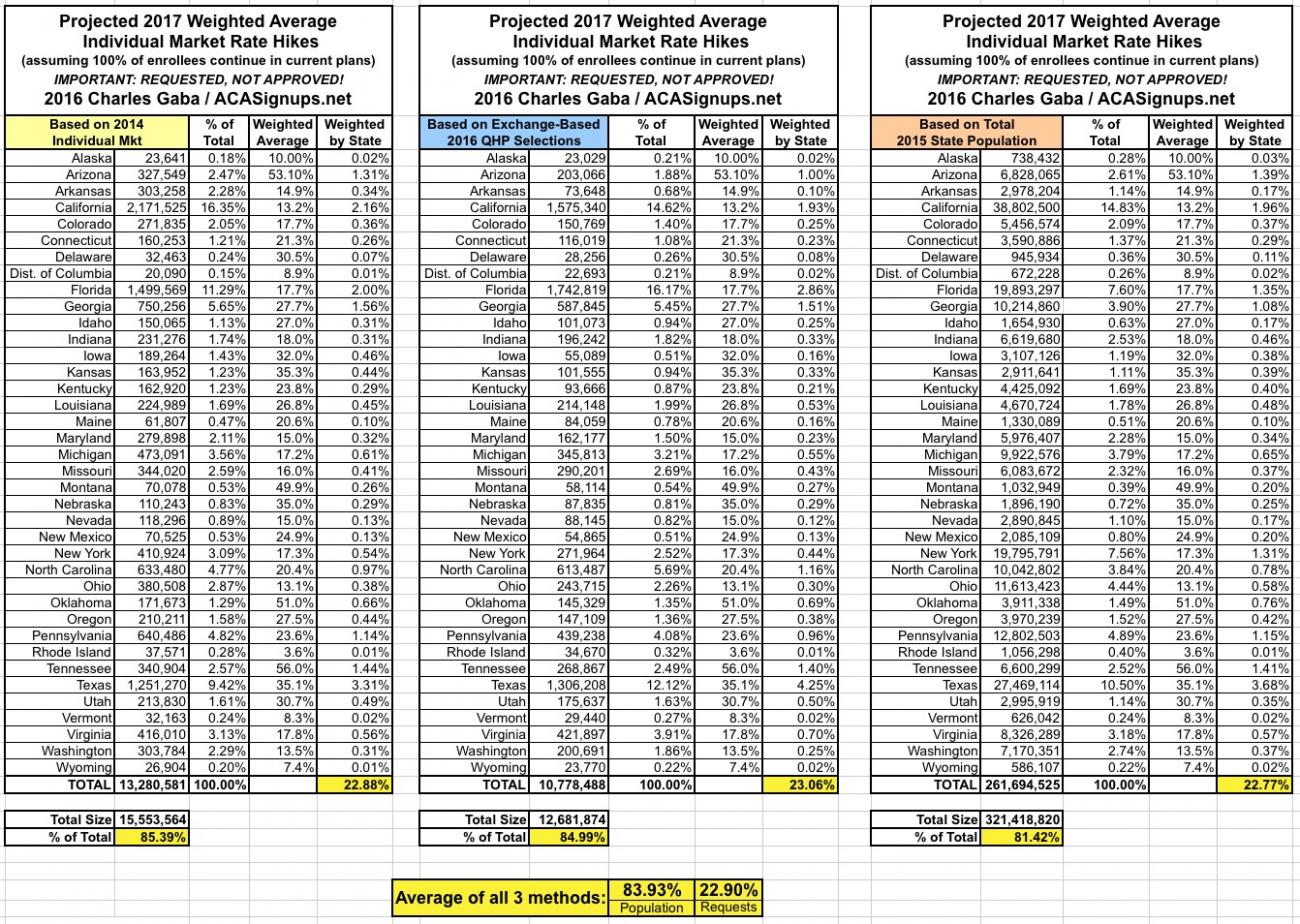
UPDATE 7/23/16: OK, with the addition of Georgia, I now have 37 states representing 84% of the total population, with a nationally weighted average rate hike request of 22.9%.
I should also note that Alaska's average has dropped significantly, from my previous estimate of 16.5% to 10.0%...not that this makes much difference nationally.
Since the 36 states + DC I have on record make up about 84% of the population, the impact of the remaining 13 states is likely to be minimal one way or the other. Once again:
- 84% x 22.9% = 19.2% base (i.e., even if the remaining 13 states have a zero % rate change, the national average would still be 19.2%)
- If the balance average around 15%, that would drop the national average down to 21.6%
- If the balance average around 30%, that would raise the national average up to 24.0%
- If the balance average around 40%, that would raise the national average up to 25.6%
The remaining states consist of Alabama, Hawaii, Illinois, Massachusetts, Minnesota, Mississippi, New Hampshire, New Jersey, North Dakota, South Carolina, South Dakota, West Virginia and Wisconsin.
MAJOR UPDATE 08/02/16:
August 1st was the deadline for every state to submit their 2017 rate filings, meaning that the 14 states missing from my Requested Rate Hike Project are finally available to be plugged into the spreadsheet. I'll also be going back through the other states I've been tracking since as early as April to see which ones require updates due to carriers dropping out, joining in or resubmitting their rate requests.
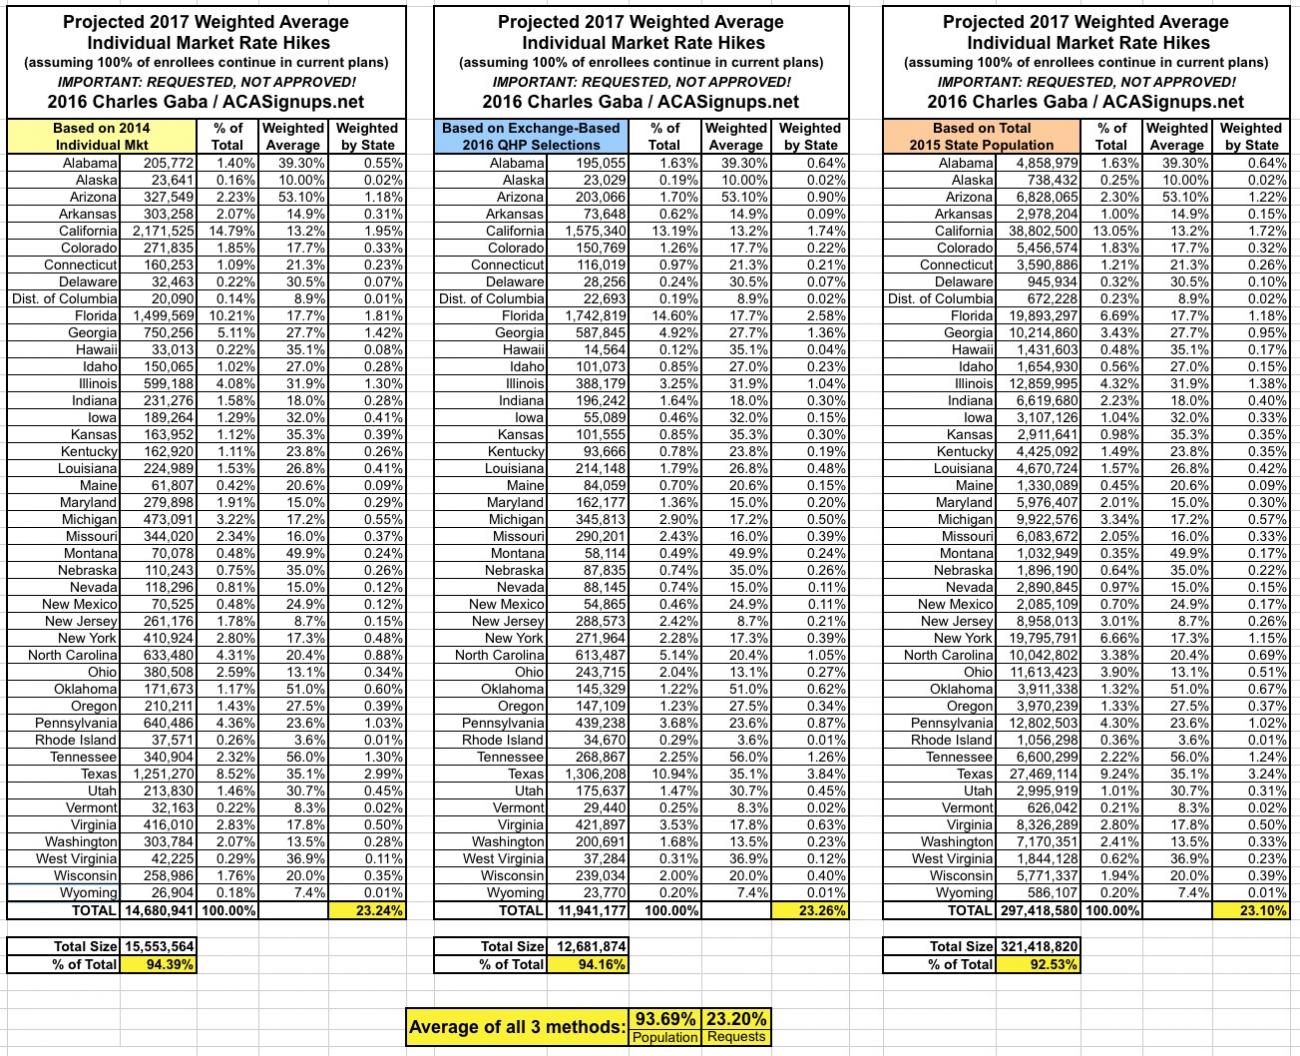
With that in mind, I've added several of the missing states already, including Alabama, Hawaii, Illinois, New Jersey, West Virginia and Wisconsin.
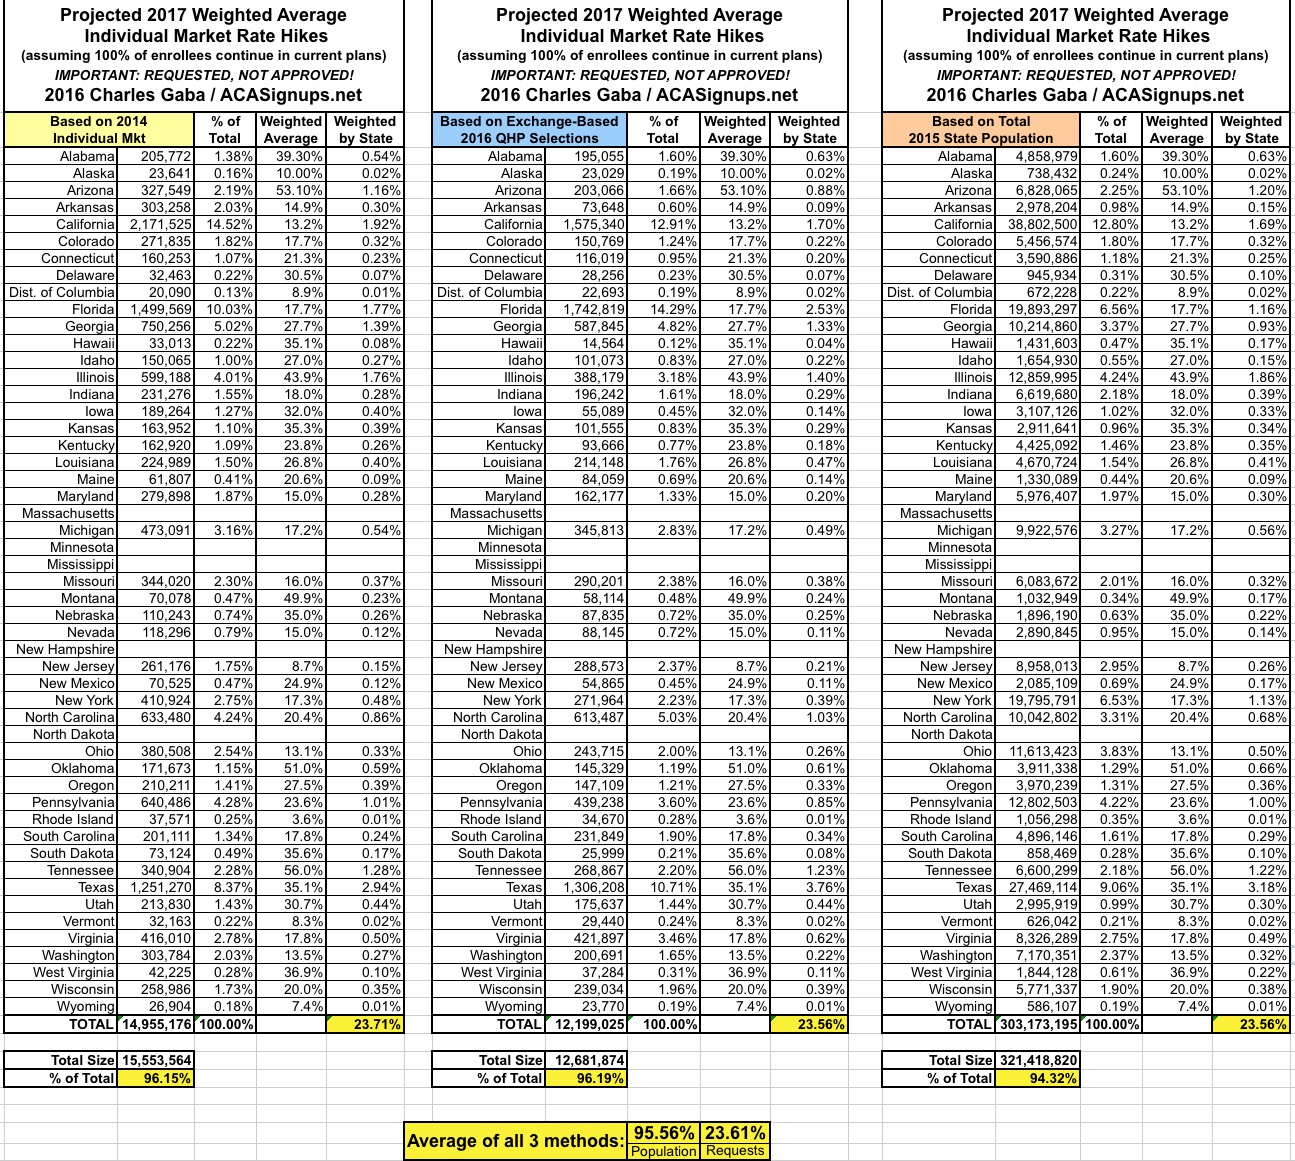
With these six states added, I've now accounted for over 93% of the total population, with a national weighted average requested rate hike of 23.2%:
UPDATE 8/5/16:
I've added 2 more states (South Dakota and South Carolina), and also had to go back and revise my Illinois estimate. As a result, the national weighted average has inched up slightly further yet, to 23.6%. Note that I've now accounted for over 95% of the total population (45 out of 50 states).
UPDATE 8/06/16:
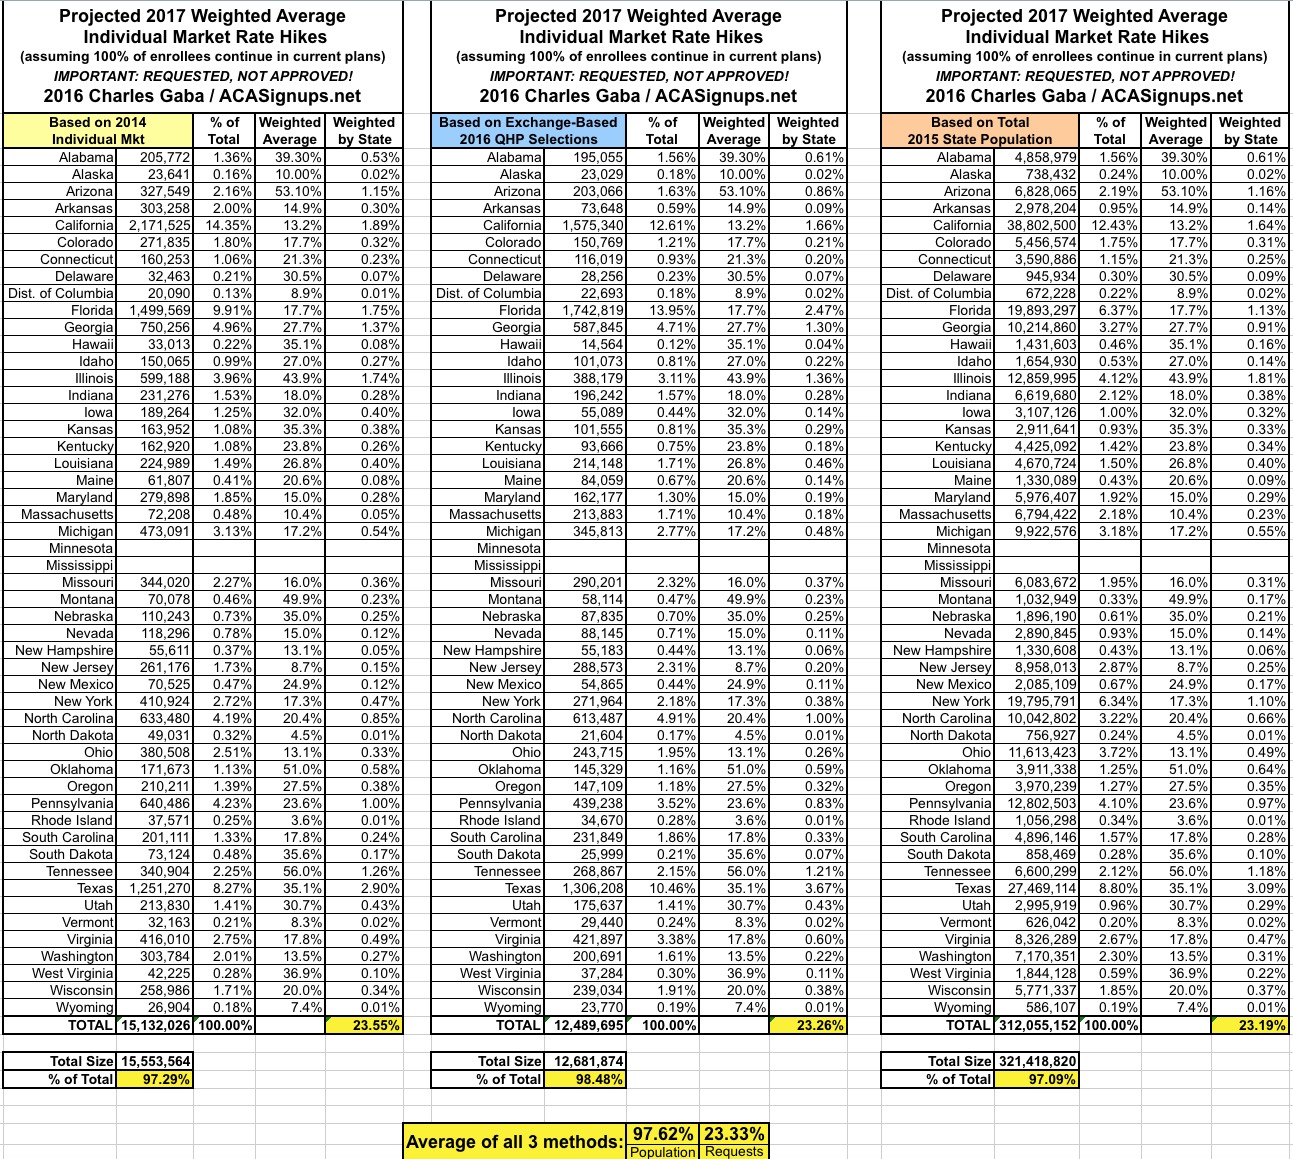
I've added 3 more states: Massachusetts, New Hampshire and North Dakota, bringing the total up to 48 states, representing over 97% of the total population. The weighted average has dropped slightly, to 23.3% nationally.
Minnesota and Mississippi are the only states left...but guess what? Neither of these states is listed at the RateReview.HealthCare.Gov website!
Of course, at this point, these two states, with a combined 2.4% of the total population, won't make much of an impact on the national average...but it's still important to know where every state stands, and very strange that every other state would have their filings listed by the August 1st deadline except for these two. Weird.
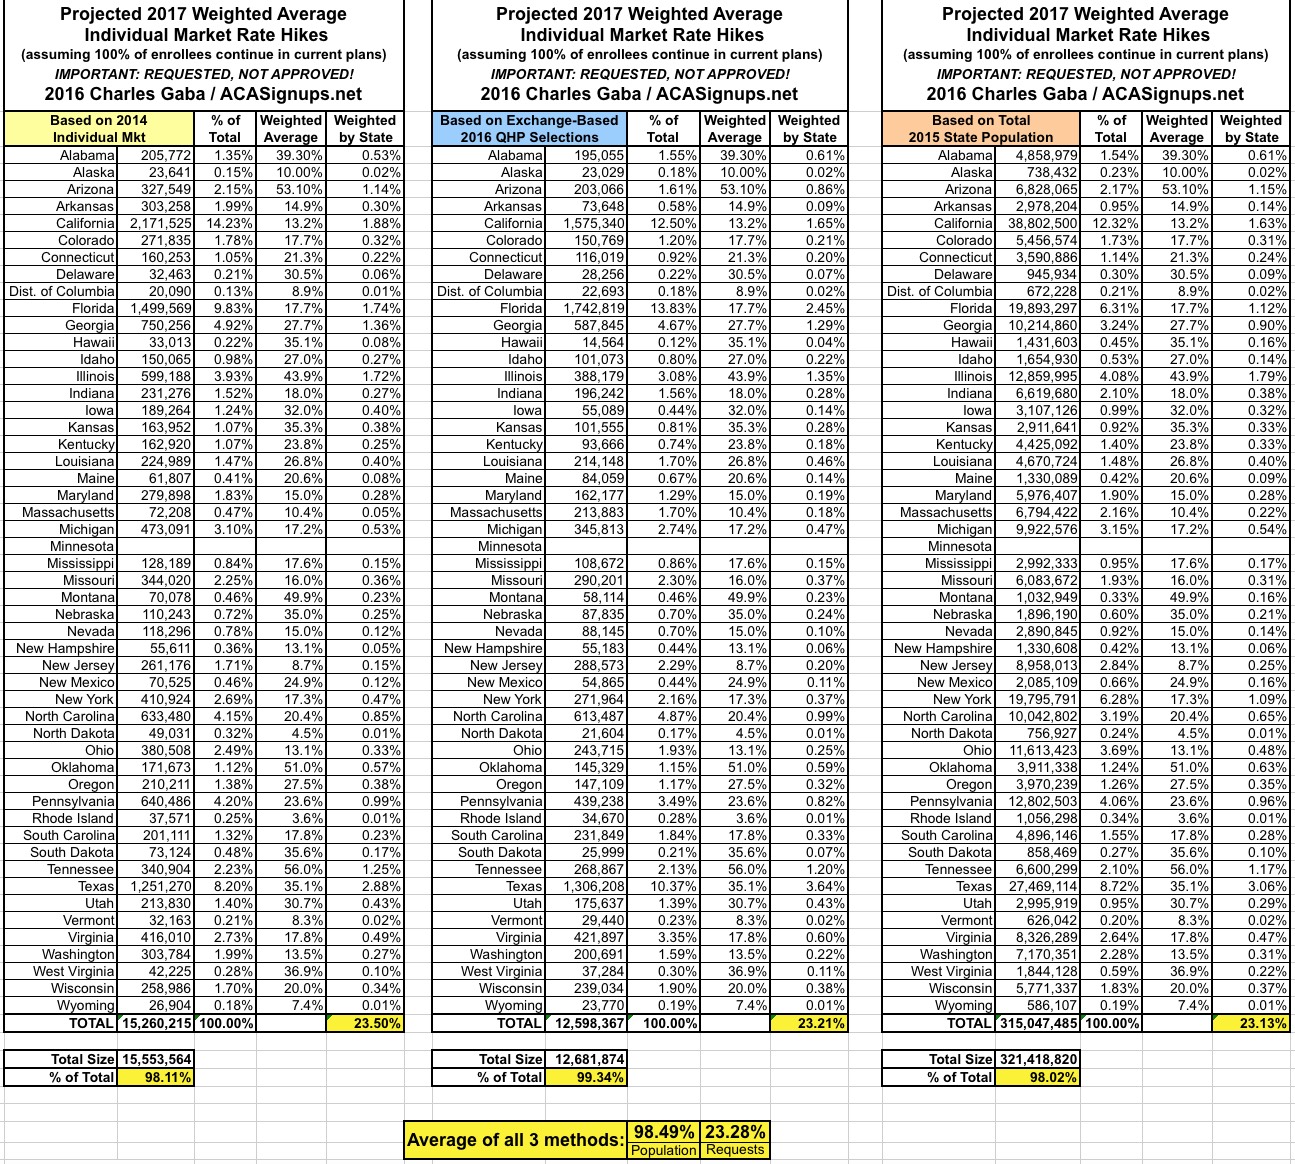
UPDATE 8/07/16: I've added Mississippi to the table, which means there's only one state missing: Minnesota.
Mississippi is coming in somewhat lower than most other states, but it's also less than 1% of the total population so it barely moves the needle at this point; the national average remains 23.3%.
UPDATE 8/8/16:
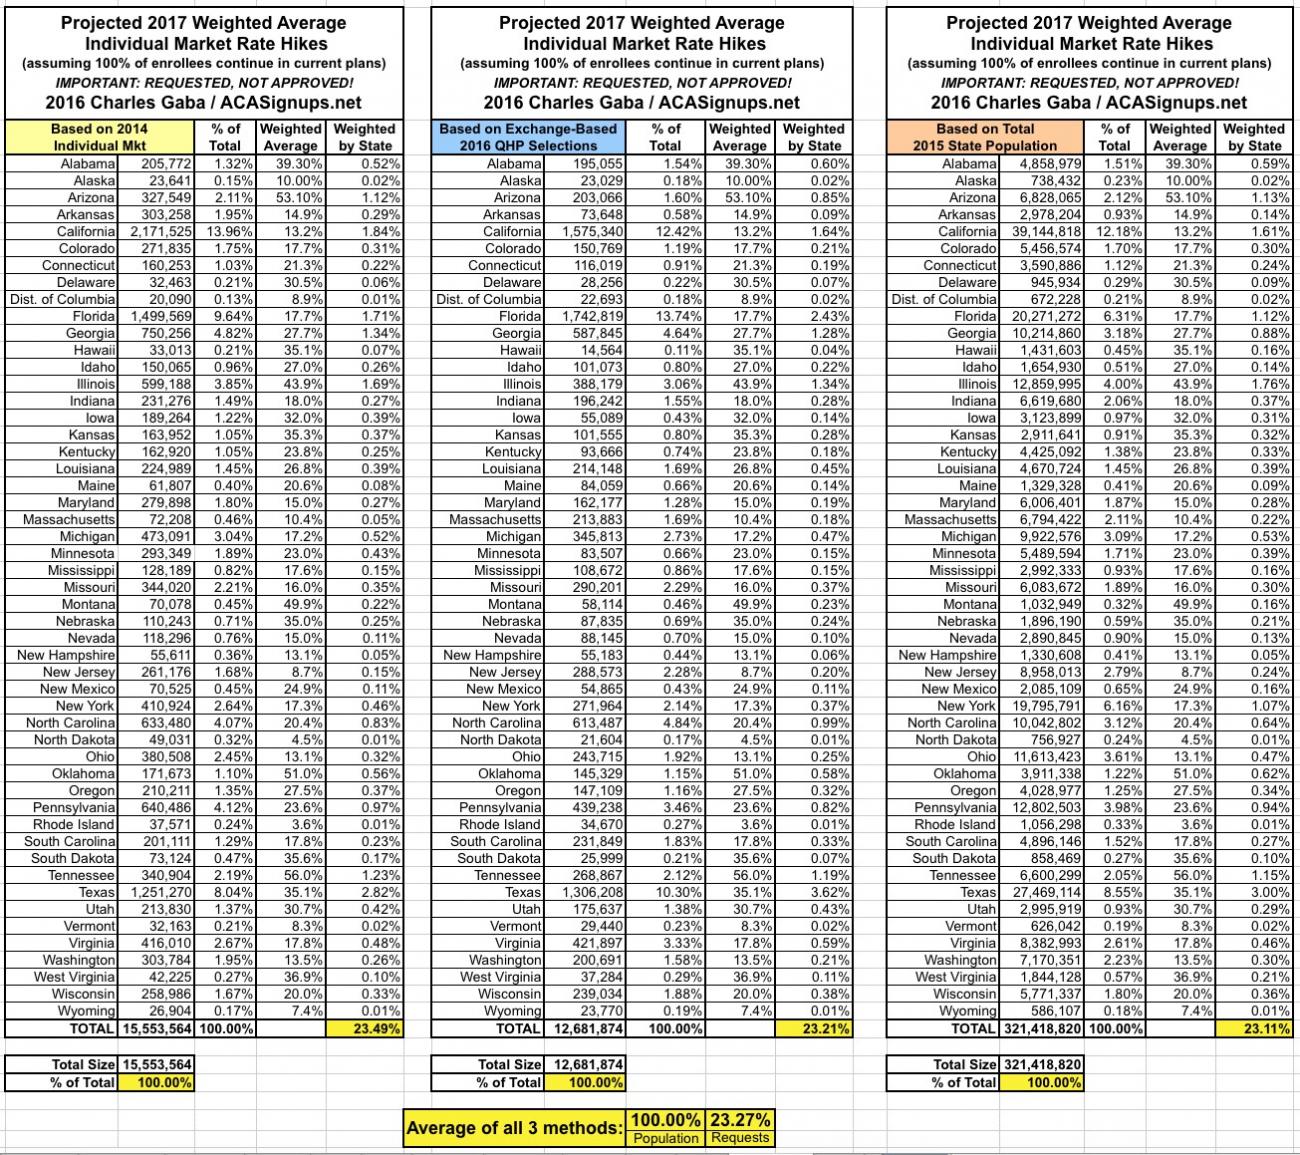
I've confirmed that Minnesota won't be posting their requested rate hikes publicly until September 1st (and their approved rates won't come out until October 1st). Therefore, I've had to cobble together a very rough estimate based on speculation by a couple of people knowledgable about the Minnesota health insurance industry...which just happened to result in a ballpark guesstimate of the same 23% that the rest of the country is averaging overall.
Some of the averages below may have already jumped around a bit since first being estimated due to carriers dropping out, jumping in, adding/subtracting county participation or dropping/restructuring the plans they're offering...but in general, 23% seems to be the number to look at for requested increases overall. Now it's up to the state regulators to either approve or change those requests...
Advertisement
