

Q1 Effectuation Report: Odds 'n' Ends
Fri, 07/01/2016 - 1:27pm
Last night I wrote a pretty extensive post about the Q1 2016 ACA Exchange Effectuated Enrollment Report, which breaks out the effectuated enrollment numbers as of the end of March. This is a follow-up post with some additional oddball items of interest. I'll probably add some things, so check back later for updates.
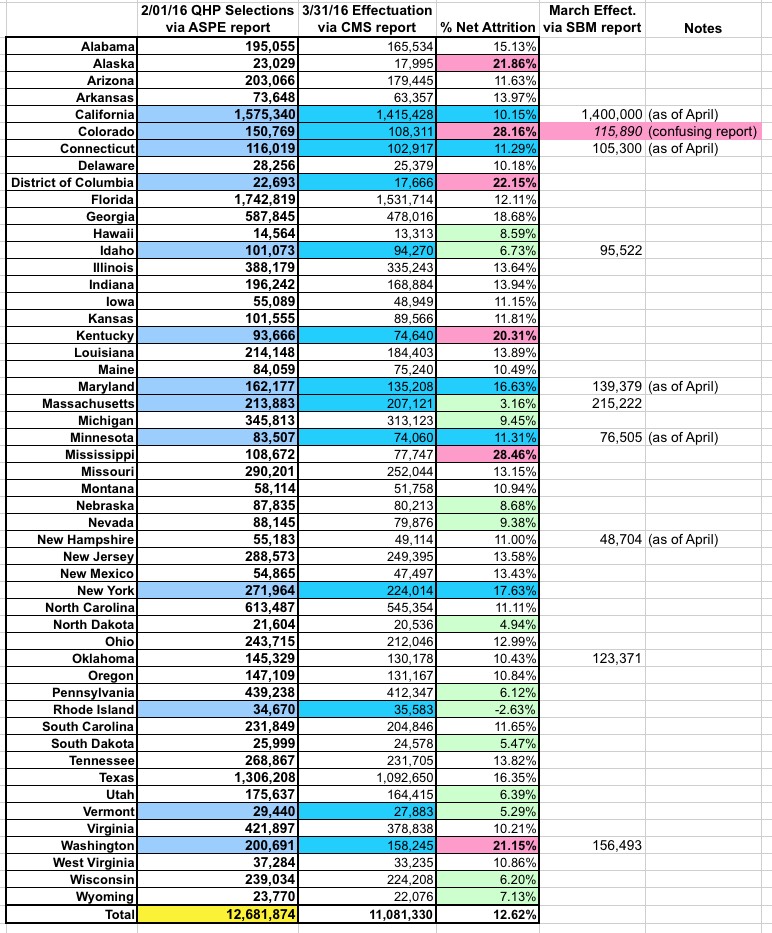
First up: While the national net attrition rate from the end of open enrollment through the end of March was around 12.6% (11.08 million vs. 12.68 million), the drop-off rate ranged widely state to state. Here's a table breaking this out. The net attrition is over 20% in 5 states and DC and between 15-20% in 5 more states, but is under 10% in 14 states. In fact, Rhode Island saw a net increase in effectuated enrollees from January through the end of March.
The other thing to note here is that there are some discrepancies between the official federal CMS report and the assorted state-based exchange reports. Some of these were as of April, not March, so it's not strictly an apples-to-apples comparison. The only one which really stands out to me is Colorado, although this isn't surprising given my repeated posts about how confusingly laid out their monthly enrollment reports are.
2016 Data Matching
In operating the Marketplace, we are committed to providing access to coverage and financial assistance to individuals and families who are eligible while maintaining strong program integrity protections. Throughout 2014, 2015, and into 2016, the Marketplace has worked to resolve consumers’ data matching issues, including for those individuals whose citizenship, immigration status, or household income application information did not match information in our trusted data sources.For various timing and operational reasons, data matching actions were more concentrated in the first quarter during 2015 than they are likely to be this year. Thus, we do not expect a comparable reduction in data matching issues going forward. Nonetheless, with such a strong start, we do anticipate substantial progress for the year as a whole.
The Marketplace takes regular, monthly action for consumers with unresolved data matching issues who have not provided adequate documentation within 95 days for citizenship or immigration status data matching issues and within 90 days for household income inconsistencies. Consumers who do not submit sufficient documentation to resolve their annual household income data matching issue will have a recalculation of their APTC and/or CSRs based on available tax data. Individuals who have not provided the necessary documentation for their citizenship or immigration status will have their enrollment through the Marketplace terminated. Those individuals whose enrollment through the Marketplace was terminated because of citizenship or immigration status data matching issues are not included in effectuated enrollment totals.
During the time period from January 1, 2016 to March 31, 2016, enrollment in coverage through the Federally-facilitated Marketplace was terminated for about 17,000 consumers with unresolved citizenship or immigration status data matching issues. During the same time period, 73,000 households with unresolved annual household income data matching issues had their APTC and/or CSRs for 2016 coverage adjusted. Compared to the first quarter of last year, this represents an 85 percent decrease in the number of consumers whose coverage ended because of an unresolved citizenship or immigration data matching issue, and a 69 percent decrease in households with income data matching issues who had their advanced payment of the premium tax credit and/or their cost sharing reduction adjusted.
If consumers believe they have the appropriate documentation but their enrollment through the Marketplace was terminated based on a citizenship/immigration status data matching issue, they are able to submit their documentation to the Marketplace to resolve the data matching issue and regain enrollment through the Marketplace through a Special Enrollment Period.
This is very impressive, actually. Remember that in 2015, about 112,000 people got kicked off their HC.gov plans for legal residency reasons, and another 240,000 or so had their APTC/CSR messed with due to income data screwups, so this speaks well of CMS's ability to improve/streamline the system.
Addendum Report: Special Enrollment Period Sign ups in 2015
In the Health Insurance Marketplace, most consumers select a plan during the annual Open Enrollment Period. Consumers who experience one of six types of life events can also select a plan during a special enrollment period. For states on the HealthCare.gov platform during 2015, 1.6 million individuals who did not select a plan during open enrollment made a plan selection through a special enrollment period (SEP).
1.6 million SEP enrollments via HC.gov means appx. 2.1 million nationally (HC.gov covers about 76% of all exchange enrollments). The off-season period last year technically ran from 2/23/15 - 11/15/15 (yes, the 2016 open enrollment period started on 11/01, but people who needed 2015 coverage for December only could still sign up as late as Nov. 15th). That's 266 days. Divide 2.1 million by 266 and you get an average of 7,900 off-season QHP selections per day. This is about 10% lower than my own estimate of 8,700/day, but I was still pretty close.
The majority of these consumers (60 percent) received a special enrollment period for loss of minimum essential coverage. This means the consumer enrolled in Marketplace coverage after losing other health insurance, like coverage from their job. In addition, 18 percent of SEP plan selections were made by consumers who initially applied for coverage during open enrollment but needed to receive an eligibility determination from their state Medicaid agency before they could be determined eligible for Marketplace coverage and/or financial assistance. The tax season SEP for 2015 accounted for 9 percent of SEP plan selections. The tax SEP was not available for 2016. Finally, small numbers of consumers enrolled for other reasons, including birth, adoption, marriage, a move, or other circumstances.
These figures include only consumers who did not have a plan selection during open enrollment; a consumer who enrolled during open enrollment and used an SEP to change plans is not reflected here.
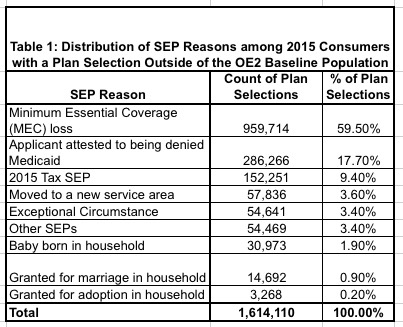
Only 152,000 people signed up via the 2015 #ACATaxTime SEP via HC.gov, plus an additional 62,000 via the state exchanges, for a total of around 214,000 nationally. This is one of the reasons why they decided not to offer a "tax filing season" SEP again this year; in spite of all the cries for it last year, a relatively small number of people took advantage of it.
Last year, SEPs made up appx. 15.2% of total annual QHP selections nationally (2.1M / 13.8M). If you subtract the #ACATaxTime, this drops to 14% (although some of those 214K would presumably have qualified for a different SEP anyway).
Assuming a similar ratio this year, there should be a similar 2.1 million off-season SEP QHP selections, for something along the lines of 14.75 million total for the year...or around the same 7,900/day SEP average. We'll see if this year's crackdown on SEP verification has any impact on that average, but won't know that for quite some time.
Advertisement
