New Treasury Dept. Report: Nearly 50M Americans have been enrolled in ACA exchange coverage at some point or another

Number of People Who Have Ever Enrolled in ACA Marketplace Coverage, 2014-2024
The Affordable Care Act (ACA) created Health Insurance Marketplaces in all states starting in 2014. Eligible partcipants can purchase individual health insurance plans in the ACA Marketplaces, and qualifying individuals can receive Premium Tax Credits (PTC) to help offset the cost of coverage. The PTC was expanded in both generosity and eligibility startng with the American Rescue Plan Act in 2021, with these enhancements extended in the Inflaton Reducton Act in 2022. The ACA Marketplaces enable Americans to purchase comprehensive, affordable health insurance that they may not have access to through their employers or through programs such as Medicare or Medicaid, including when they experience brief or longer-term gaps in the availability of other coverage.
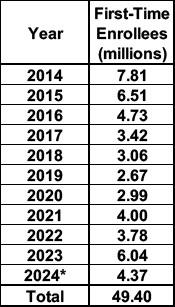
Over roughly the first decade in which the ACA Marketplaces were in place, from January 2014 through May 2024, 49.4 million unique individuals had ACA Marketplace coverage at some point. Nearly 1 in 7 U.S. residents in 2023 have enrolled in an ACA Marketplace plan at some point since 2014.
As explained in more detail in the Methodology secton below, we estmate the number of unique individuals ever covered through the ACA Marketplace using various tax data.
How many people were enrolled in ACA Marketplace health coverage in 2023 and 2024?
The Centers for Medicare & Medicaid Services (CMS) reports that on average, 16.2 million total individuals had effectuated ACA Marketplace coverage in 2023, meaning they have an actve policy and paid their premium.1 Ater a historic 2024 Open Enrollment period, effectuated enrollment for February 2024 was 20.8 million, the highest point-in-tme enrollment observed to that date.
How many people have ever been covered by an ACA Marketplace policy?
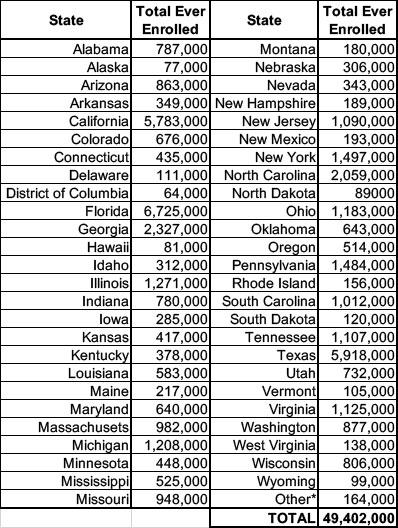
Between January 2014 and May 2024, 49.4 million unique individuals obtained ACA Marketplace coverage. As shown in Table 1, the number of first-tme enrollees is highest in 2014, the first year in which individuals could purchase ACA Marketplace coverage following the law’s passage in 2010. The number of first-tme enrollees then decreases each year from 2014 through 2019, and rises slightly in 2020, the year the COVID-19 pandemic began. It then increases more robustly ater the 2021 PTC expansion under the American Rescue Plan Act. Table 2 presents these results by state.
The data is drawn from Form 1095, Exchange Periodic Data (EPD), Form 1040, and other information returns including W-2s. Further detail can be found in Lurie and Pearce (2021).
* 2024 is enrollment as of May and does not include 2024 data for MA, VA, or WA.What percent of current US residents have ever enrolled in an ACA Marketplace policy?
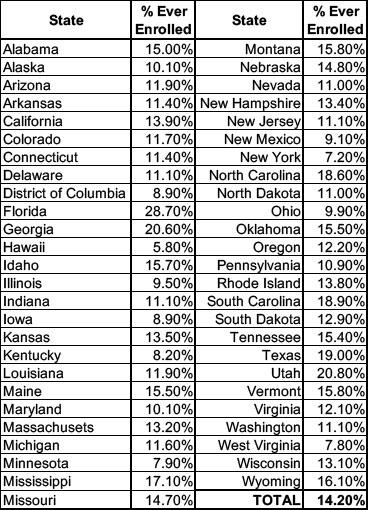
Of US residents in 2023, we estimate that 14.2%, or nearly 1 in 7, have enrolled in an ACA Marketplace plan at some point in time. Of the 49.4 million people ever covered through the ACA Marketplace, 47.6 million were alive and living in the U.S. as of 2023, compared to a U.S. Census Bureau estimate of 334 million U.S. residents. The total U.S. population in 2023 includes some people who were already age 65 or older as of 2014, generally making them ineligible for subsidized ACA Marketplace coverage; adjusting to remove that group would increase the estimated ACA Marketplace utilization rate.
As shown in Table 3, enrollment rates vary greatly by state. A key driver of state variation is whether states have expanded Medicaid: in general, people with incomes between 100 and 138 percent of the poverty level are covered by the ACA Marketplace in non-expansion states, versus Medicaid in expansion states. On average, 20% of the population in non-expansion states have enrolled in an ACA Marketplace plan at some point in time, compared to 12% of the population in expansion states (11% in states that took up expansion at the start of 2014). Other state policies also impact ACA Marketplace take-up rates.
For example, Minnesota and New York, two of the states with the lowest share of their populations ever covered through the ACA Marketplace, offer coverage to moderate-income residents through Basic Health Programs rather than the ACA Marketplace. Additional state variation reflects state income and age distributions, variations in ACA Marketplace outreach and awareness of ACA Marketplace coverage, and other factors.
Methodology
To estimate the number of individuals with ACA Marketplace coverage at any point, we use tax data from the Internal Revenue Service (IRS). We create health insurance coverage data files, which draw from IRS Forms 1095, Exchange Periodic Data, Form 1040, and other information returns submited to the IRS. We then categorize these unique enrollees by the year of their first enrollment and by the state of residence of their filing address in that tax year, reported in Tables 1 and 2, respectively. If a participant in a plan did not file taxes for that year, we supplement addresses with additional information returns, such as W-2s issued by employers.
We identify individuals enrolled in ACA Marketplace plans, whether subsidized or unsubsidized, using Form 1095-As (information returns issued by the ACA Marketplace and provided to the IRS) and ACA Marketplace Periodic Data (files sent by the ACA Marketplace directly to IRS to track enrollment on a monthly basis). These data allow us to identify all enrollees in ACA Marketplace plans. Further details on this approach can be found in Lurie and Pearce (2021).
In Table 3, we identify the share of the population ever covered on the ACA Marketplace (nationally and by state). To do so, we restrict the sample to individuals who are alive and living in the US in 2023 and compare the number of such individuals ever covered by an ACA Marketplace plan to the 2023 U.S. Census estimated population. State is assigned by 2023 tax filing address, using information returns for non-filers.
All taxpayer data used in this research was kept in a secured IRS repository, and all results have been reviewed to ensure that no confidential information is disclosed.
Table 2: Estimated number of people who have ever enrolled in ACA Marketplace health insurance coverage, by state:
The data is drawn from Form 1095, Exchange Periodic Data (EPD), Form 1040, and other information returns including W-2s. Further detail can be found in Lurie and Pearce (2021). State is defined by a taxpayer’s address in IRS data corresponding to the tax year in which they first enrolled in ACA Marketplace coverage. Numbers are rounded to the nearest 1,000.
* “Other” includes individuals who enrolled on the ACA Marketplace during a tax year, then moved to an address outside of the US by the time of tax filing the following year.
Table 3: Estimated percentage of population who have ever enrolled in ACA Marketplace health insurance coverage , by state:
The data is drawn from Form 1095, Exchange Periodic Data (EPD), Form 1040, and other information returns including W-2s. Further detail can be found in Lurie and Pearce (2021). State is defined by a taxpayer’s address in IRS data for tax year 2023 and compared to U.S. Census Bureau estimates of state population for 2023. Excludes individuals who died before 2023 or for whom their address in IRS data is outside the 50 states and DC.
How to support my healthcare wonkery:
1. Donate via ActBlue or PayPal
2. Subscribe via Substack.
3. Subscribe via Patreon.


