

Happy Birthday #ACA! (Part 5: Demographics & Dental Plans)
Thu, 03/21/2024 - 7:52pm
Part 1 | Part 2 | Part 3 | Part 4 | Part 5 | Part 6 | Part 7
Next up: Age brackets, gender, racial/ethnic groups and urban/rural communities. I'm also throwing in the stand-alone Dental Plan table here for the heck of it since I don't know where else to include it.
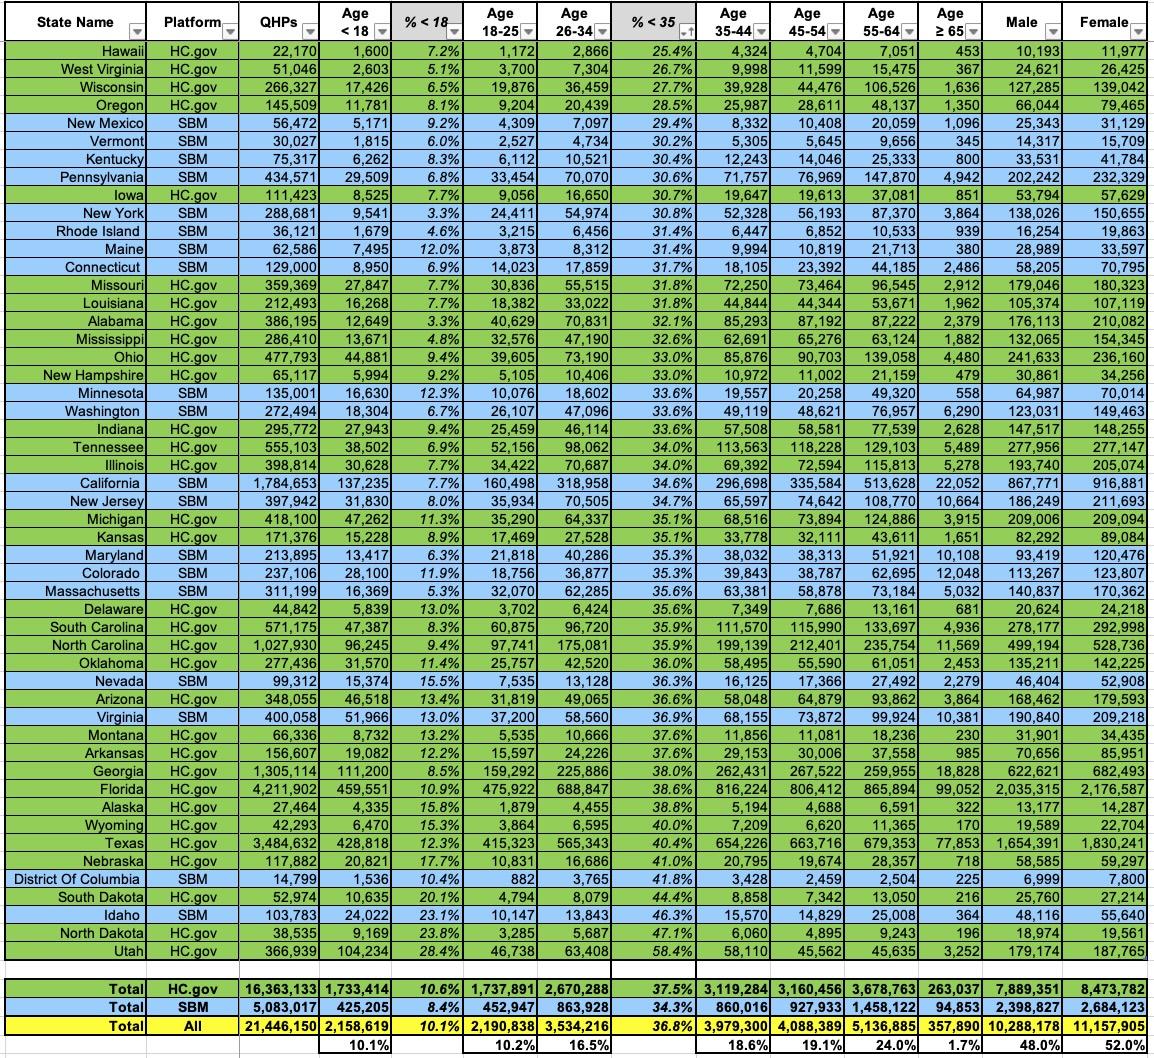
I don't have a ton to say about any of these, really. It's always interesting to me to see that 1.7% of ACA exchange enrollees are 65 or older. Not sure why they aren't on Medicare but I'm sure there are logical reasons.
Alabama and New York have the lowest percent of enrollees under 18 (3.3%), while Utah has the highest (28.4%) which I guess makes sense since Utah has the youngest median-aged population in the country. Similarly, Utah has the highest percent of enrollees under 35 (58.4%) vs. Hawaii's 25.4% (lowest).
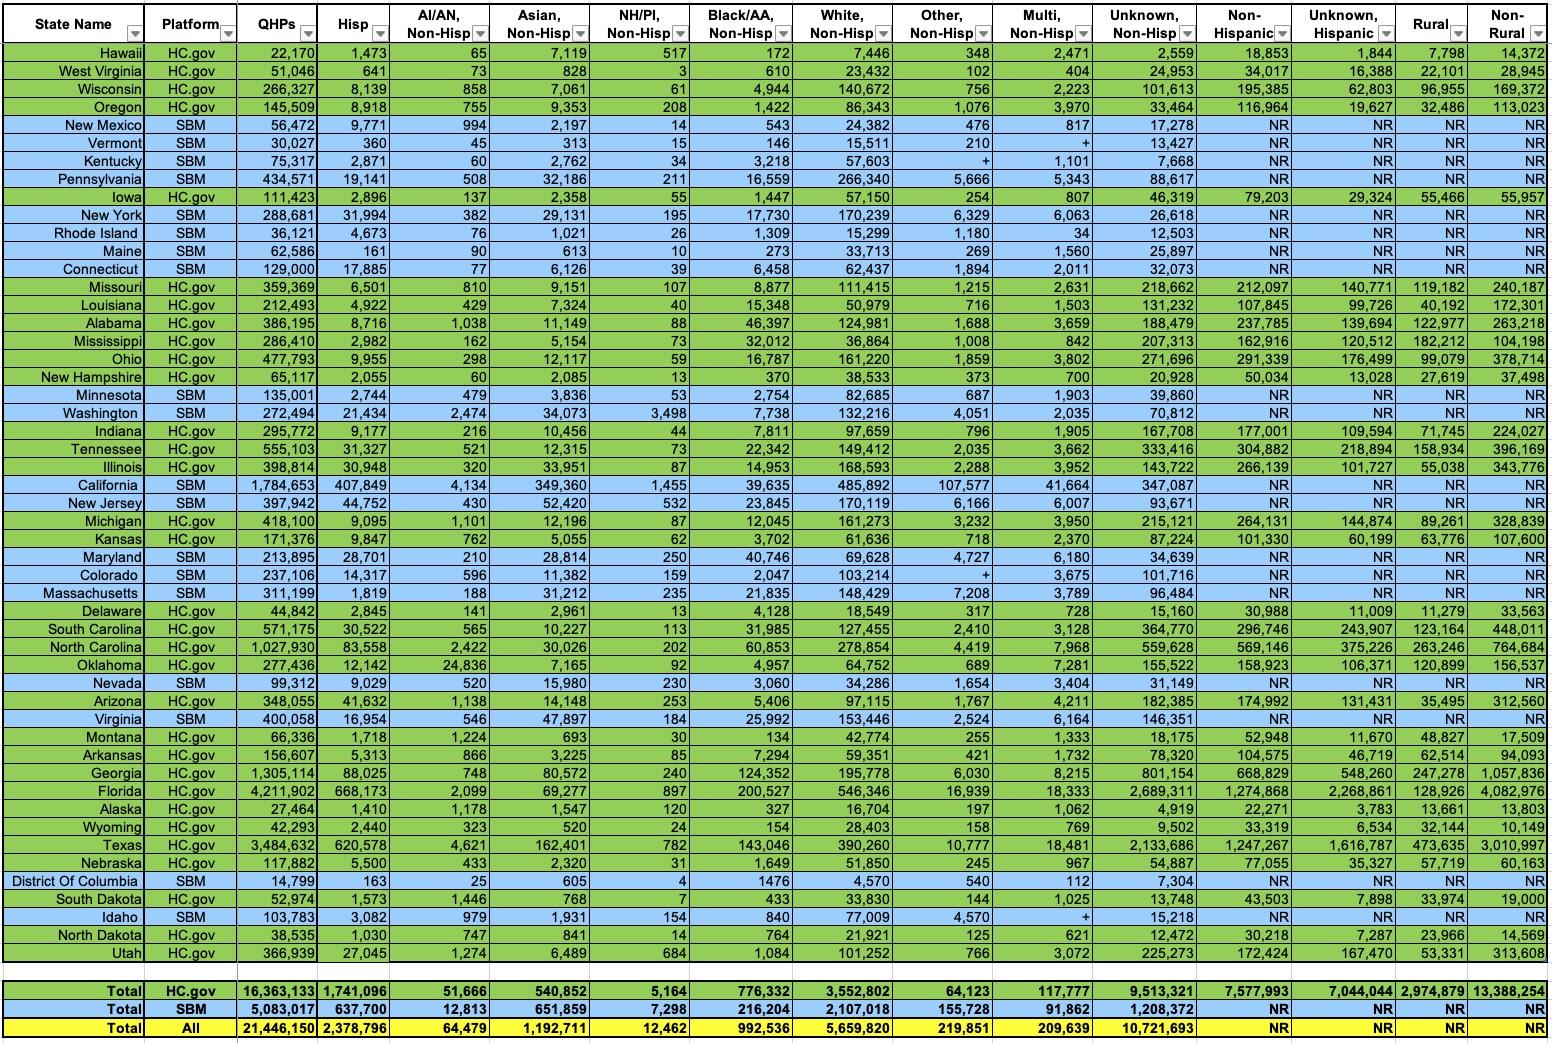
The Hispanic and Rural/Urban data isn't terribly useful at the national level since it isn't reported for any of the state-based exchanges, and even for the racial breakout, fully 50% of all enrollees are listed as "Unknown, Non-Hispanic" which kind of limits any conclusions you might take from any of it.
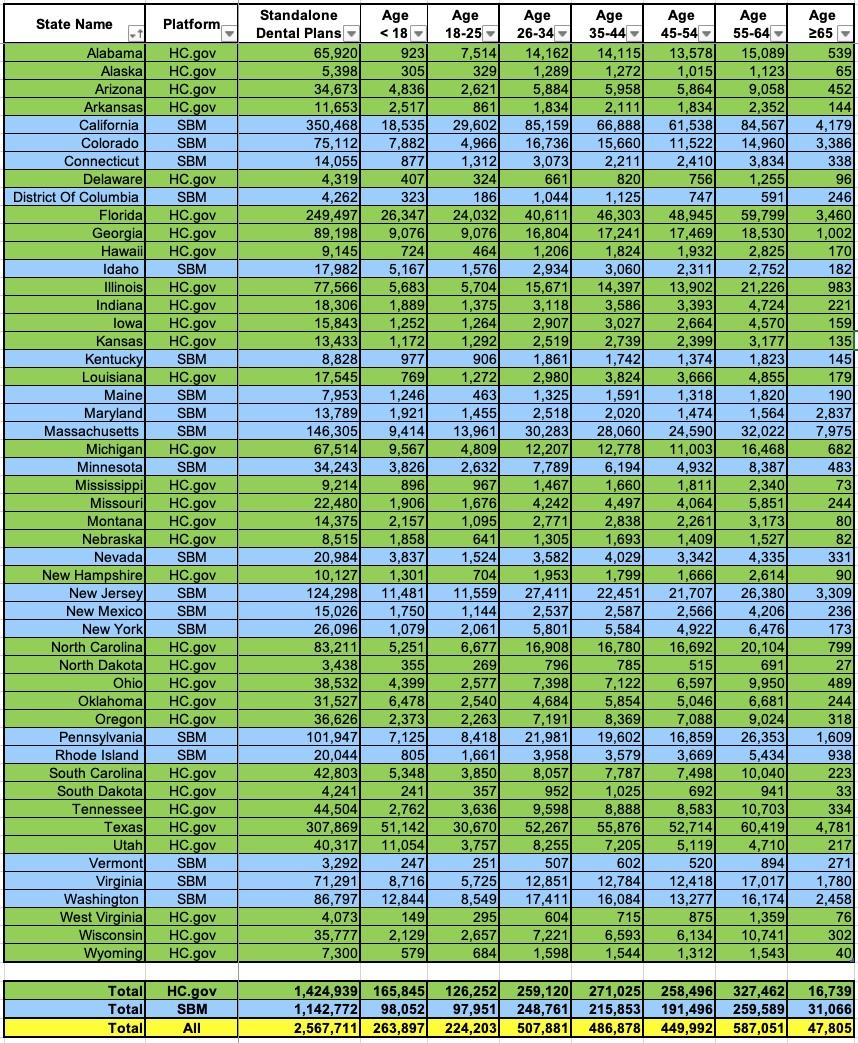
Over 2.56 million Americans selected standalone dental policies, up over 12% from last year.
Advertisement
