

By Congressional District: How much more will #ACA enrollees pay in 2023 if #AmRescuePlan subsidies AREN'T made permanent?
Thu, 06/23/2022 - 10:42am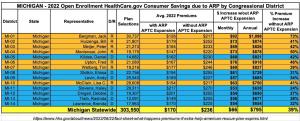
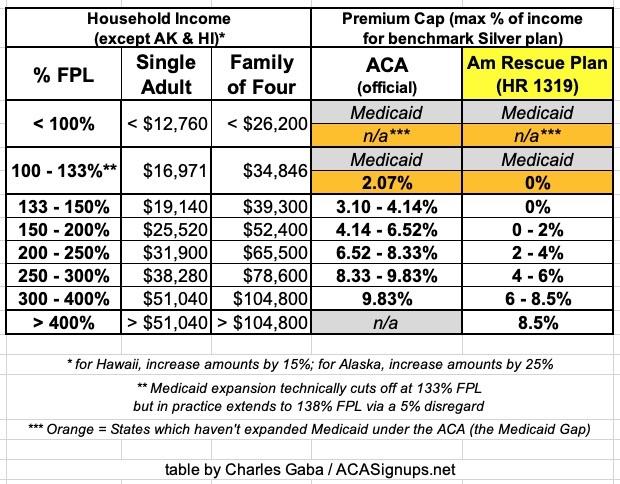
Once again, here's what the Affordable Care Act's premium subsidy tables look like under the original ACA itself and under the American Rescue Plan (ARP). The premium caps are the maximum percent of household income which a household has to pay for the benchmark Silver plan at various income ranges.
The ARP table is currently scheduled to sunset at the end of December, at which point, without legislation passing Congress & being signed into law by President Biden, it will revert back to the original ACA subsidy table:
Yesterday the U.S. Health & Human Services Dept. released a Fact Sheet detailing what will happen if Congress doesn't extend the ARP subsidy table into 2023 and beyond:
On March 11, 2021, President Joe Biden signed a new law (American Rescue Plan) to combat COVID-19 and build our country back better. The American Rescue Plan included subsidies that lower health care costs and expand access to affordable, comprehensive health coverage.
The subsidies helped lower the cost of care by:
Providing additional help with premiums for nearly 90 percent of the 14.5 million consumers that signed up for health coverage on the Health Insurance Marketplaces during the 2022 Open Enrollment Period.™
Making help available, for the first time, to individuals with incomes around $52,000 and $106,000 for a family of four.
Thanks to the American Rescue Plan subsidies:
- A record-breaking 14.5 million people signed up for health insurance coverage through both federal Marketplace (via HealthCare.gov) and State-Based Marketplaces during the recent Open Enrollment period;
- More than 90% of the people on HealthCare.Gov received financial assistance;
- 4 out of 5 people could find plans that cost less than $10 per month on HealthCare.gov; and
- Families saw savings of $67 per person per month in premiums in 2021.
Premiums will skyrocket -- if Congress does not extend American Rescue Plan subsidies
Currently, the ARP premium tax credits are set to expire at the end of 2022.
If Congress does not extend the ARP, HHS analysis projects that:
- Many Health Insurance Marketplace consumers across the country – in rural and urban areas – will likely see substantial increases in out-of-pocket premium costs
- The number of uninsured Americans will increase significantly
- Approximately 3 million Americans could lose their health insurance
- More than 10 million Americans will have reduced premium tax credits or lose them entirely:
- 8.9 million people will have their tax credits reduced (averaging $406 per person, annually)
- 1.5 million people will lose subsidies entirely (averaging $3,277 per person, annually)
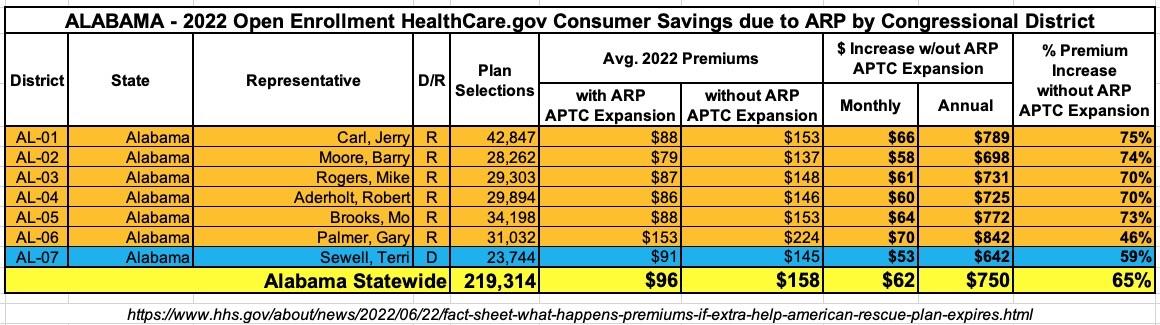
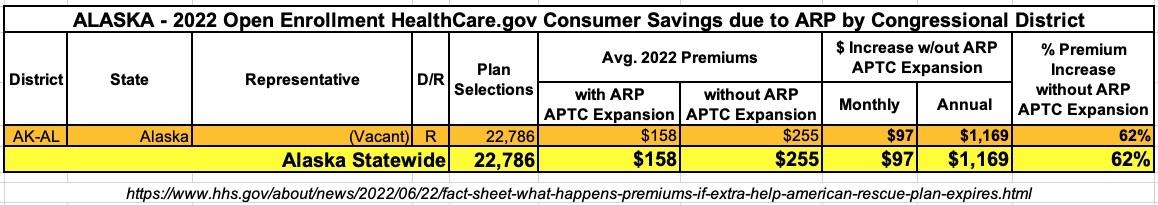
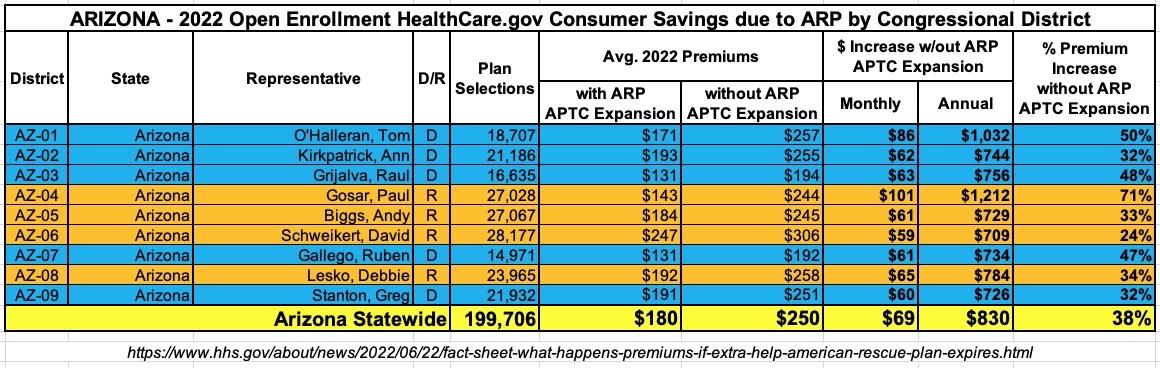
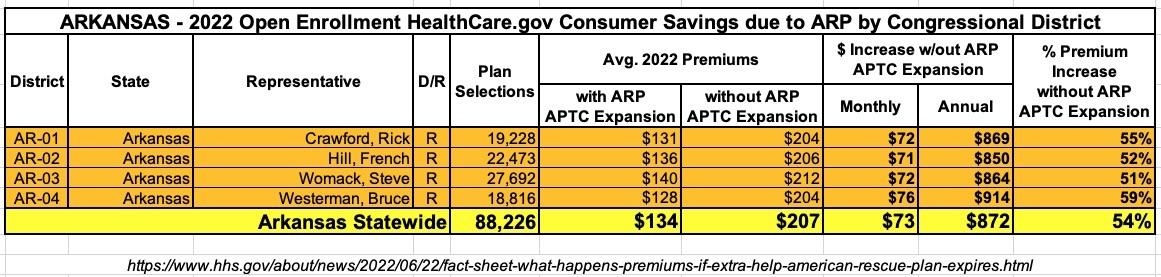
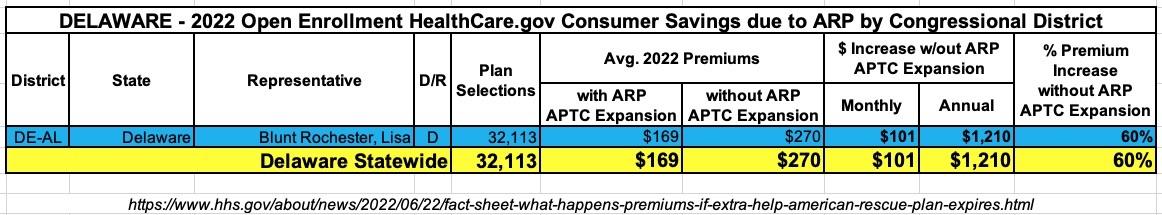
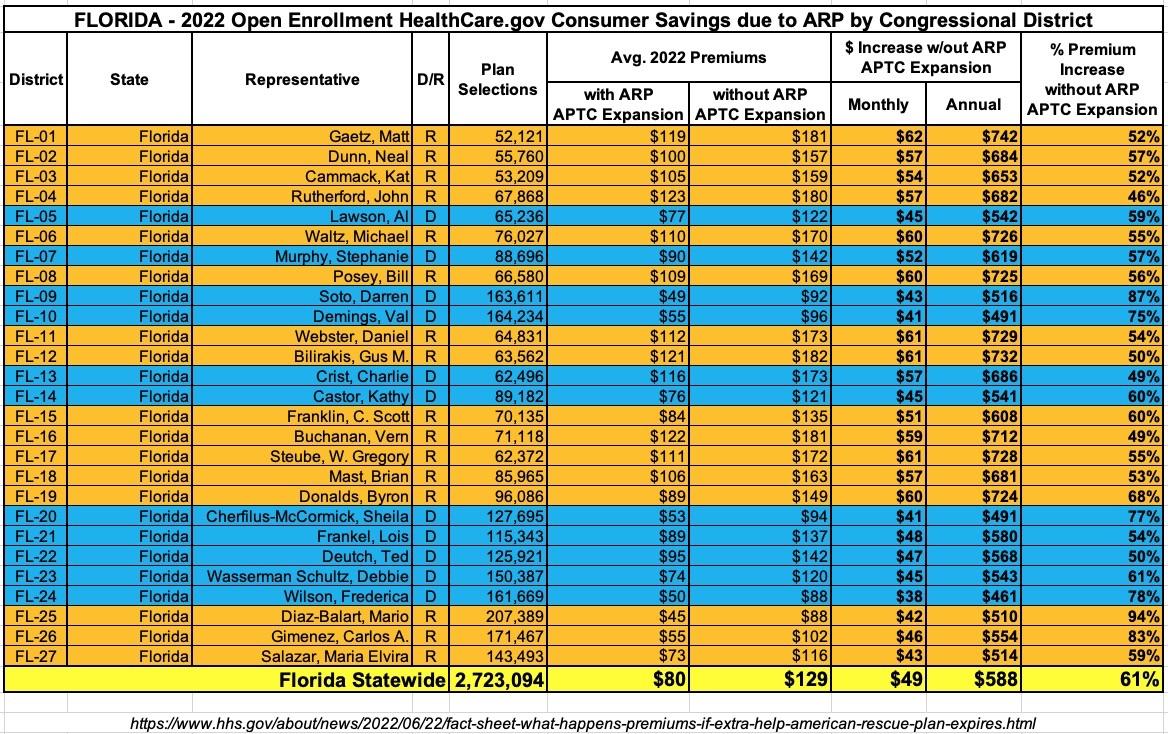
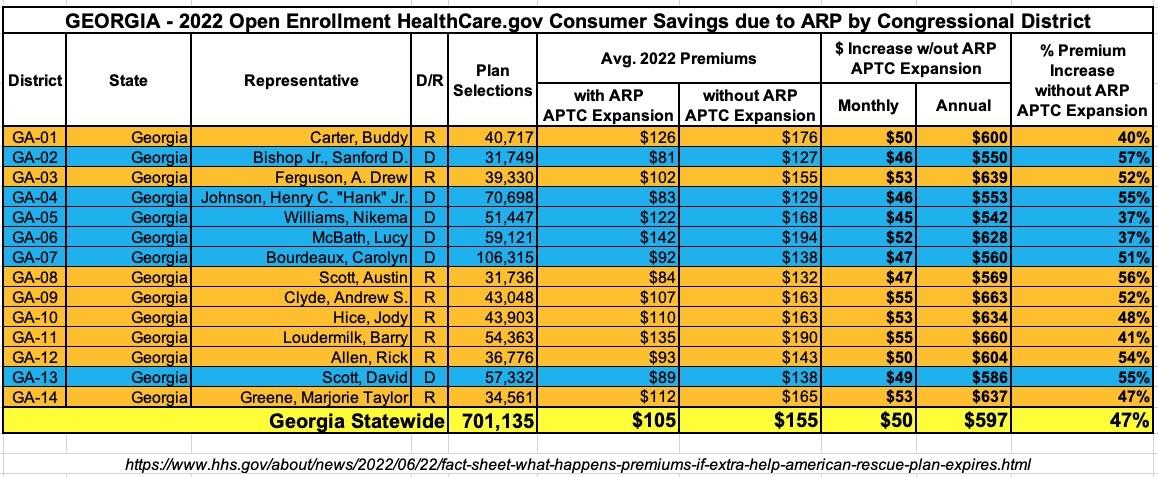
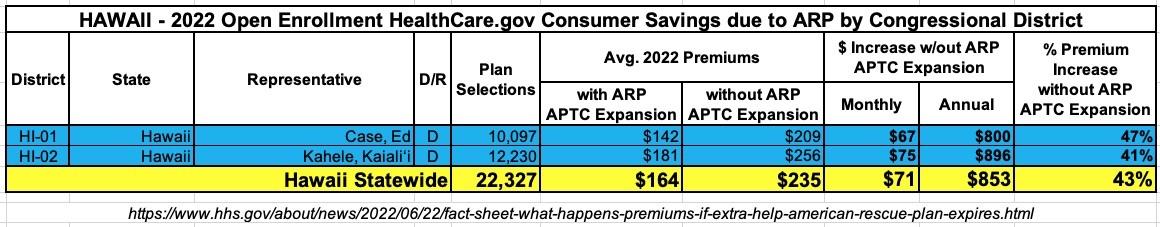
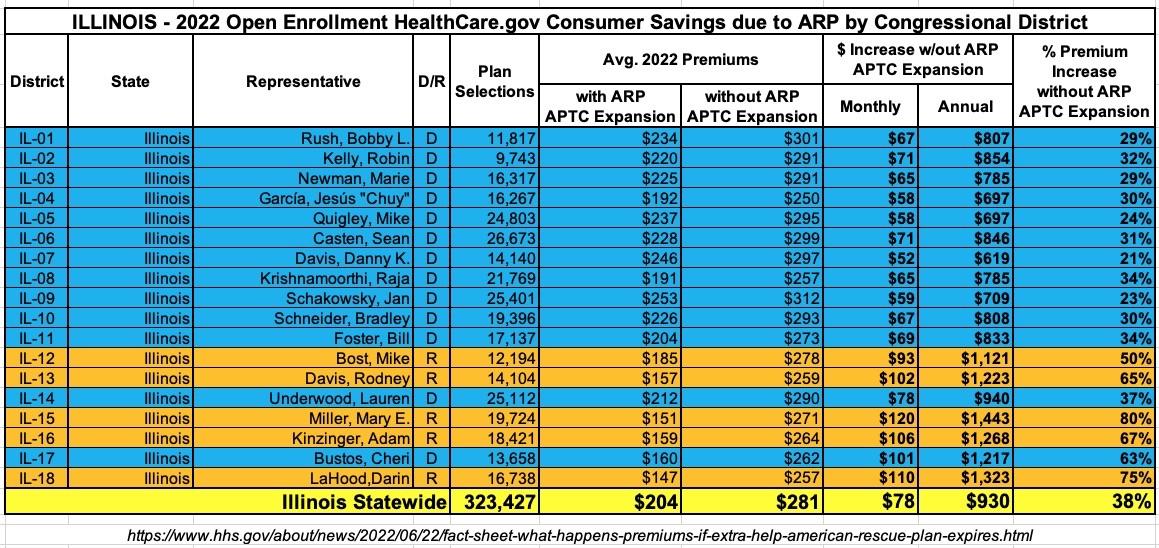
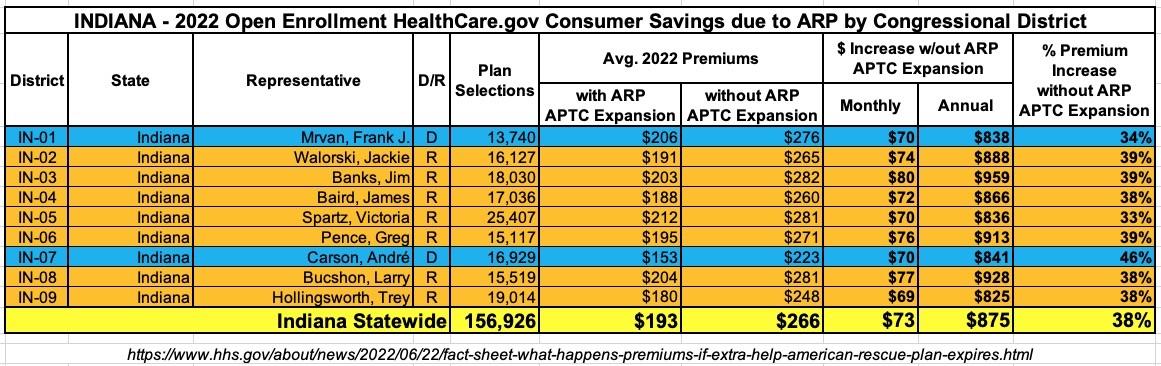
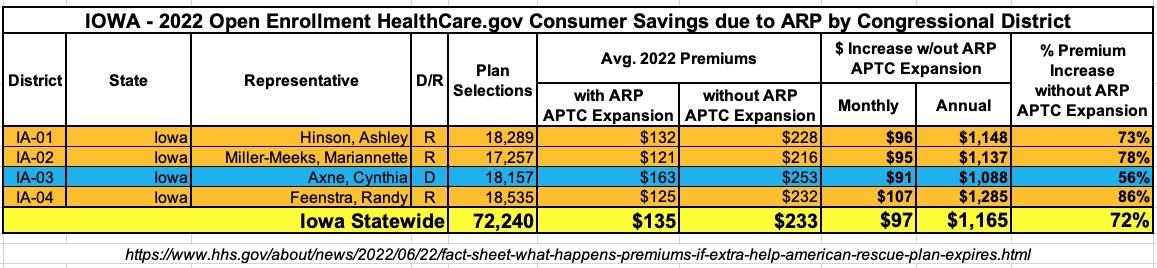
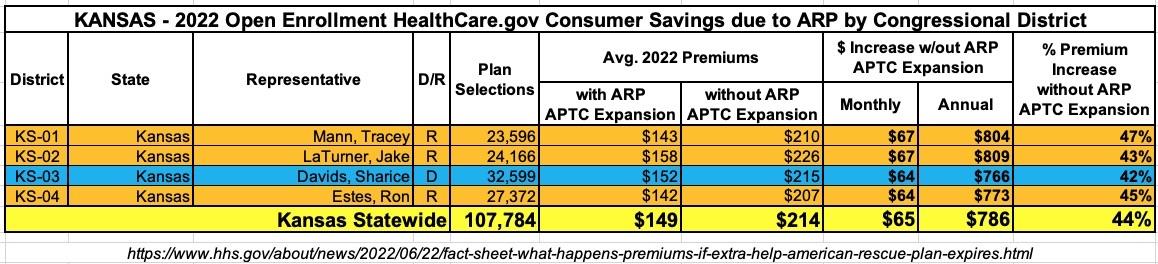
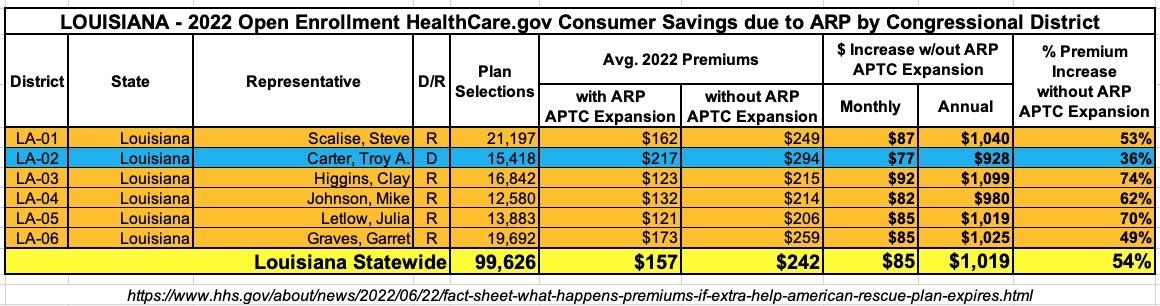
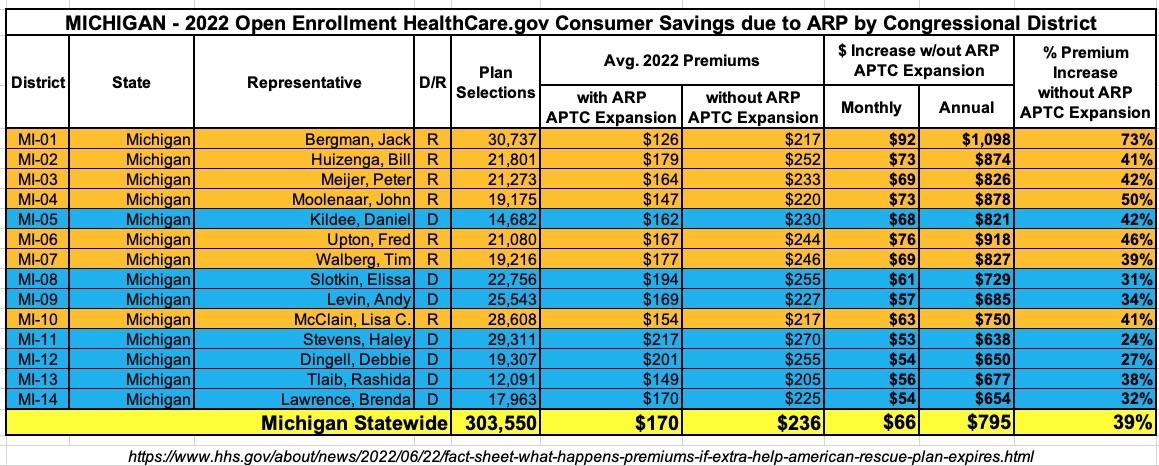
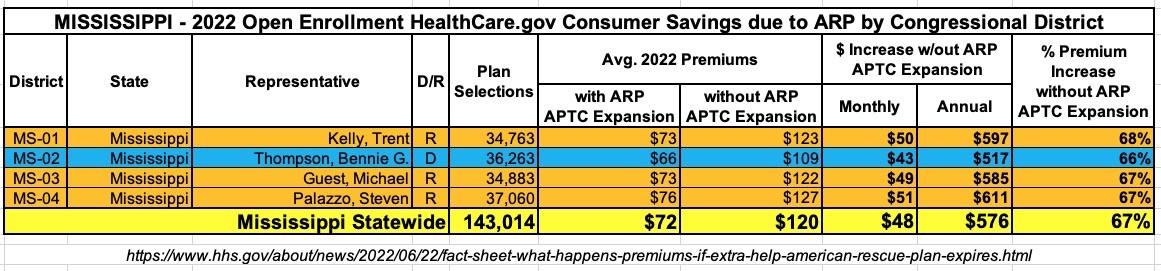
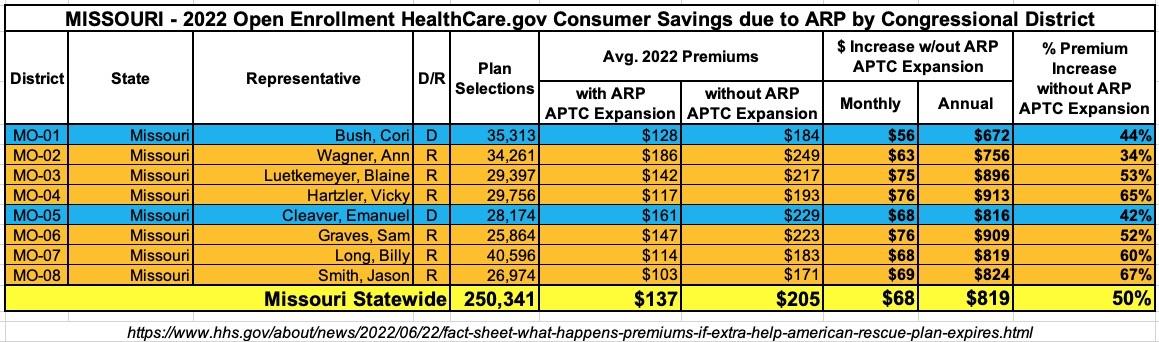
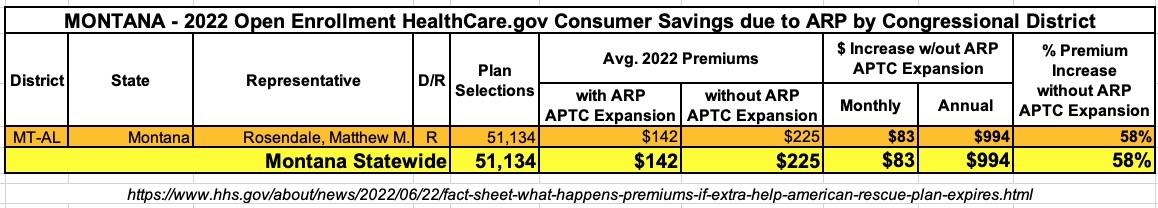
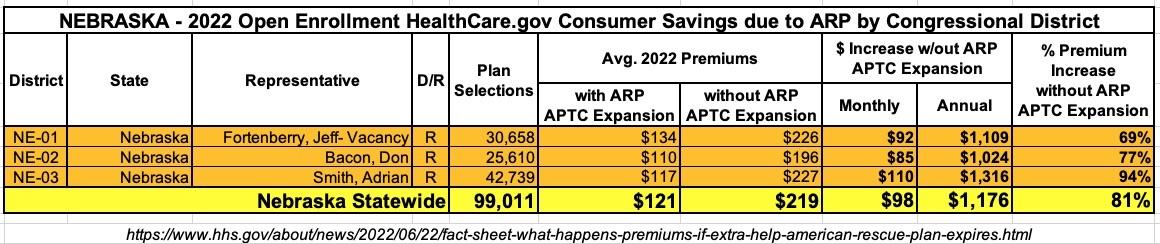
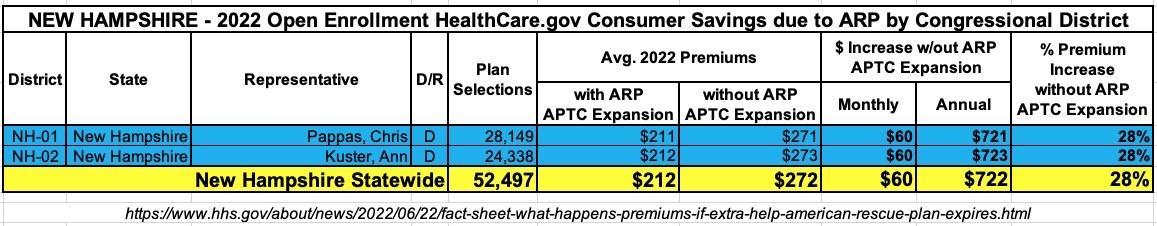
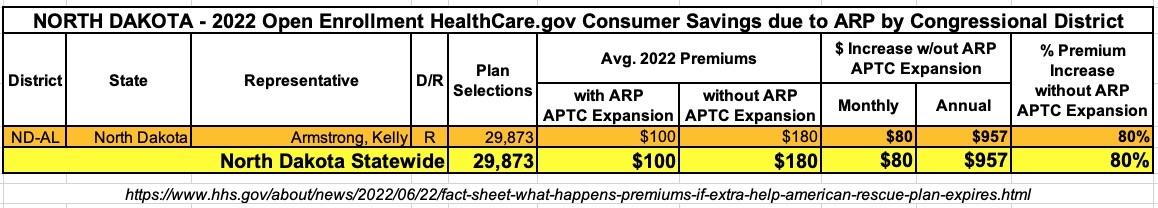
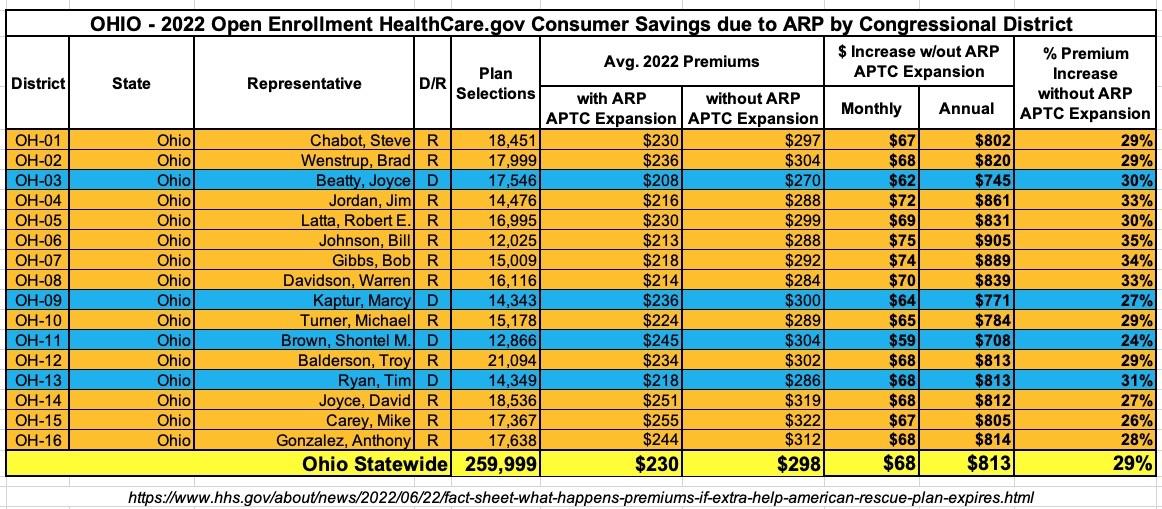
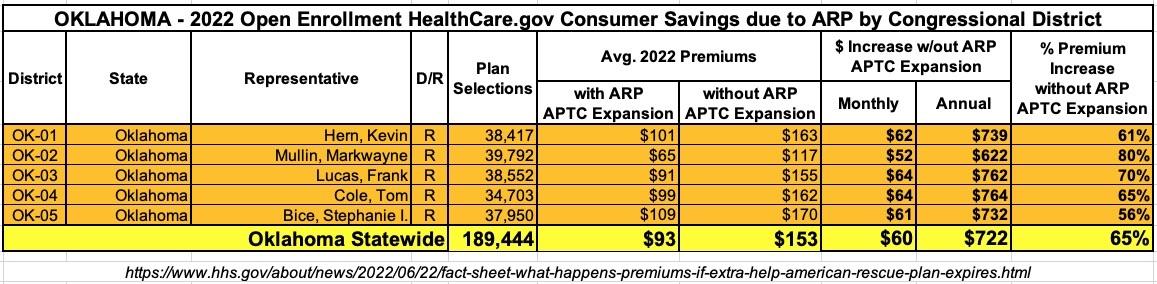
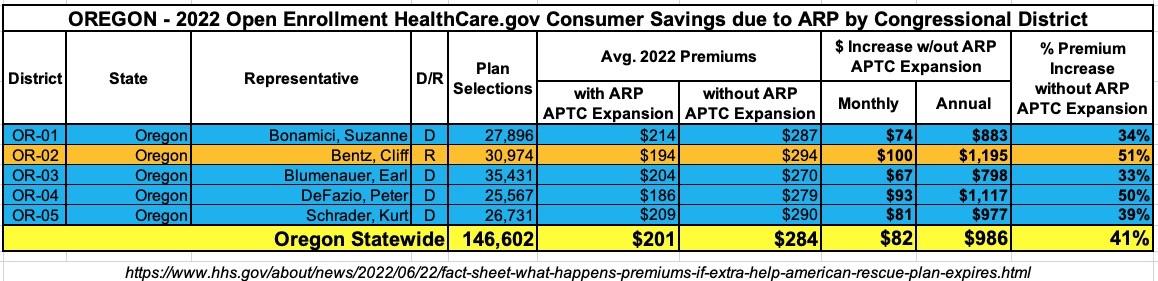
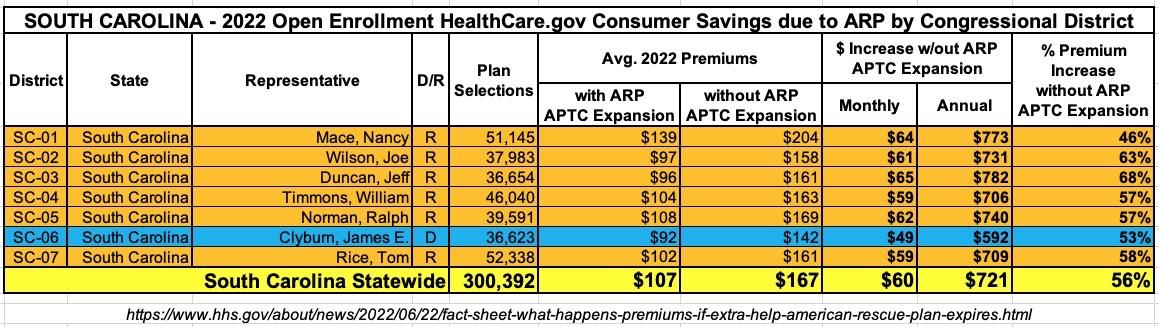
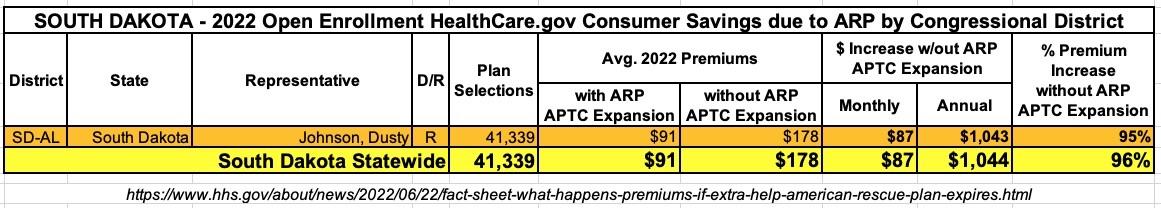
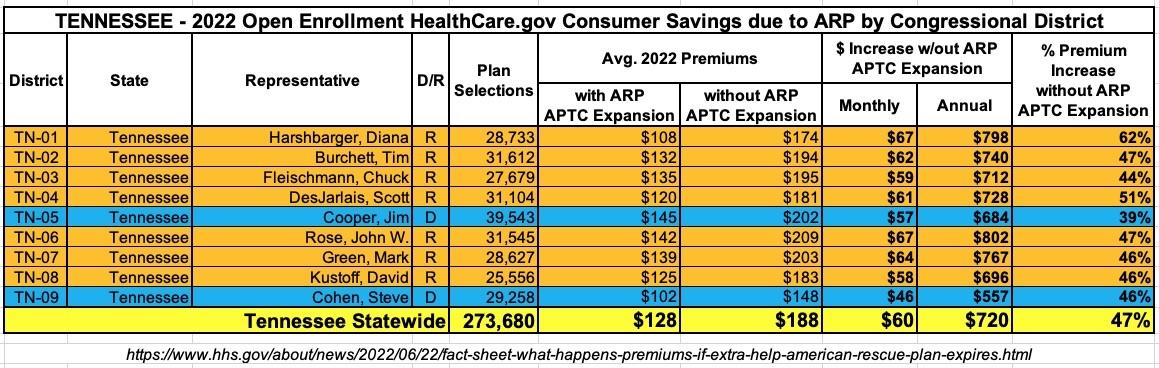
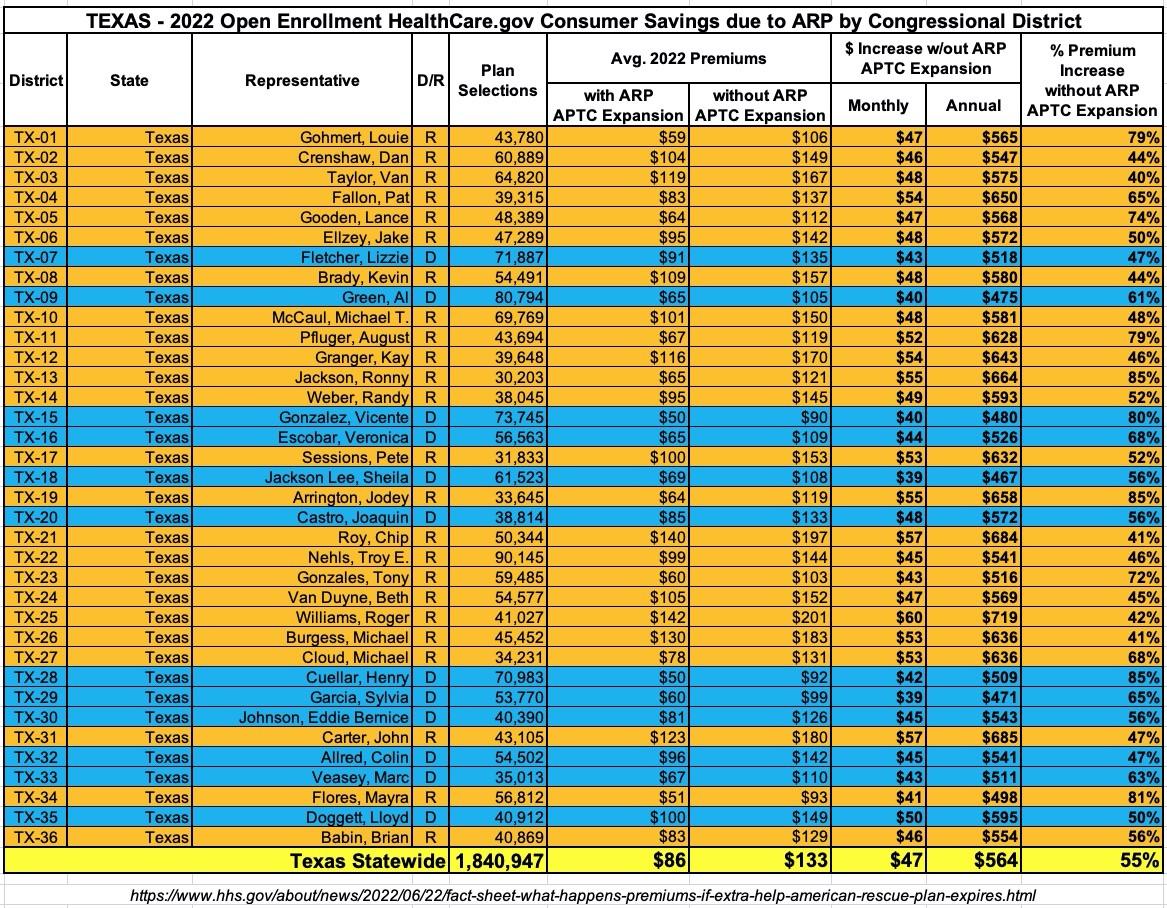
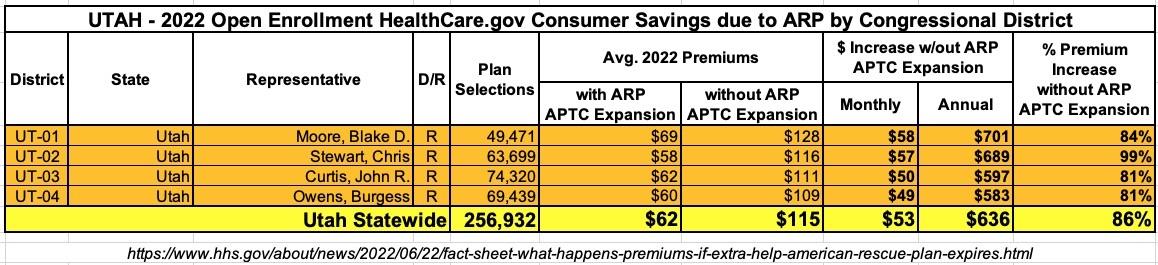
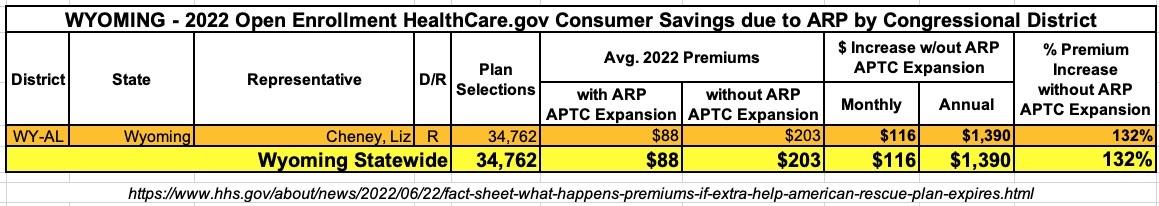
The HHS analysis also includes State- and Congressional District-level breakouts of these projections based on total ACA exchange enrollment during the 2022 Open Enrollment Period.
It's important to note that the Congressional Districts (CDs) are based on the current CD maps, not the new ones drawn after the 2020 Census.
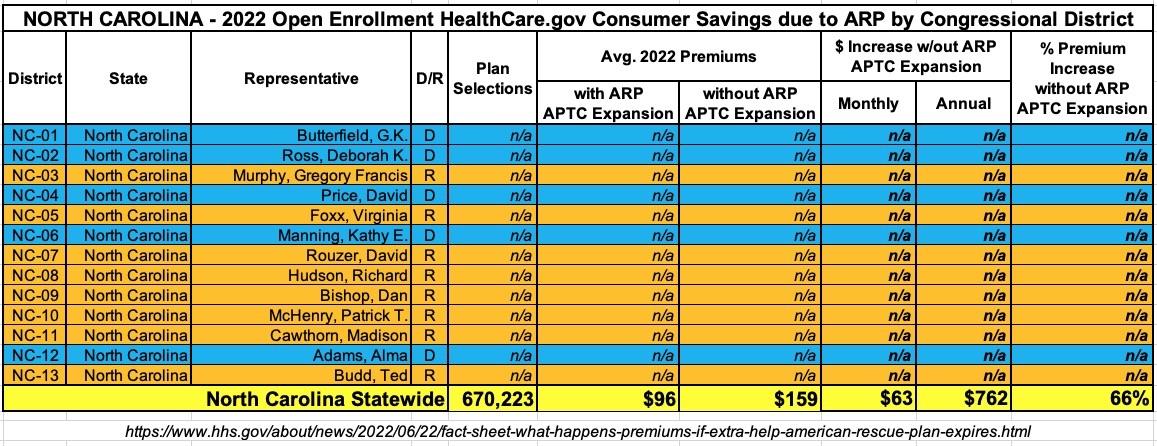
Unfortunately, the State/CD-level breakouts only include the 33 states hosted on the federal ACA exchange platform (HealthCare.Gov), not the 18 states which operate their own ACA exchanges. Even then, North Carolina isn't included because they underwent special redistricting in 2019 which made it impossible for HHS to properly break out the CD of residence of North Carolina ACA exchange enrollees.
Having said all of that, here's what it looks like for the other 32 states...and it's not a pretty picture. I've broken the 245 Congressional Districts included into five image files to make them easier to read & share:
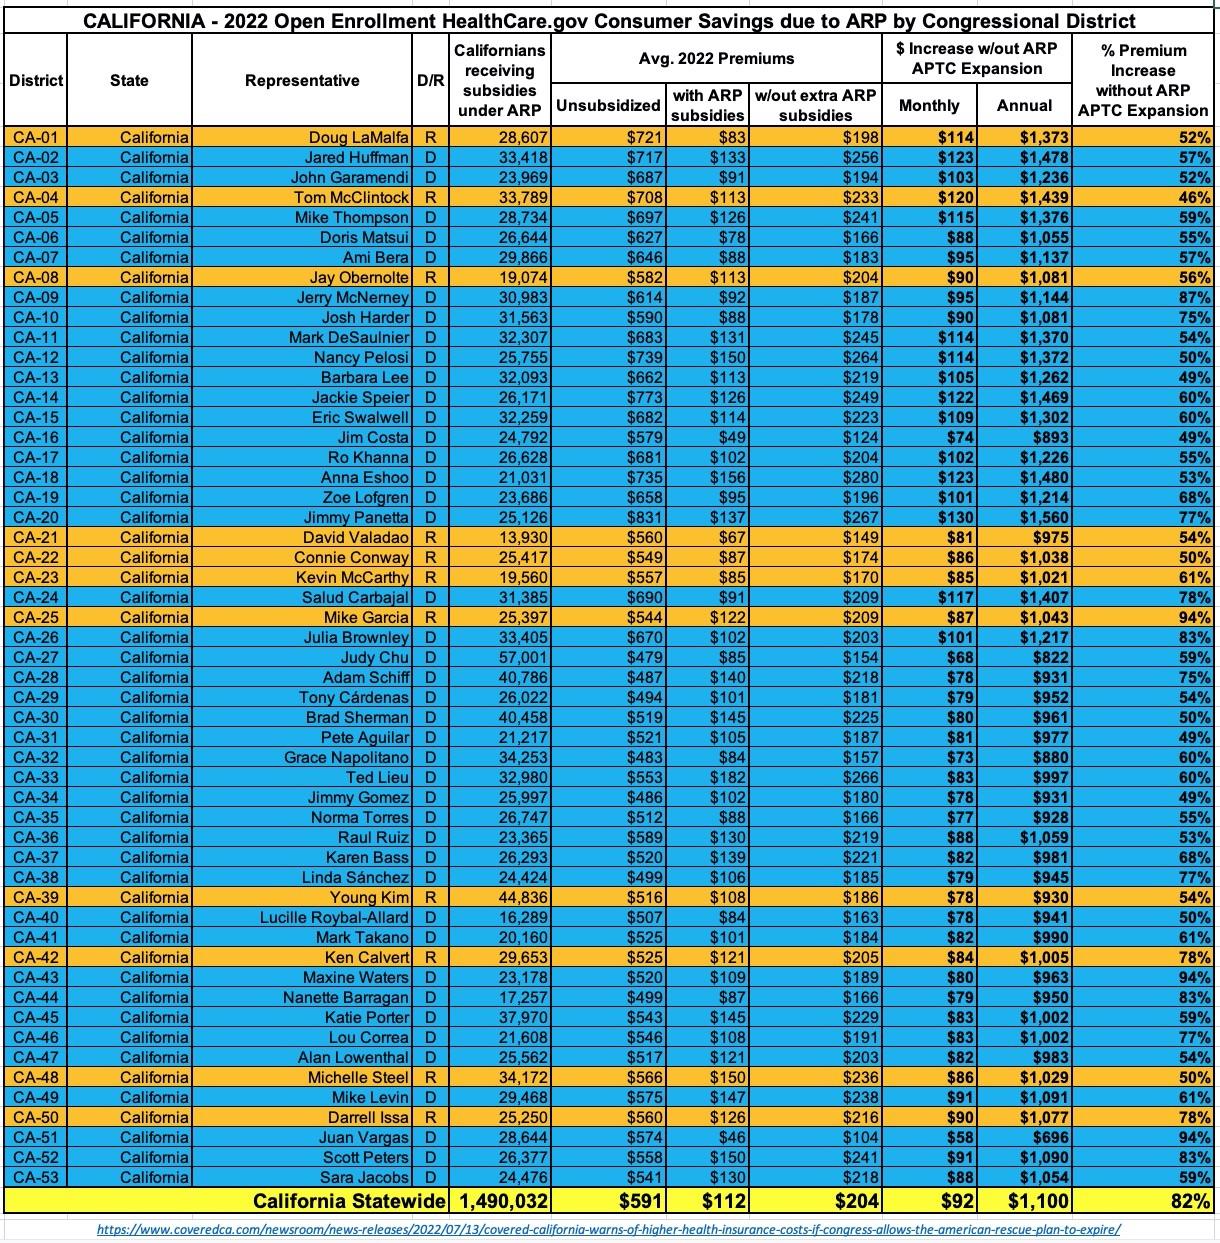
UPDATE 7/14/22: California wasn't included in the HHS's analysis as they operate their own ACA exchange, but yesterday Covered California released their own breakout of this data for CA. There's an extra column listing the unsubsidized avg. premiums for each Congressional District, and the enrollee numbers for CA are the number of subsidized enrollees, not the total who selected policies during Open Enrollment (which is a bit higher), but otherwise the California table is the same as the other states shown here:
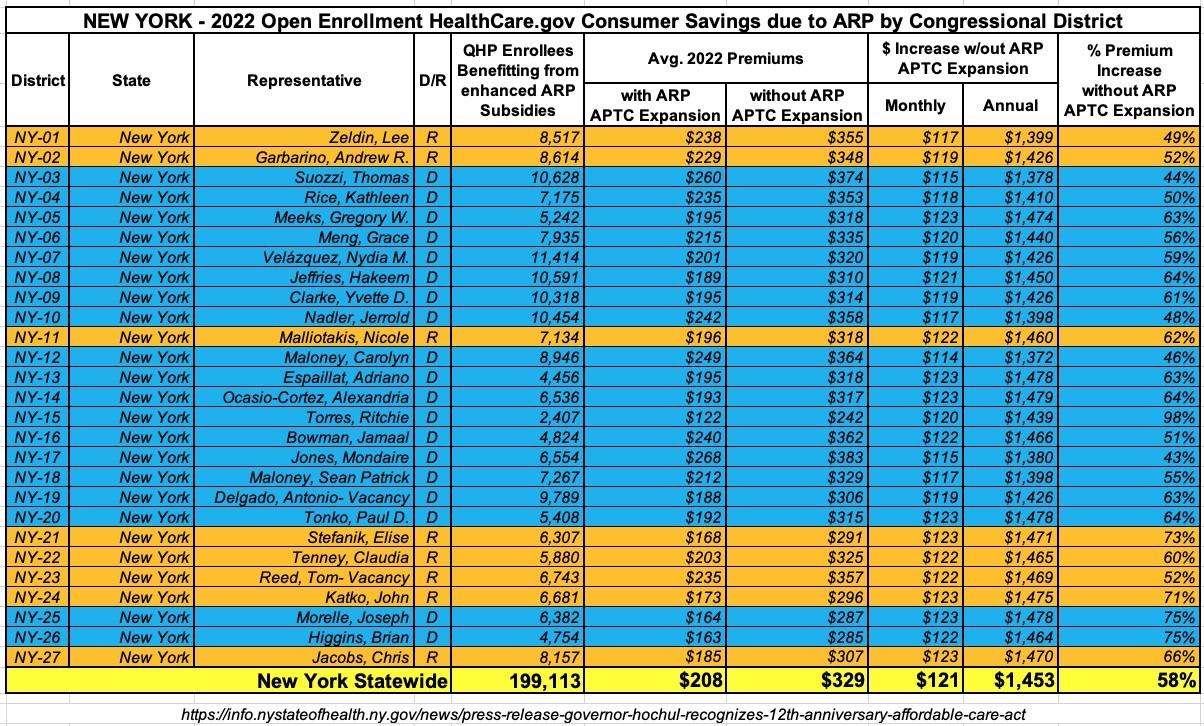
NOTE: New York wasn't included in the HHS Dept's analysis since NY operates their own state-based ACA exchange. HOWEVER, back in March the NY exchange, NY State of Health, released their own version of this district-level analysis. I used the data provided for each Congressional District to back out the monthly premium amounts:
REMINDER: HHS wasn't able to run Congressional District-level breakouts for North Carolina, but they do have the statewide average:

Advertisement
