

STATE BY STATE: How much more will YOU pay if #AmRescuePlan subsidies AREN'T extended?
Mon, 04/18/2022 - 4:16pm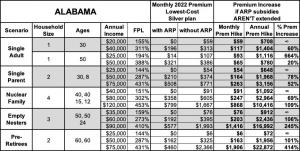
A month ago I posted an analysis which gave a general idea of how much more various households will have to pay in health insurance premiums if the expanded financial subsidies provided by the American Rescue Plan (ARP) are allowed to expire at the end of this year.
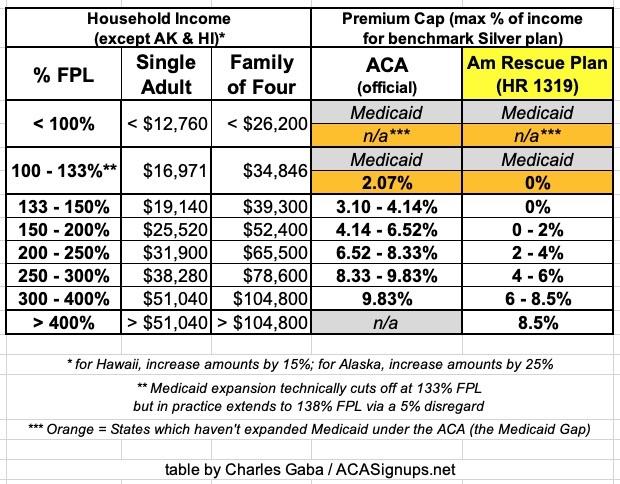
Again, here's what the subsidy tables look like under the ACA itself and under the American Rescue Plan. The premium caps are the maximum percent of household income which a household has to pay for the benchmark Silver plan at various income ranges:
I included four different scenarios: A single 26-year old adult; a single 50-year old adult; a "Nuclear Family" of four; and an older couple waiting for retirement.
I concluded that, on average, the young adult would have to pay as much as $1,500 more per year; the middle-aged adult would have to pay up to $3,200 more; the family of four would have to pay up to $7,300 more; and the 60-year old couple could potentially be looking at as much as a jaw-dropping $17,000/year premium increase...again, assuming the expanded ARP subsidies aren't extended beyond December 31, 2022.
A couple of weeks later, the Robert Wood Johnson Foundation (RWJF) backed a more in-depth analysis by the Urban Institute which broke out estimates of just how many currenly-insured Americans are likely to lose healthcare coverage if ARP subsidies expire at the end of this year by state, income bracket and other demographics:
If the enhanced PTCs expire, we estimate that 8.5 million people will be enrolled in Marketplace coverage with PTCs in 2023, 4.9 million fewer people than if the enhanced PTCs were extended (table 2). That represents a 36.7 percent decrease. Most enrollees in nongroup coverage with incomes above 400 percent of FPL will lose eligibility for PTCs if the enhanced PTCs expire, increasing the number of unsubsidized nongroup enrollees by 1.0 million. About 15.0 million people will have nongroup coverage if the enhanced PTCs expire, a decrease of 3.9 million (20.8 percent).
...if the enhanced PTCs expire, we estimate 3.1 million more people will be uninsured, an increase of 12.0 percent relative to extending the PTCs. Not all people who gained eligibility for Marketplace coverage with PTCs under the ARP were previously uninsured; some had employer-sponsored coverage, and the number of people with such coverage would increase by 681,000 if the enhanced PTCs were to expire. That represents an increase of only 0.4 percent. We estimate that enrollment in Medicaid and the Children’s Health Insurance Program will decrease slightly, particularly among children. As fewer parents enroll in the Marketplaces, fewer family members eligible for Medicaid and the Children’s Health Insurance Program will enroll in those programs.
Note: RWJF has a banner ad on this site.
Well, just in case neither of these properly underscored the urgency of this situation for millions of Americans, there's a very handy interactive tool at SubsidyEstimator.com, which was created specifically for the purpose of letting you plug in your zip code, household size/ages and annual income in order to find out just how much your ACA health insurance premiums are if the ARP subsidies are allowed to expire compared to how much they are if the ARP subsidies are made permanent (or at least extended by at least another year or more).
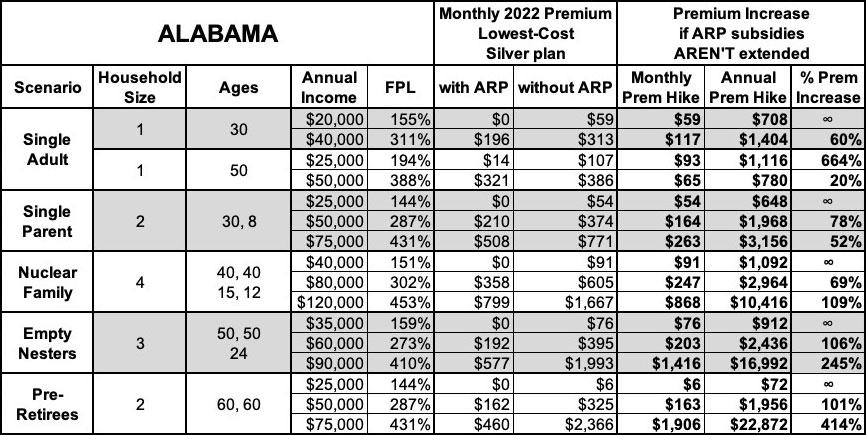
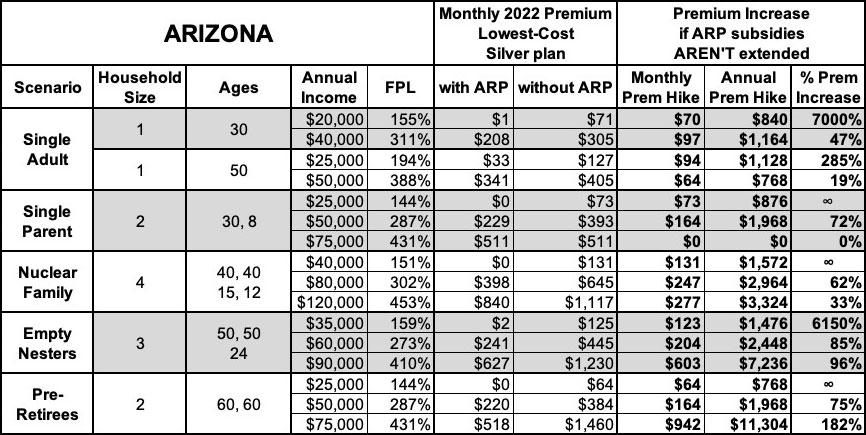
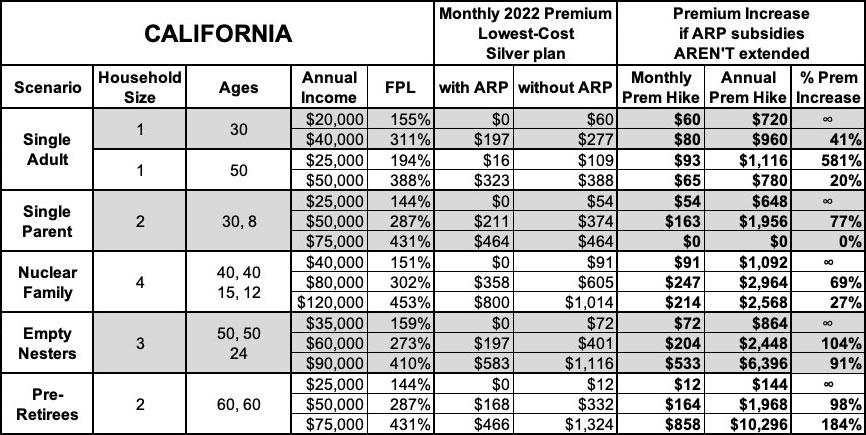
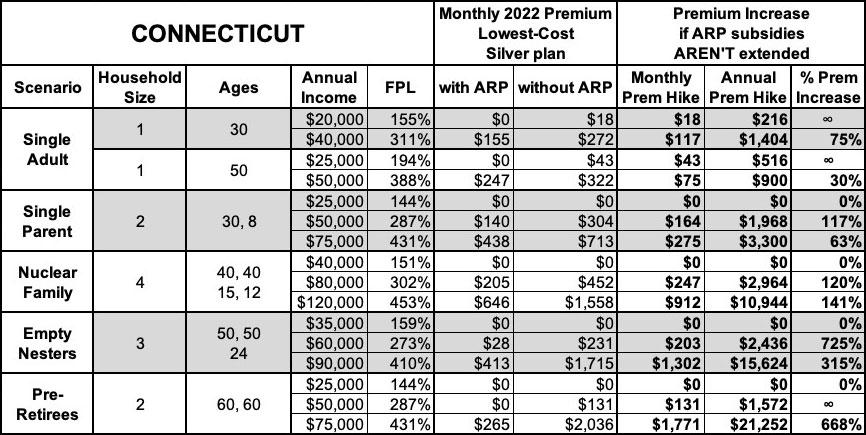
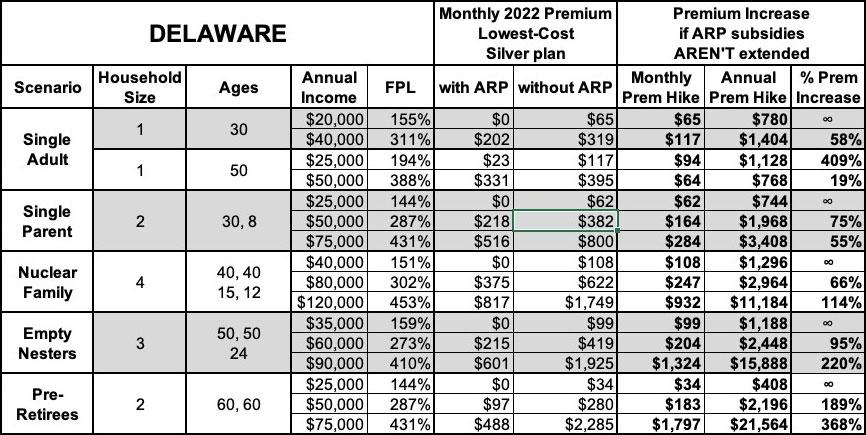
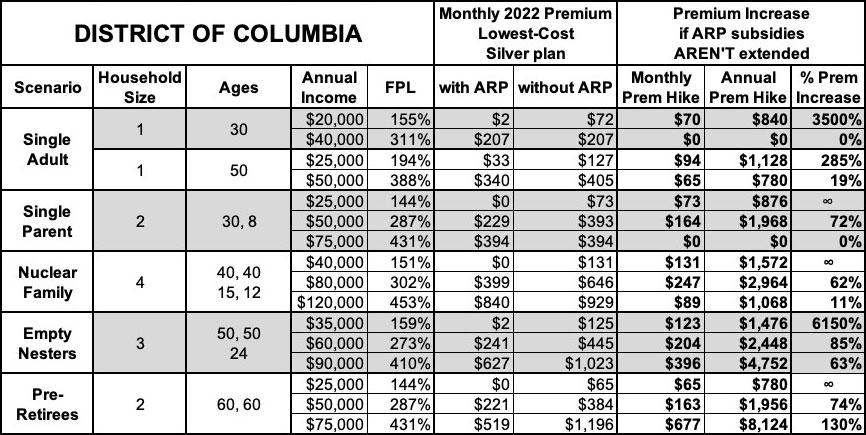
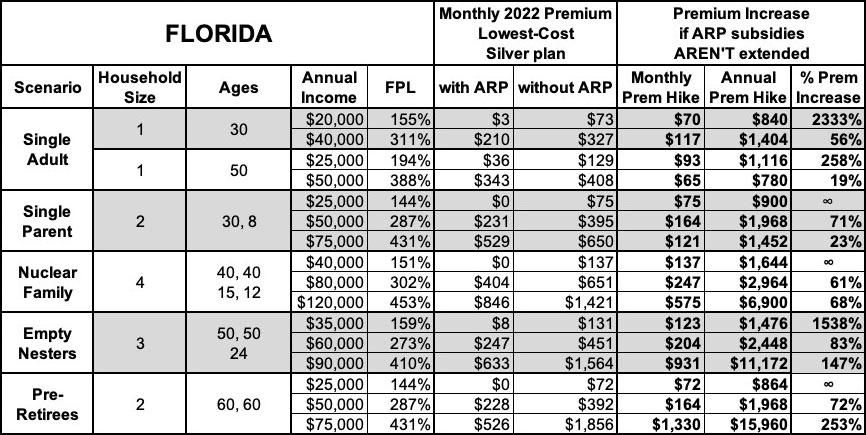
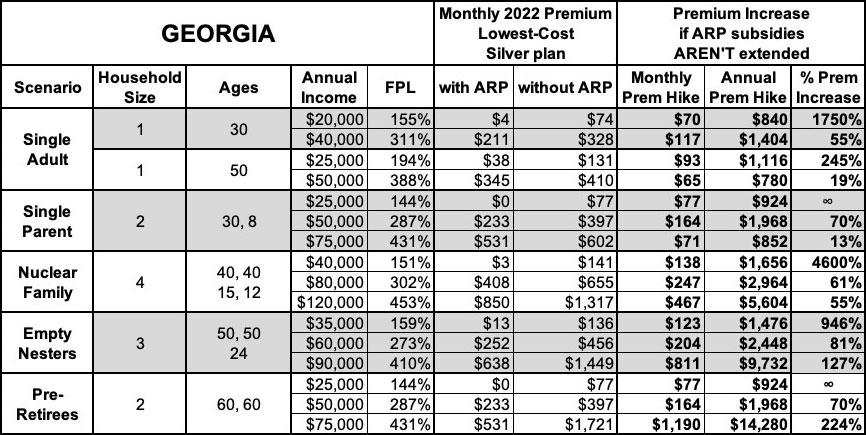
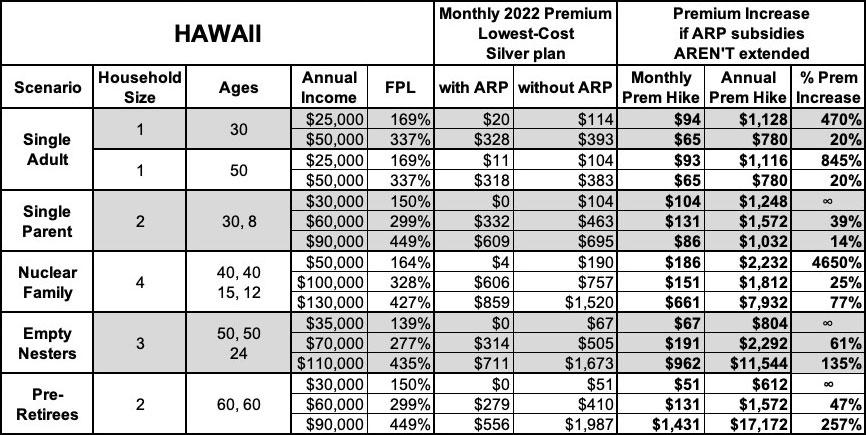
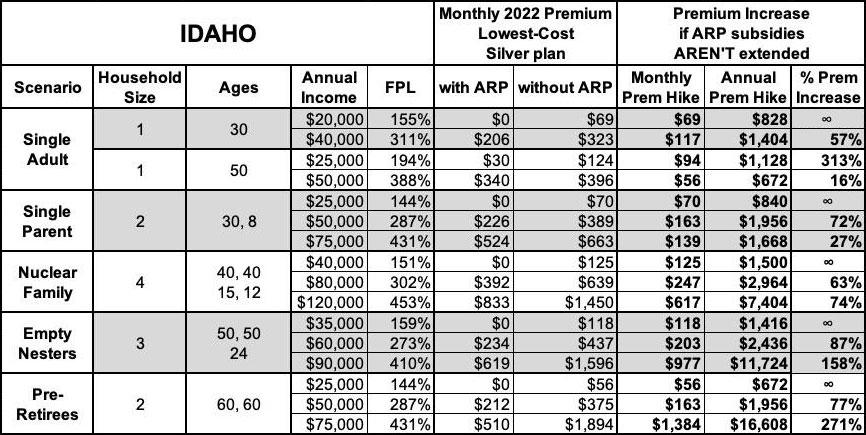
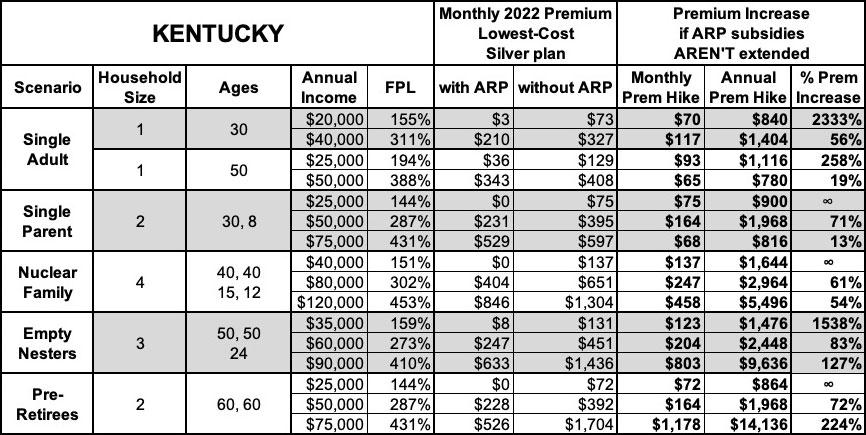
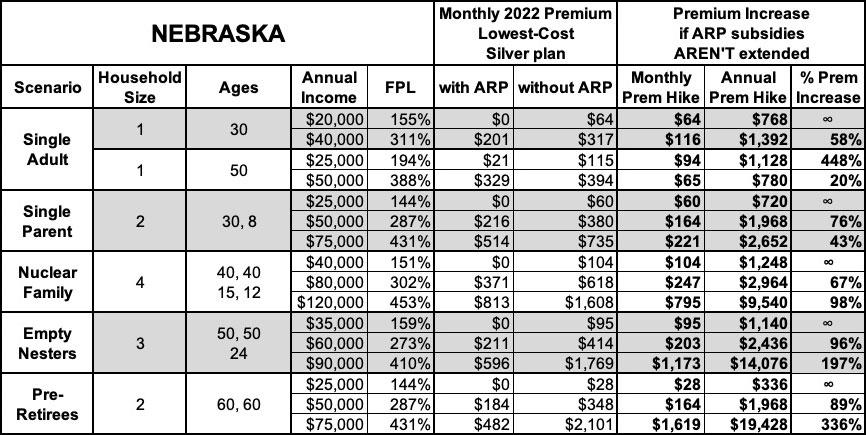
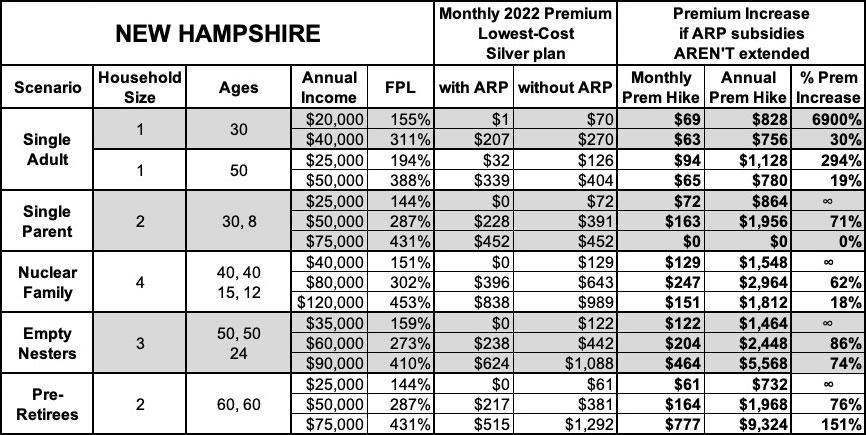
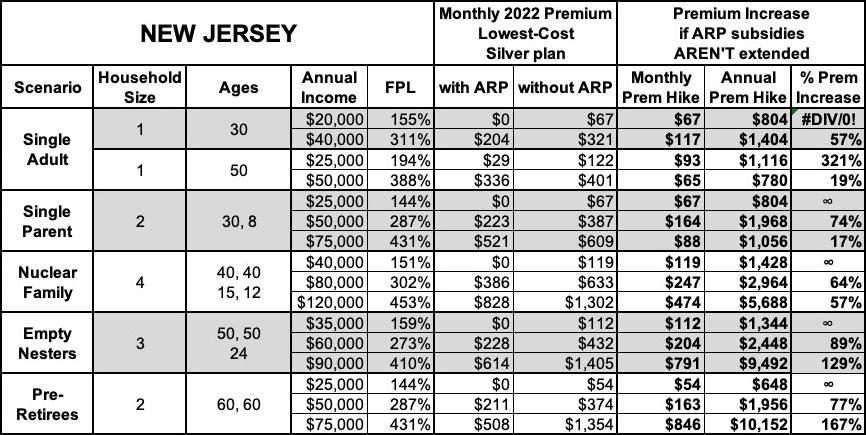
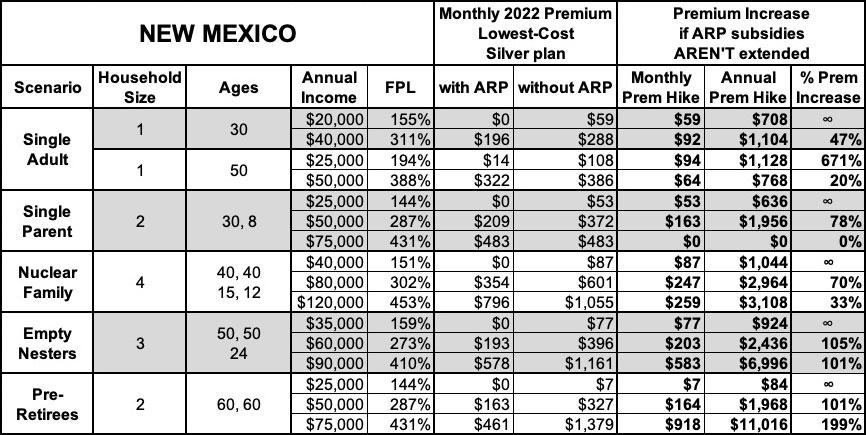
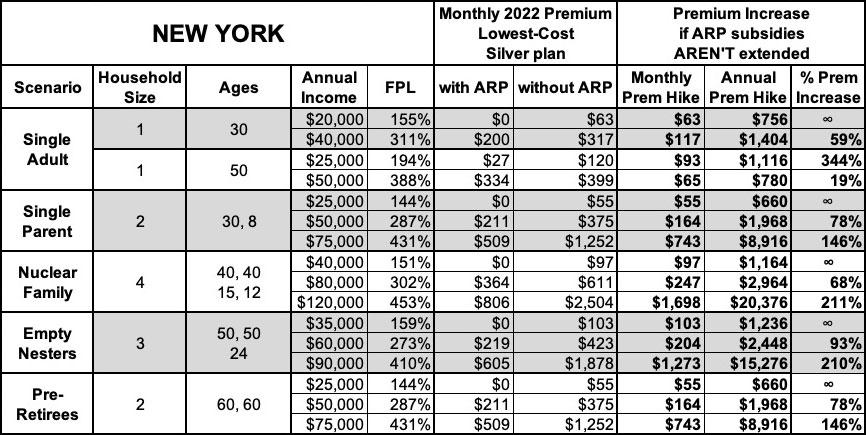
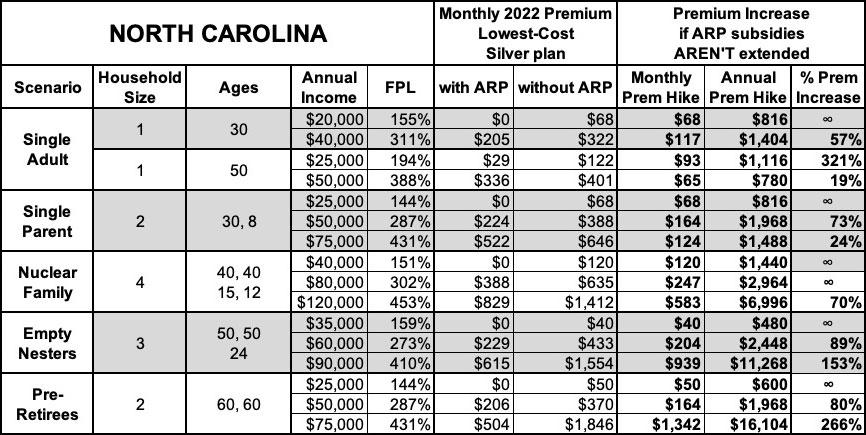
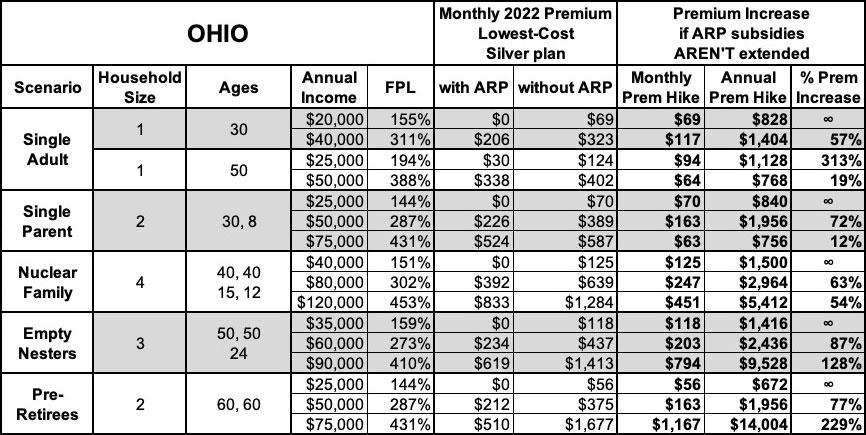
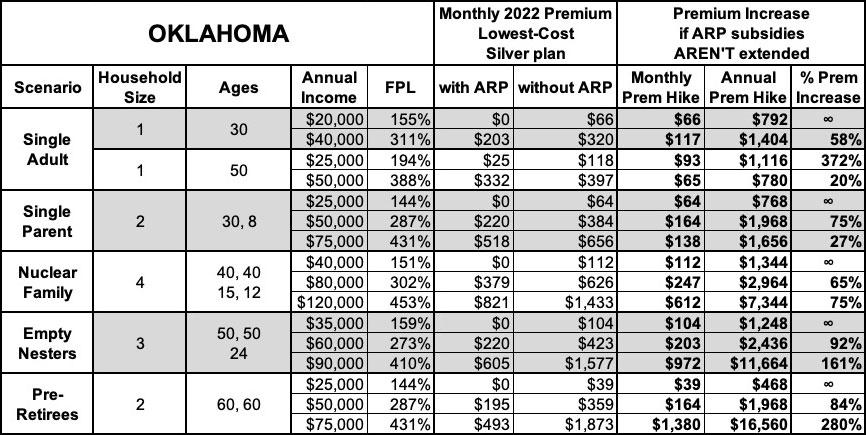
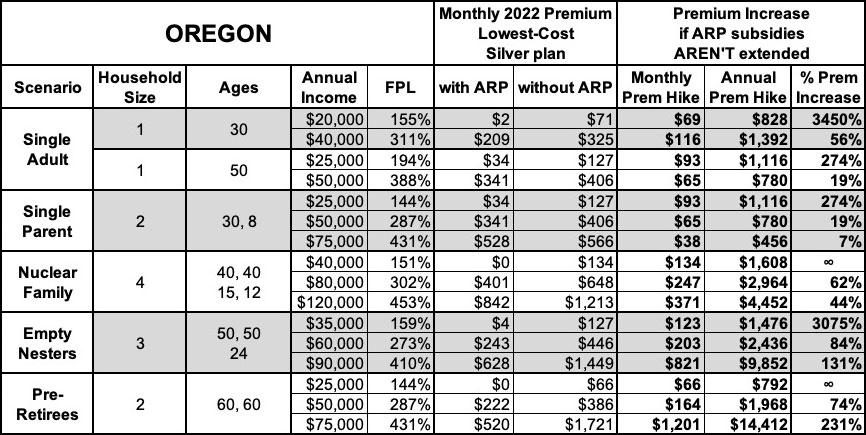
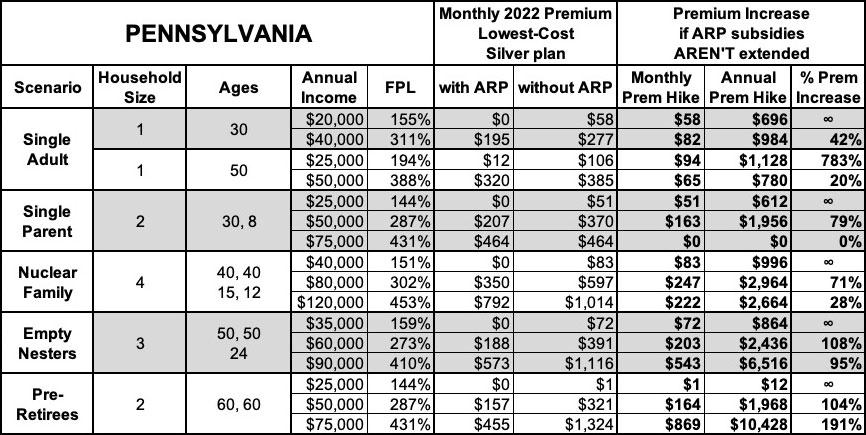
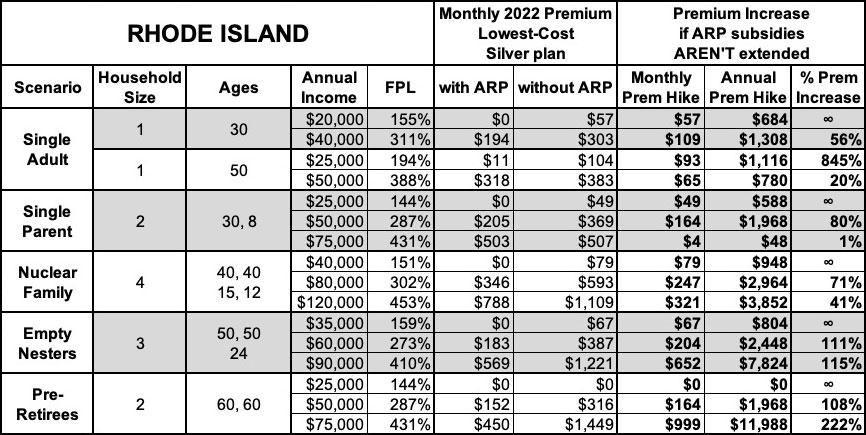
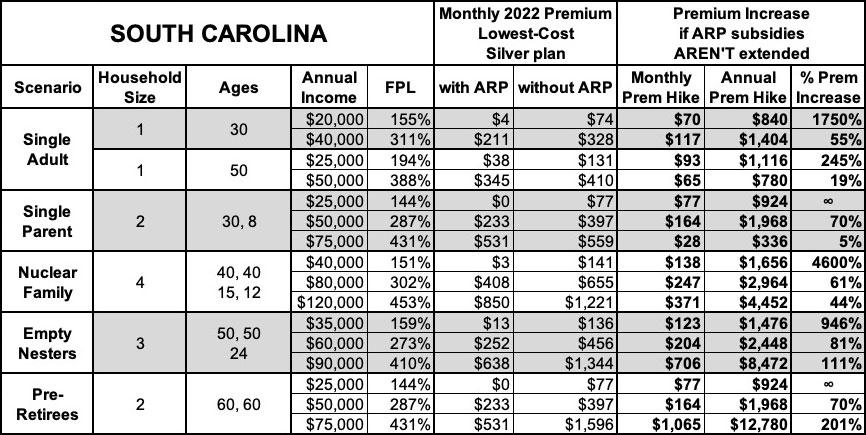
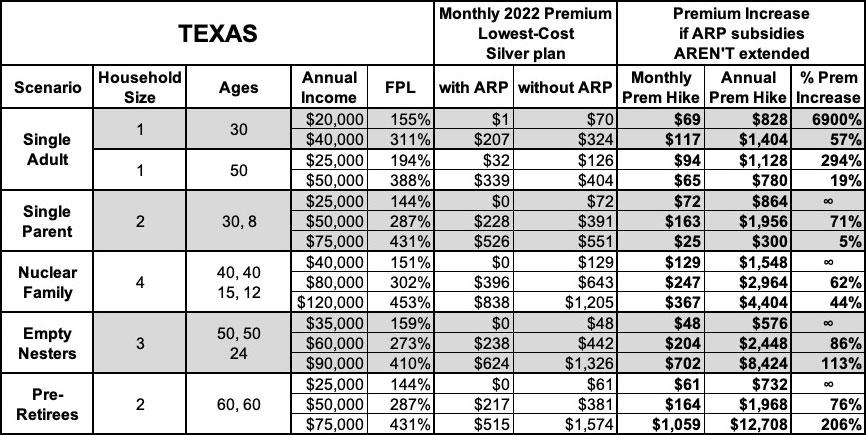
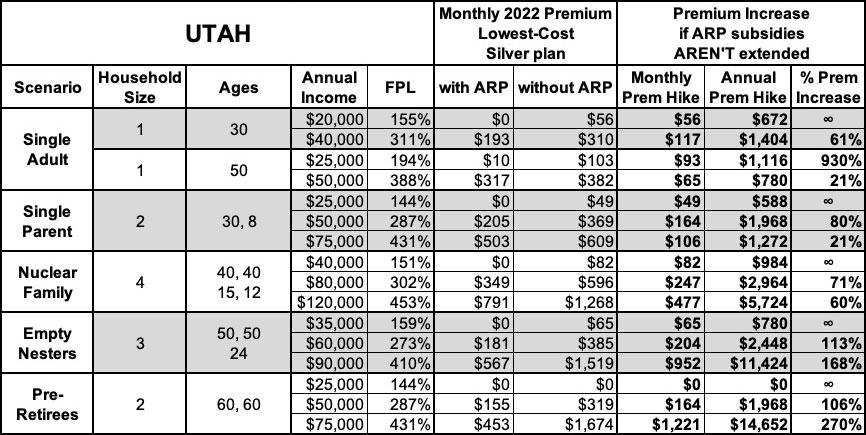
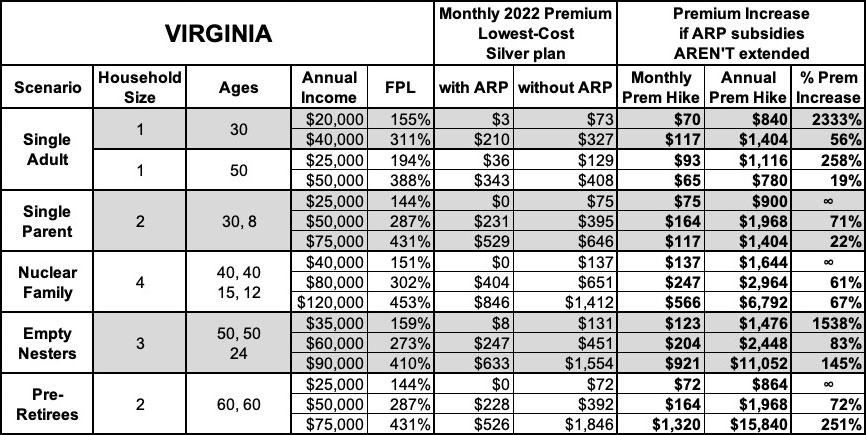
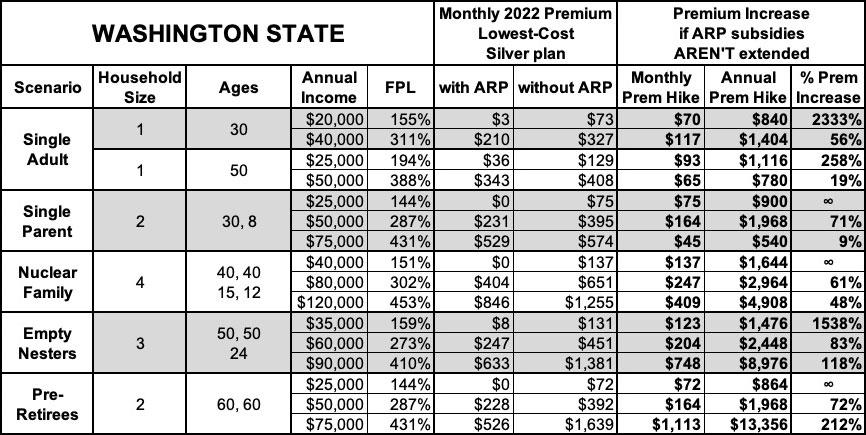
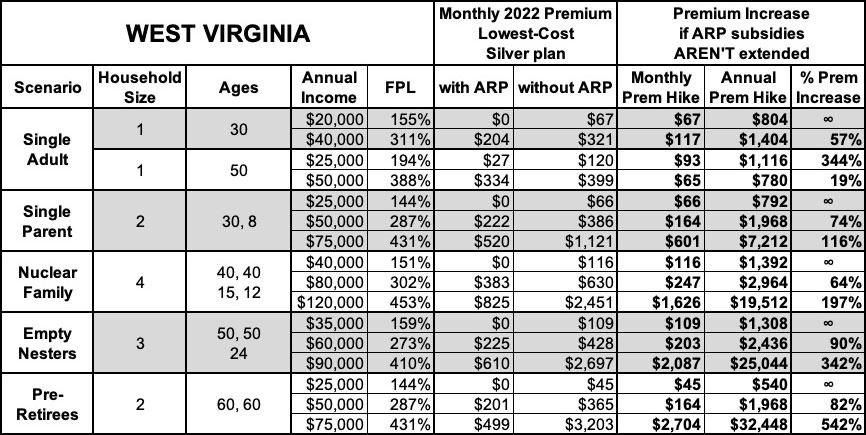
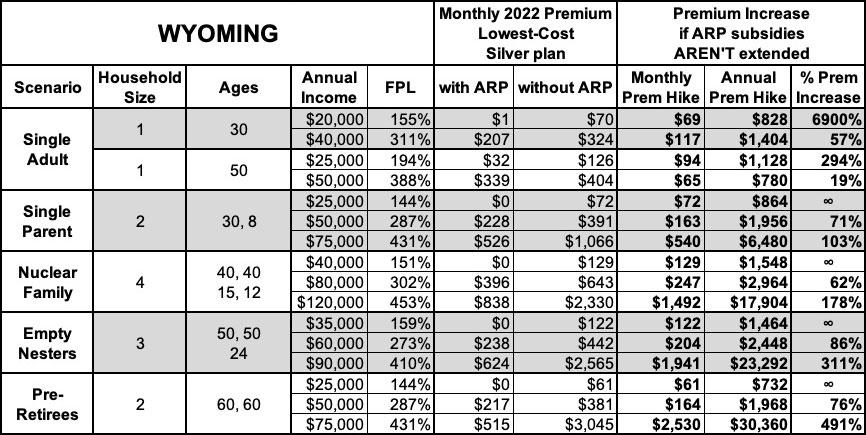
With this in mind, below I've posted tables comparing the net premiums (after federal tax credits) with & without ARP subsidies for various households at various income levels for all 50 states plus DC.
For this analysis, I'm using five different households, at either 2 or 3 different income levels for each. Four of them are pretty close to the ones I used last month, plus a fifth one:
- 30-yr old single adult earning $20K or $40K/year
- 50-yr old single adult earning $25K or $50K/year
- 30-yr old single parent w/an 8-yr old child, earning $25K, $50K or $75K/year
- 40-yr old couple w/2 children age 15 & 12, earning $40K, $80K or $120K/year
- 50-yr old couple w/1 adult child age 24, earning $35K, $60K or $90K/year
- 60-yr old couple earning $25K, $50K or $75K/year
This gives a total of 16 different household scenarios for every state which should be pretty representative of the vast majority of Americans likely to enroll in ACA individual market coverage.
Some important caveats before we get to the tables:
- The Subsidy Estimator tool was created by the Blue Cross Blue Shield Association, one of the largest health insurance lobbying organizations in the country. While this obviously raises some hackels, I've run quite a few spot checks and their tool appears to be pretty accurate--the premiums listed are what various housholds would have to pay for the policies listed based on their zip codes, household incomes and size, and ages of the family members on the policy...keeping in mind the other caveats below.
- The tool uses Federal Poverty Level (FPL) income thresholds from 2021 instead of 2022. This actually makes sense since the 2023 premiums for ACA-compliant insurance policies won't be known until late summer/early fall.
- Similarly, the full-price premiums which the subsidies are based on are also based on 2022 rates, not 2023, which will vary somewhat by this November.
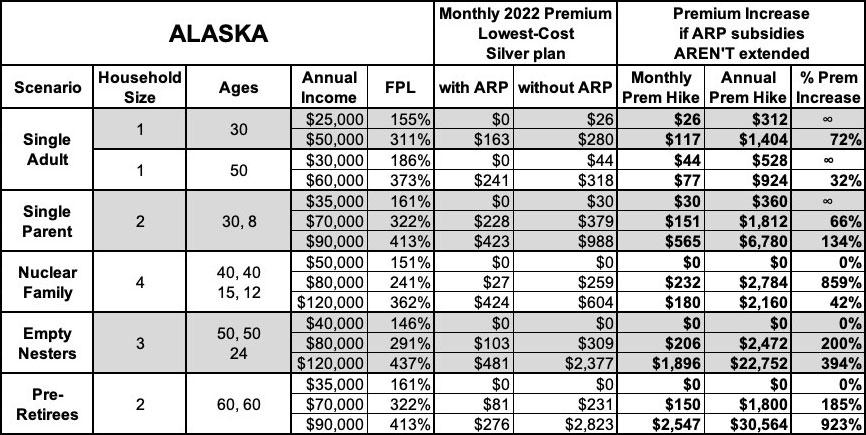
- Alaska and Hawaii: It looks like the Subsidy Estimator tool is using the FPL thresholds for the 48 contiguous states for both AK & HI instead of bumping each up by 25% & 15% respectively (the true thresholds for these two states). I've adjusted my own tables below for Alaska & Hawaii accordingly.
- "Single Parent" and "Nuclear Family" tables: The subsidy tool doesn't appear to take into account the fact that children under 19 are usually eligible for CHIP or Children's Medicaid at a significantly higher household income level (in some states they're eligible up to 200% FPL or more).
- My own analyses of ACA subsidies usually uses the benchmark Silver plan (2nd Lowest-Priced Silver); the default for this subsidy calculator uses the lowest-priced Silver plan, which is why there's a few cases where the premium shows up as $0 when you'd normally expect it to be $20 - $30/month or so.
- Finally, the tool doesn't take into account the state-based supplemental financial subsidies available in about a dozen states.
OK, with all that understood, let's take a look (note: the infinity (∞) sign simply means that the net monthly premium for that household would go from $0 (free) to some number higher than $0...which technically means their premium would increase "infinity percent" even if it only went from $0 to $1/month.


Advertisement
