

The Red/Blue COVID Divide includes a pretty eyebrow-raising coincidental data point...
Wed, 03/16/2022 - 4:12pm
Over the past two years, I've run a lot of county-level COVID data analysis. I've plotted the data as scatter-plot graphs and bar graphs, and I even created a couple of animations which showed how the data changed over time.
Last November, while creating one of these animations, I also noticed something which made my jaw drop. I talked about it at the time, but it didn't seem to generate as much interest as I thought it merited, so today I'm plotting the data using a different layout: A simple line graph of COVID-19 death rates in the deepest Red and deepest Blue counties of the United States, plotted over time. As a bonus, in the process, a few other useful points revealed themselves visually as well.
As always, here's my methodology:
- 2020 Population data via U.S. Census Bureau's 2020 Census
- 2020 Trump vote data via each state's Election Commission or Secretary of State websites
- Case & Death data via Johns Hopkins University Center for Systems Science & Engineering for 47 states; NY Times COVID-10 in the United States github for NE & UT only; & the White House COVID-19 Team Community Profile Report for Florida only.
- Note that a small number of deaths from all counties in both deciles are missing due to the county of residence being unknown.
The graph below shows the cumulative COVID-19 death rates in the reddest and bluest tenths of the U.S. at the county level. The total population of the 50 U.S. states, plus DC, is right around 331.4 million people, give or take (remember, Puerto Rico, Guam and the other U.S. territories don't vote in the general U.S. Presidential Election, so can't be included for obvious reasons). That puts each tenth of the population at around 33.1 million apiece.
Of course, some counties have millions of residents (the largest, Los Angeles County, has over 10 million people alone), which means it's impossible to break out exactly 10% of the population without splitting some counties into smaller chunks. Unfortunately I don't have COVID data at that granular of a level, so counties are as far as I can go. I've come as close as I could, however.
As you can see, the COVID death rate was dramatically higher in the densely-populated, heavily-Democratic blue urban counties during the first wave in spring of 2020. Starting around late May, however, the death rate began dropping off dramatically in those areas; this remained the case until right around Thanksgiving 2020, at which point the Blue America death rate started to climb again for the next few months.
Meanwhile, Red America had things pretty easy until roughly mid-July 2020. From that point on, the death rate in MAGA Country began to catch up to Blue America, eventually crossing the blue line. It's never looked back since: (click image for high-res version)
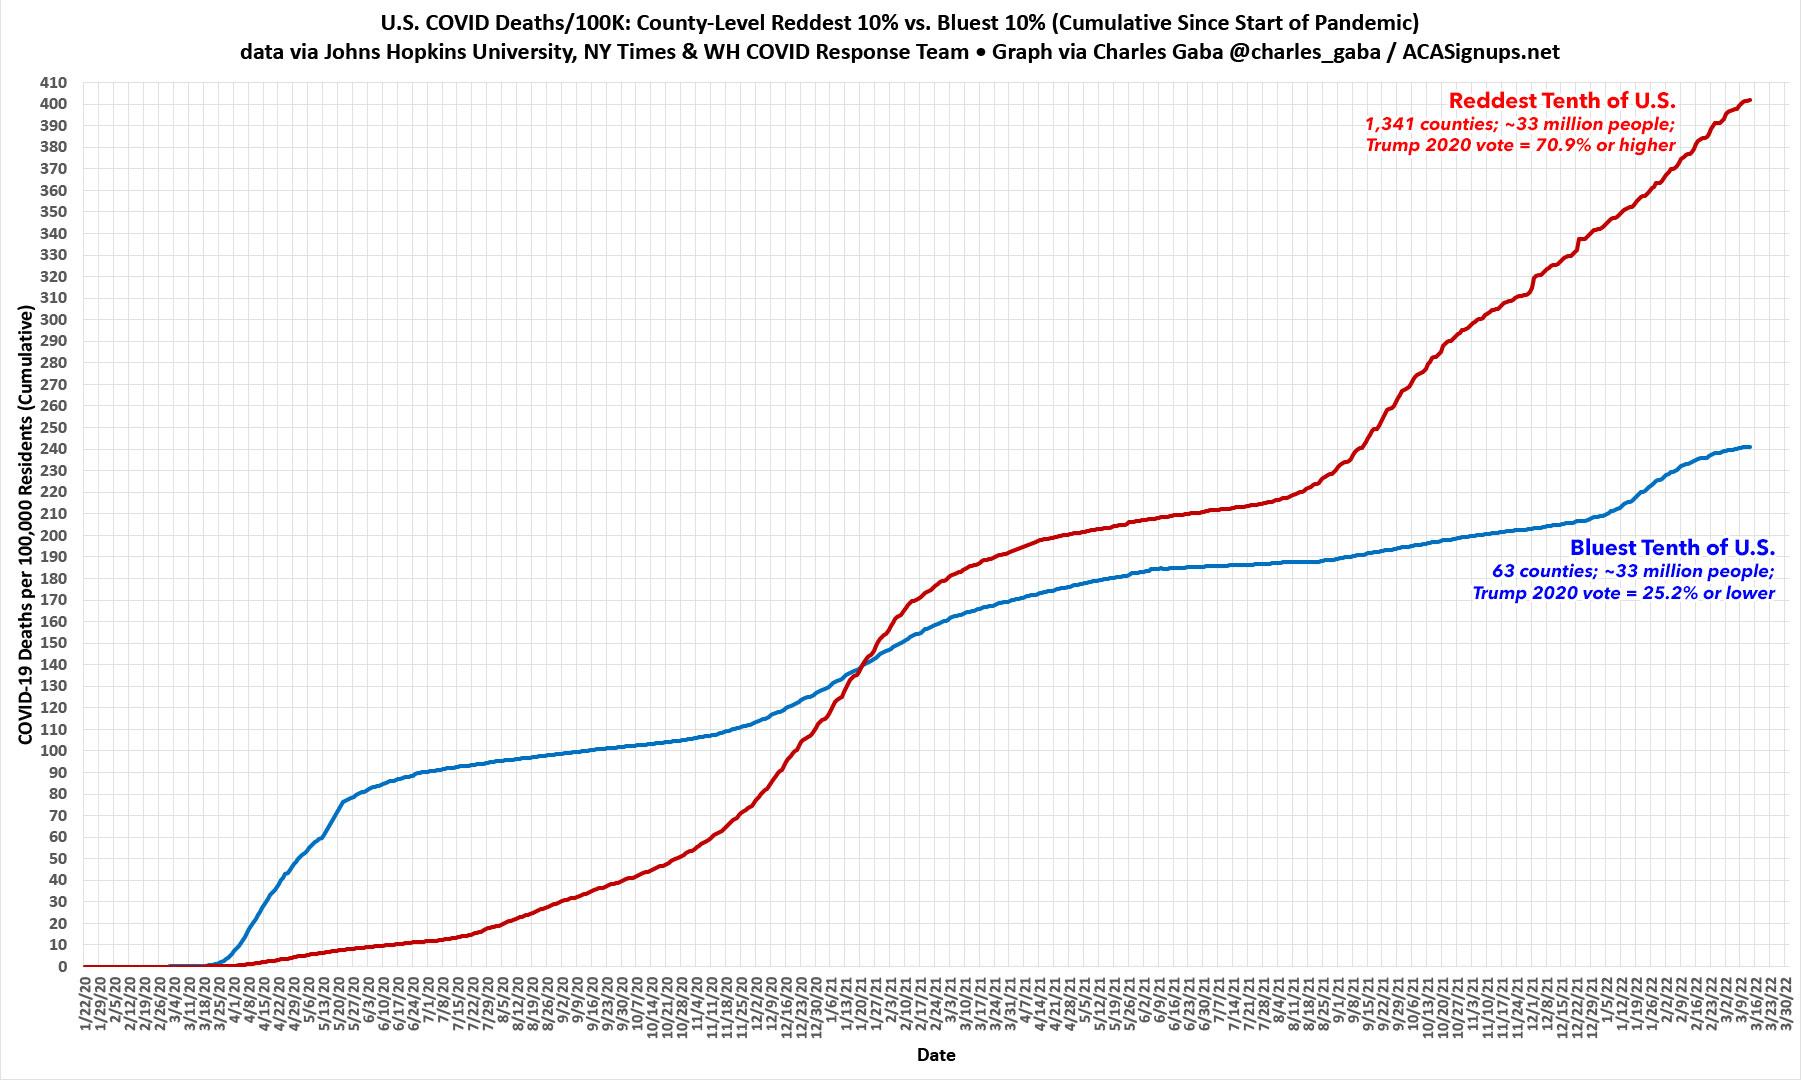
Here's the eerie coincidence part: While the death rate gap between the Reddest and Bluest deciles of the country started to shrink in Summer 2020, the red line just happened to actually cross the blue line around six months later...in mid-January 2021. On January 20th, 2021, to be precise...otherwise known as Inauguration Day.

Huh.
It's also worth noting, completely as an aside, how dramatic the U.S. is in terms of the urban/rural divide: There's as many people living in the 63 bluest counties as there are in the 1,341 reddest counties.
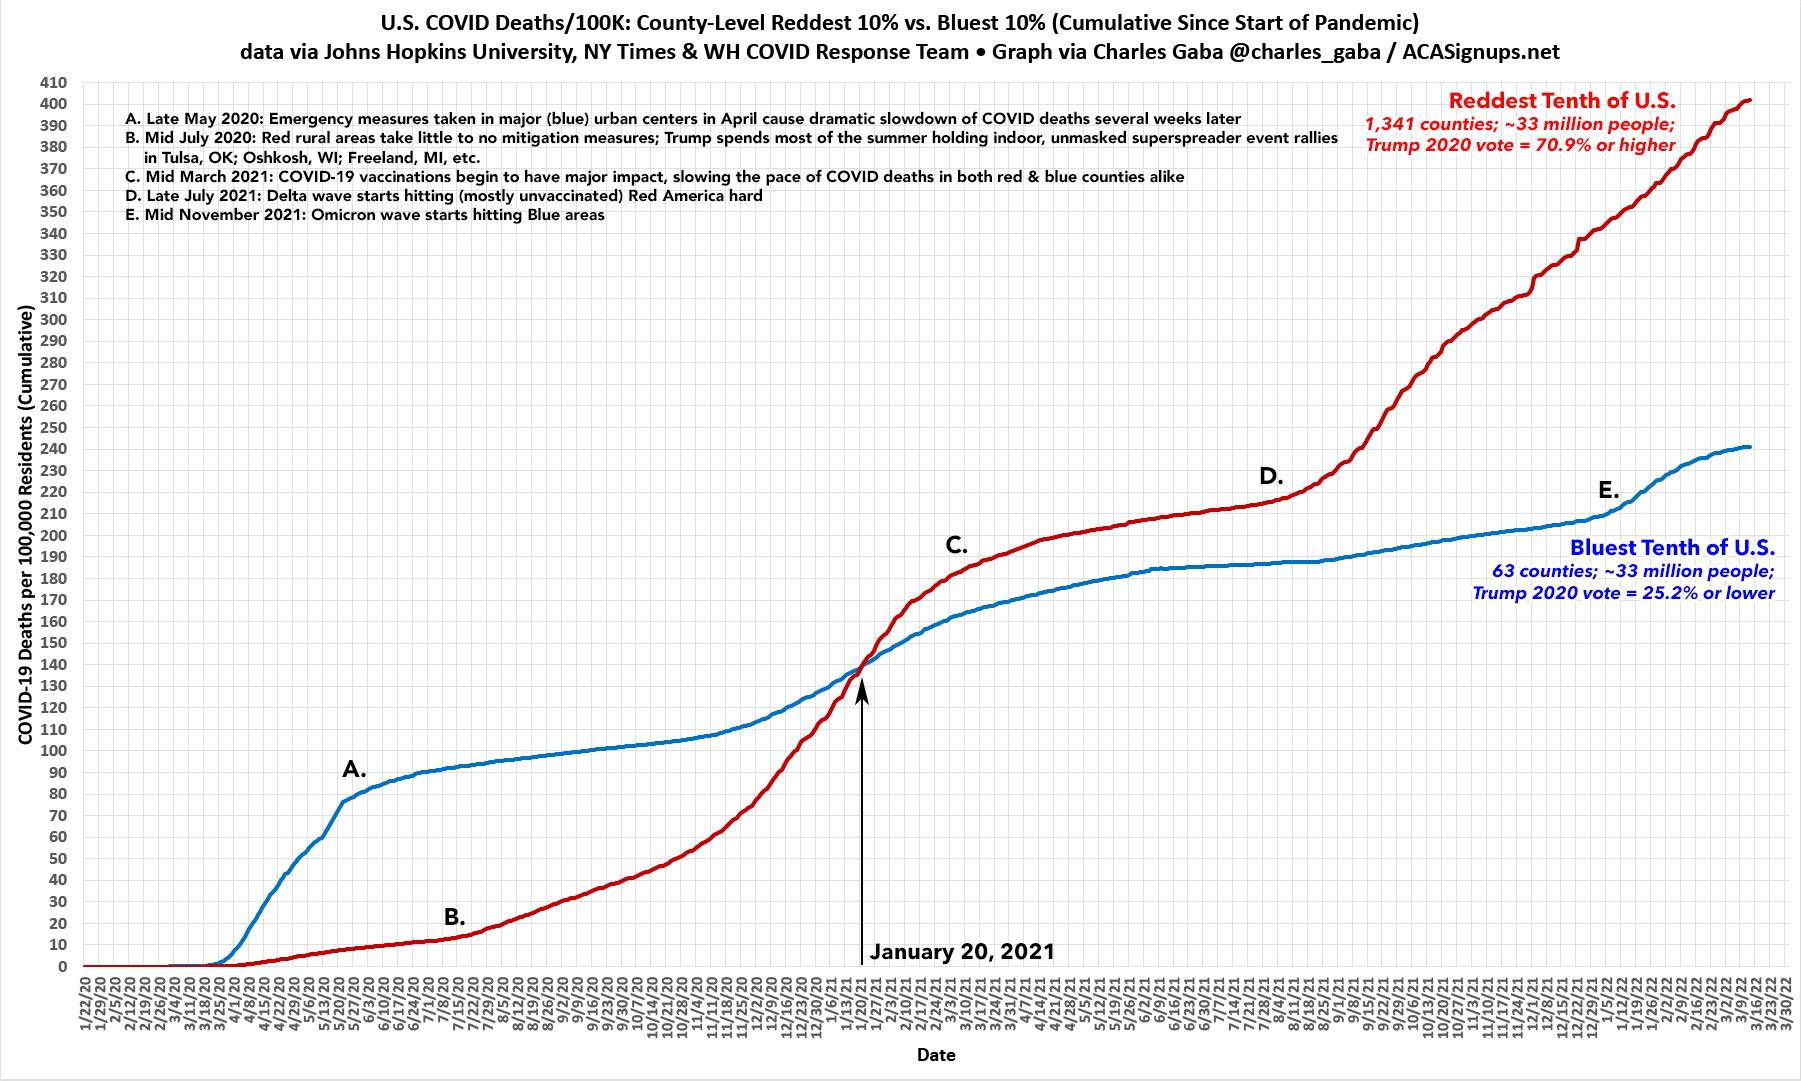
As weird with a beard as the Inauguration Day timing may be (and it is coincidental; again, the trend had started months earlier...1/20/21 just happened to be the day that the paths actually crossed), there's some other noteworthy dates to mention as well. I've noted a couple above; I've noted a few others on the version of the graph below:
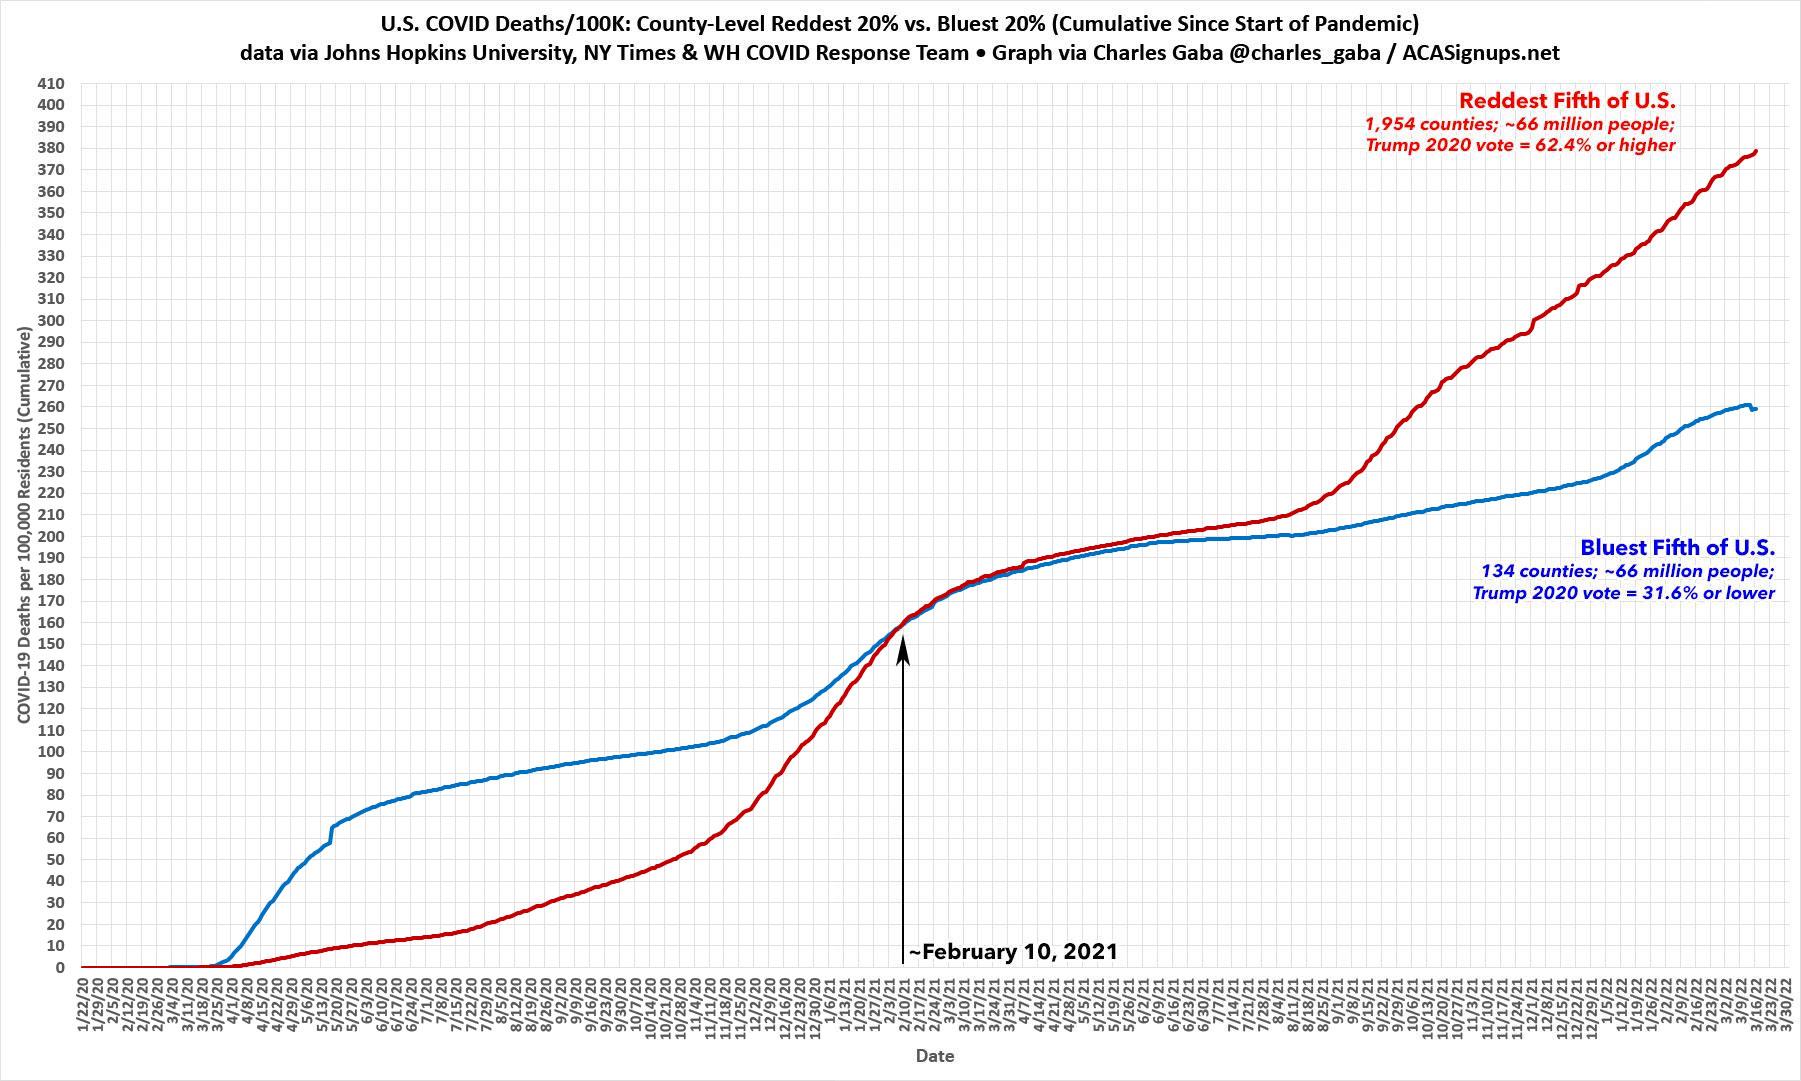
I should also note that while the 1/20/21 date is indeed a bit of an eye-opener, if you widen the range a bit it becomes less so. Here's what the same graph looks like if you include the reddest and bluest fifths of the United States (that is, the counties with the 20% highest & lowest Trump vote in November 2020). As you can see, while both lines follow very similar patterns, the actual "crossover" date is about 3 weeks later, roughly around February 10th, 2021.
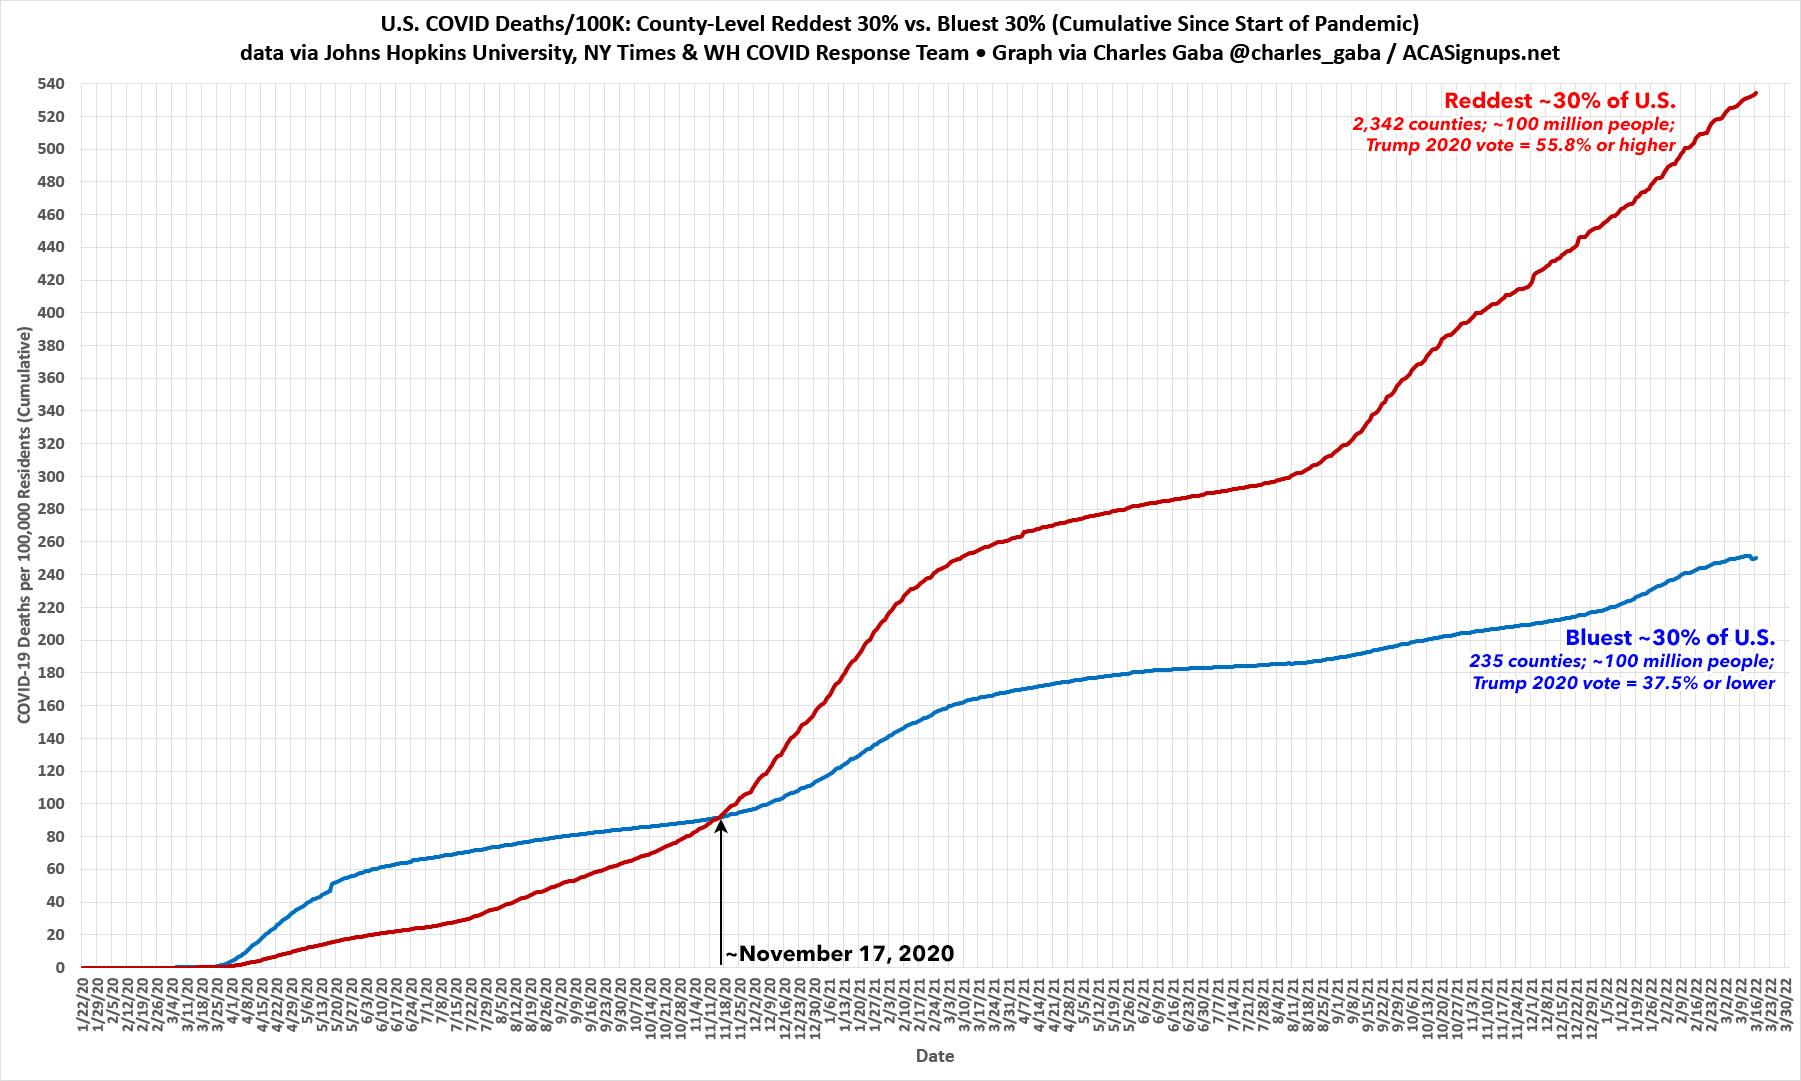
UPDATE: Here's what it looks like if you include the reddest and bluest 30% of the population (i.e., counties where Trump received at least 55.8% of the vote vs. counties where he received less than 37.5% of the vote, with ~100 million residents apiece). Again, the lines follow the same patterns as above, but the red line crosses the blue line at over 2 months earlier than Inauguration Day, on or around November 17th, 2020:
Advertisement
