

Weekly Update: U.S. #COVID19 vaccination levels by COUNTY & Partisan Lean
Mon, 12/13/2021 - 3:27pm
Methodology reminders:
- I go by county residents who have received the 2nd COVID-19 shot only (or 1st in the case of the J&J vaccine). Data for 3rd/booster shots aren't available at the county level in most states yet.
- I base my percentages on the total population, as opposed to adults only or those over 11 years old (or even over 4 years old).
- For most states + DC I use the daily data from the Centers for Disease Control, but there are some where the CDC is either missing county-level data entirely or where the CDC data is less than 90% complete at the county level. Therefore:
- For Hawaii, Illinois, Vermont, Virginia and West Virginia, I'm using data from the COVID Act Now Risk & Vaccine Tracker database.
- For Colorado, Georgia, Minnesota, and Texas, I'm using their COVID vaccine dashboards set up by the state health departments.
- For California, I'm using the CDC data for most counties and the state health dept. dashboard data for the 8 small counties which the CDC isn't allowed to post data for.
- For Massachusetts, I'm using the CDC data for most counties but am now using the official Massachusetts Health Dept. weekly data report for Barnstable, Dukes & Nantucket counties, which the CDC only has partial data for.
- The 5 major U.S. territories don't vote for President in the general election, preventing me from displaying them in the main graph, but I have them listed down the right side.
- County populations are based on official 2020 U.S. Census Bureau data
- Alaska's 2020 election results are estimated thanks to an updated analysis by RRH Elections (all other states +DC have been using 2020 county-level election data all along).
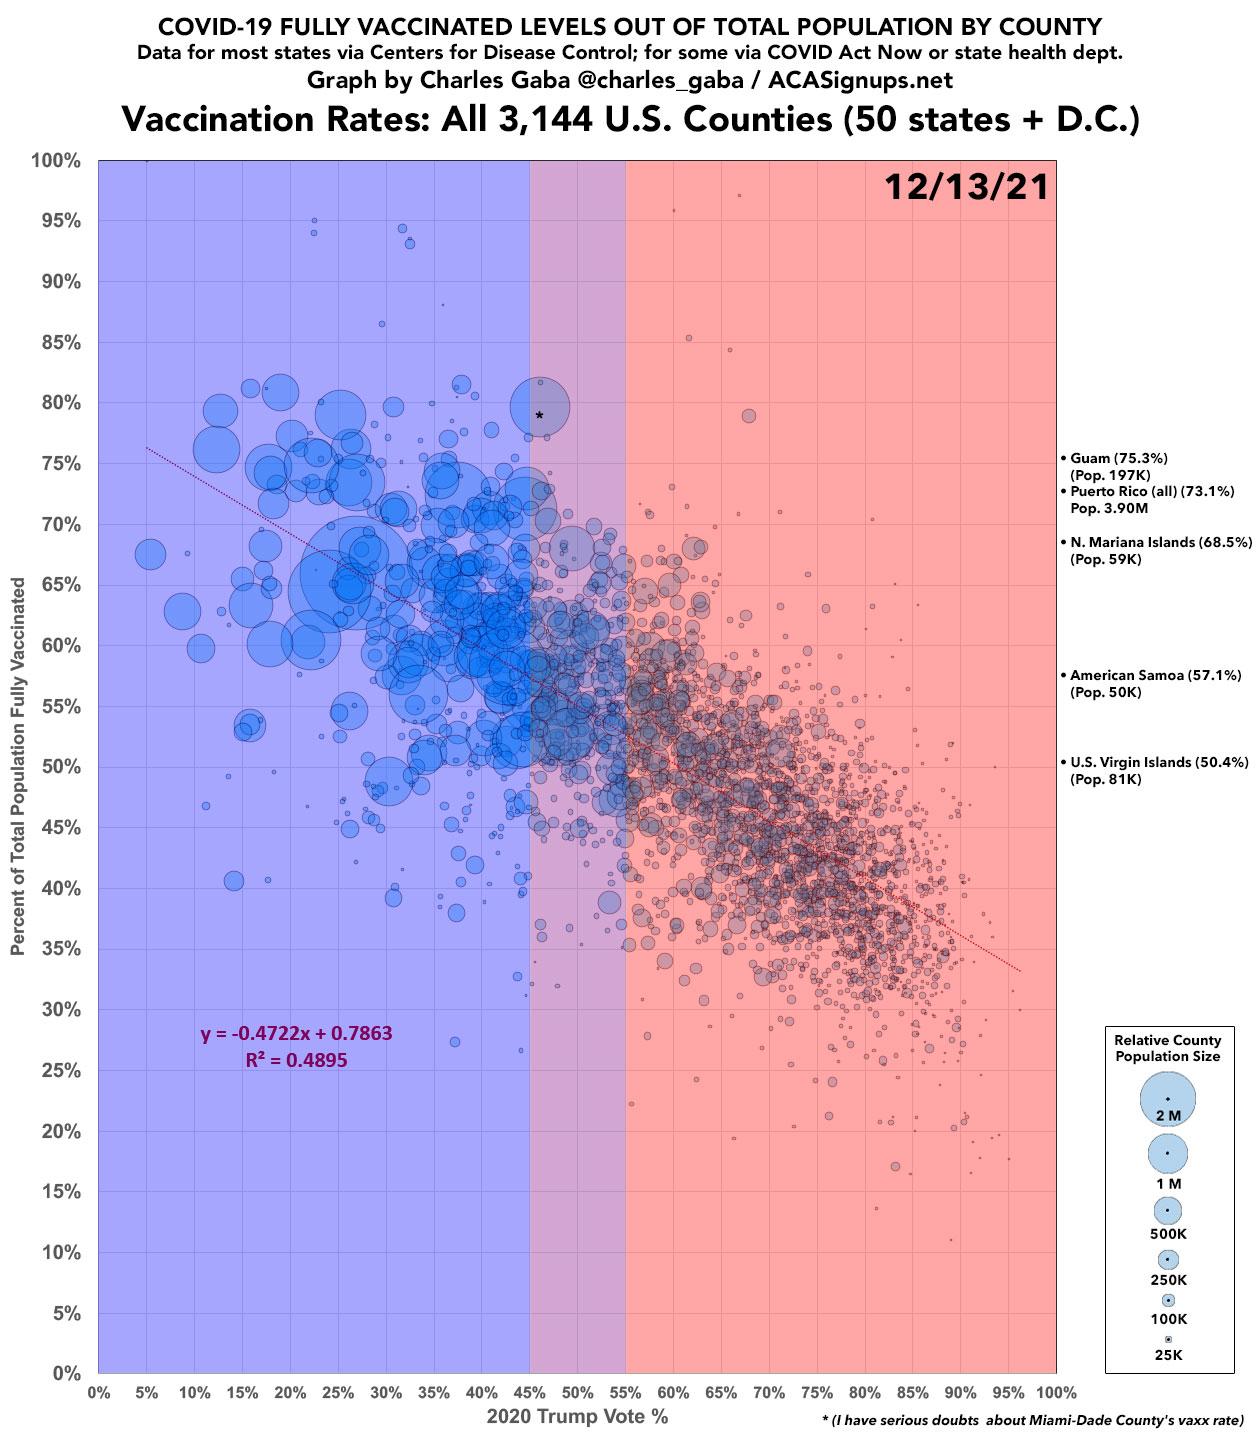
With all this in mind, here's what things looked like as of December 13th, 2021:
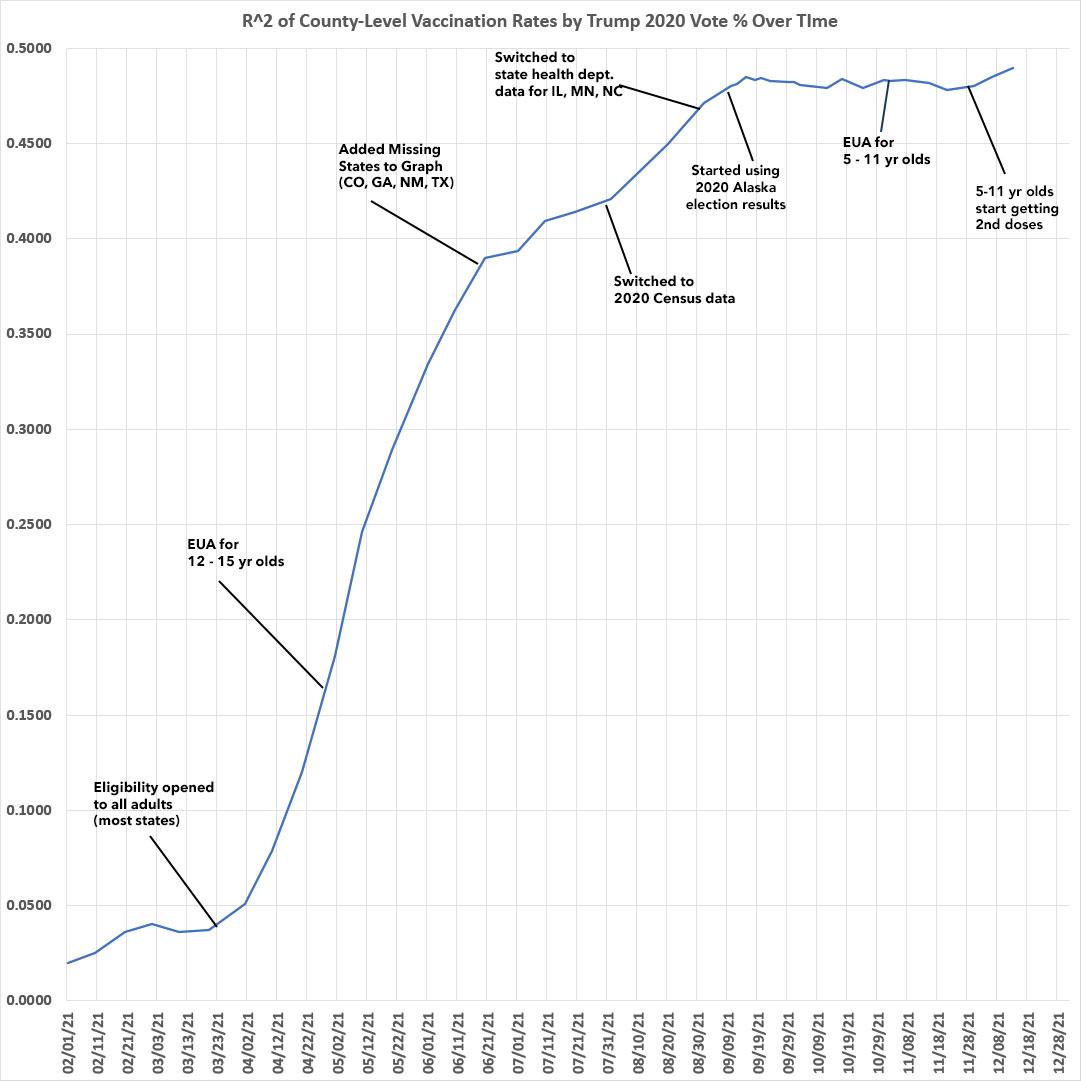
It's also important to note that both the R2 (correlation) and slope formulas, which had plateaued for most of October and November, appear to be increasing again now that the first batch of 5 - 11 year olds have started receiving their 2nd Pfizer shot:
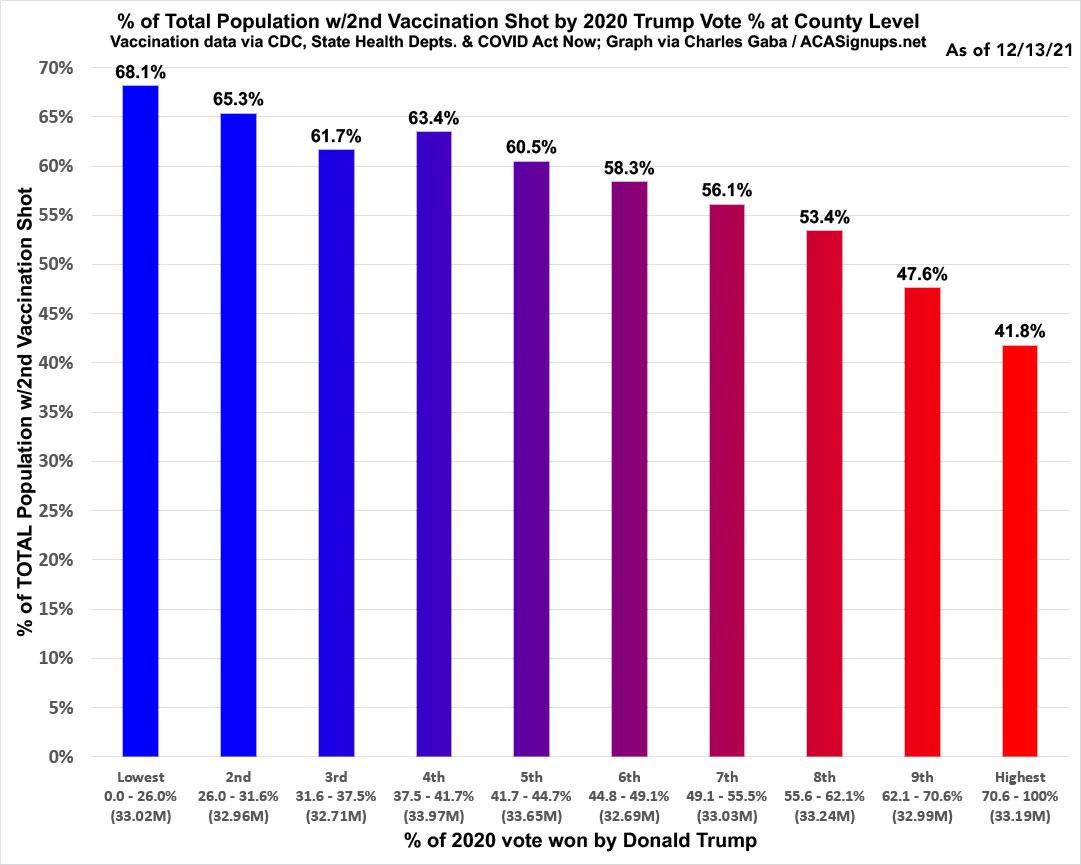
Here's what the data above looks like in bar graph format, broken out in rough deciles (tenths of the total population, or around 33.1 million people apiece). The vaccination rate in the bluest tenth of the nation is running 63% higher than the reddest tenth:
Other things especially worth noting:
- Kalawao County, HI (pop. 82) is still the only one which is 100% vaccinated.
- Counties with over 90% of their populations fully vaccinated have ~159,000 residents, including the above plus:
- Dukes County, MA (pop. 20,600)
- Nantucket County, MA (pop. 14,255)
- Hudspeth County, TX (pop. 2,912)
- Bristol Bay, AK (pop. 844)
- Santa Cruz County, AZ (pop. 47,669)
- Presidio County, TX (pop. 6,131)
- Apache County, AZ (pop. 66,021)
- Counties with over 80% of their total populations fully vaccinated have ~1.80 million residents, including the above plus:
- San Juan County, CO (pop. 705)
- West Feliciana Parish, LA (pop. 15,310)
- Teton County, WY (pop. 23,331)
- Rosebud County, MT (pop. 8,329)
- Menominee County, WI (pop. 4,255)
- Big Horn County, MT (pop. 13,124)
- Haines, AK (pop. 2,080)
- Webb County, TX (pop. 267,114) New!
- Mono County, CA (pop. 13,195) New!
- Marin County, CA (pop. 262,321) New!
- Montgomery County, MD (pop. 1,062,061) New!
- Summit County, UT (pop. 42,357) New!
- Pitkin County, CO (pop. 17,358) New!
- 114 Counties with 43.7 million residents have over 70% of their total populations fully vaccinated.
- At the opposite end, there's 11 counties which have vaccinated less than 20% of their total populations, with ~57,000 residents:
- Slope County, ND (Pop. 706)
- McPherson County, SD (Pop. 2,411)
- McCone County, MT (Pop. 1,729)
- McPherson County, NE (Pop. 399)
- Holmes County, OH (Pop. 44,223)
- Harding County, SD (Pop. 1,311)
- King County, TX (Pop. 265)
- Grant County, NE (Pop. 611)
- Arthur County, NE (Pop. 434)
- Storey County, NV (Pop. 4,104)
- Garfield County, MT (Pop. 1,173)
- Of counties with more than 100,000 residents, the following counties have vaccinated at least 75% of their total populations:
- Barnstable County, MA (pop. 228,996)
- Chittenden County, VT (pop. 168,323)
- Contra Costa County, CA (pop. 1,165,927)
- Cumberland County, ME (pop. 303,069)
- Dane County, WI (pop. 561,504)
- Howard County, MD (pop. 332,317)
- Imperial Couty, CA (pop. 179,703)
- Marin County, CA (pop. 262,321)
- Miami-Dade County, FL (pop. 2,701,767)**
- Middlesex County, CT (pop. 164,245)
- Montgomery County, MD (pop. 1,062,061)
- New York County, NY (Manhattan) (pop. 1,694,251)
- San Francisco County, CA (pop. 873,965)
- San Mateo County, CA (pop. 764,442)
- Santa Clara County, CA (pop. 1,936,259)
- Sumter County, FL (pop. 129,752)
- Webb County, TX (pop. 267,114)
**I find Miami-Dade's supposed vaccination rate highly suspicious based on their case rate since June, but whatever.
Of counties with more than 100,000 residents, the following counties have vaccinated less than 40% of their total populations:
- Anderson County, SC (pop. 203,718)
- Bartow County, GA (pop. 108,901)
- Bell County, TX (pop. 370,647)
- Berkeley County, WV (pop. 122,076)
- Bradley County, TN (pop. 108,620)
- Calcasieu Parish, LA (pop. 216,785)
- Canyon County, ID (pop. 231,105)
- Carroll County, GA (pop. 119,148)
- Ector County, TX (pop. 165,171)
- Elkhart County, IN (pop. 207,047)
- Etowah County, AL (pop. 103,436)
- Flathead County, MT (pop. 104,357)
- Harnett County, NC (pop. 133,568)
- Houston County, AL (pop. 107,202)
- Kootenai County, ID (pop. 171,362)
- Lee County, AL (pop. 174,241)
- Limestone County, AL (pop. 103,570)
- Livingston Parish, LA (pop. 142,282)
- Lowndes County, GA (pop. 118,251)
- Matanuska-Susitna, AK (pop. 107,081)
- Mohave County, AZ (pop. 213,267)
- Morgan County, AL (pop. 123,421)
- Muscogee County, GA (pop. 206,922)
- Paulding County, GA (pop. 168,661)
- Richland County, OH (pop. 124,936)
- Richmond County, GA (pop. 206,607)
- Rowan County, NC (pop. 146,875)
- Shelby County, AL (pop. 223,024)
- Tuscaloosa County, AL (pop. 227,036)
- Warren County, KY (pop. 134,554)
- There are 49 counties with more than 1 million residents. Of those, the highest-vaxxed is Montgomery County, MD (80.9% vaxxed) while the lowest-vaxxed is Wayne County, MI (home of Detroit), which has only vaccinated 48.2% of its population.
Advertisement
