

UPDATE: How much difference does population density & urban/rural status make re. vaccination levels?
Thu, 09/09/2021 - 4:38pm
Back in late July, I posted an analysis which looked at the COVID-19 vaccination rate across all 3,144 U.S. counties, parishes & boroughs by two additional criteria: Population Density and Urban/Rural Status.
As I noted at the time, it's reasonable to assume there might be a strong correlation by these criteria, since it's presumably a lot more difficult to get vaccinated if you live out in the middle of the boonies where the nearest hospital, clinic or pharmacy is 50 miles away or whatever...not to mention that if you're the only one for miles around, you might be less likely to see getting vaccinated as a high-priority task regardless of your ideology.
Therefore, the reasoning goes, instead of looking at the partisan lean of each county, it would make much more sense to see how much correlation there is based on population density or whether it's a more urban or rural region, right?
At the time, I figured this would be the case...but I was surprised to discover that...well, not so much. It turns out that there was almost no correlation between either a given county's urban/rural status or its population density and how likely the population is to be vaccinated against COVID-19.
HOWEVER...that was late July. It's now early September, and several things have changed since then:
- First, the U.S. Census Bureau released their official 2020 Census data for county populations
- Second, around 21 million more COVID-19 vaccine doses have been administered since then
- Third, the Delta variant has completely taken over as the dominant strain nationally
- Fourth, the FDA has given full authorization for the Pfizer vaccine (for those age 12+)
- Fifth, the FDA's green light has led to a slew of private businesses and public institutions imposing vaccination mandates
With all of this in mind, I've decided it's time to take another look at both of these metrics:
- FIRST, here's the fully-vaccinated percentages for the 3,144 U.S. counties in all 50 states +DC based on their overall population density...that is, the total number of residents per square mile. The population of each county is via the U.S. Census Bureau's 2019 estimates; the square mileage of each county comes from the U.S. Census Bureau's official 2020 Census results. (note: I had to use a logarithmic scale on the graph in order to fit every county in, since Manhattan (74,368 residents per square mile) has a population density over 2 MILLION TIMES as high as the Yukon-Koyukuk area of Alaska (0.036/sq. mile):
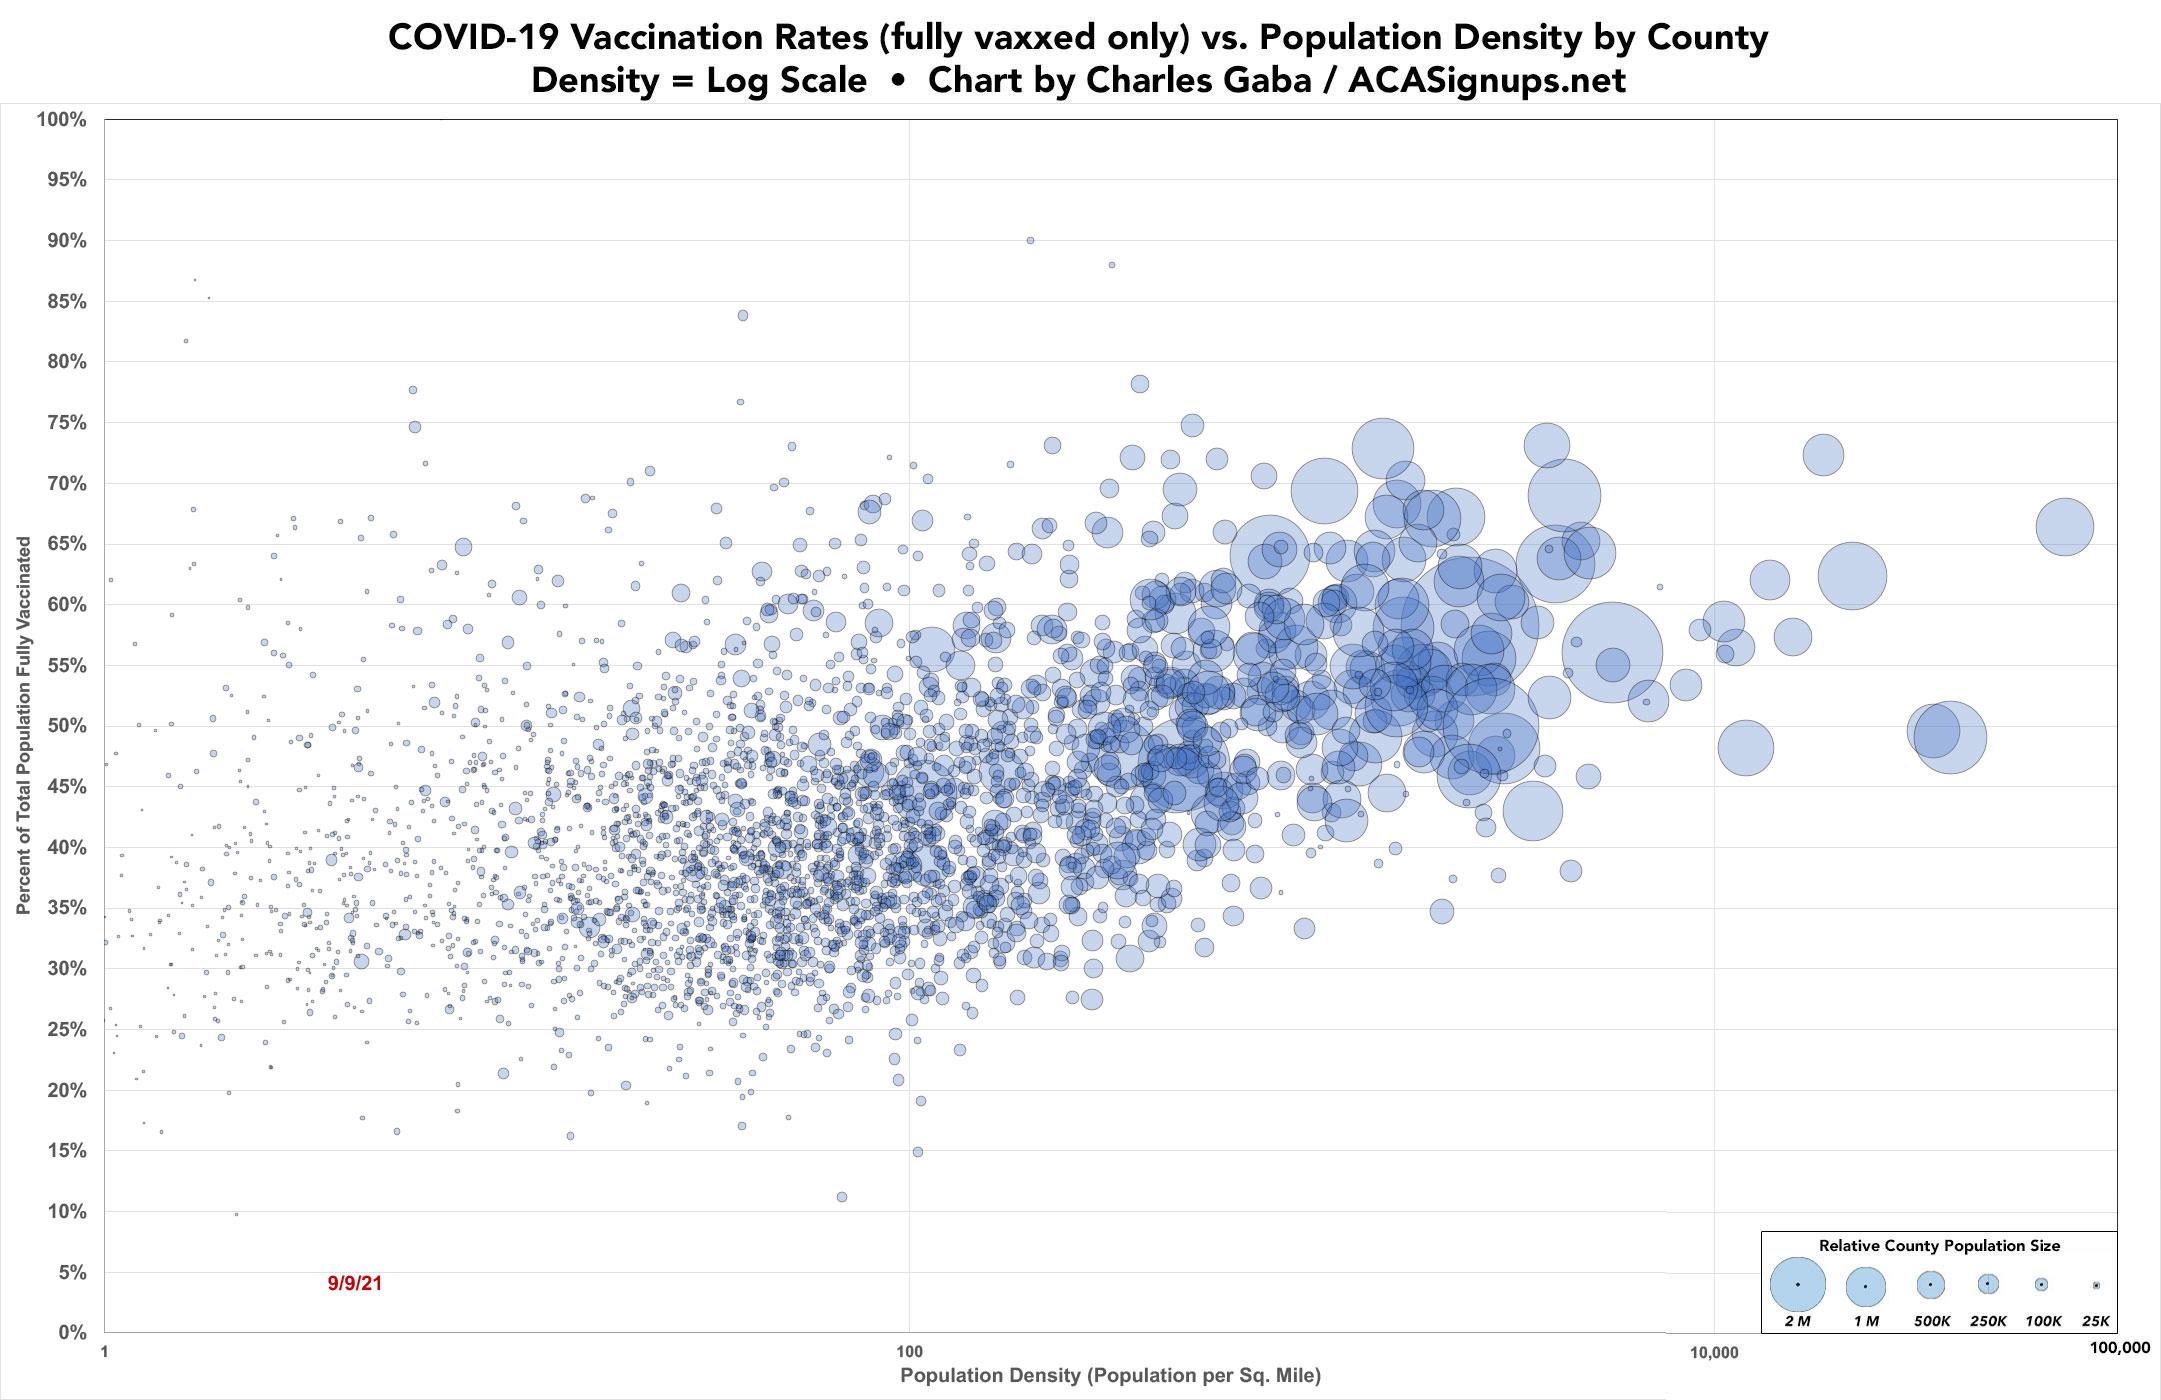
Huh. As you can see, while there's a slight correlation as population density increases, it's pretty weak tea. Not only is the R^2 very low, even the slope is extremely slight. Remember, this is a logarithmic scale--on a linear graph, the right edge of the it would extend to the opposite end of my house.
- NEXT, I looked at the same data a different way: I used the 2013 USDA Economic Research Service's Rural-Urban Continuum Codes:
The 2013 Rural-Urban Continuum Codes form a classification scheme that distinguishes metropolitan counties by the population size of their metro area, and nonmetropolitan counties by degree of urbanization and adjacency to a metro area. The official Office of Management and Budget (OMB) metro and nonmetro categories have been subdivided into three metro and six nonmetro categories. Each county in the U.S., municipio in Puerto Rico, and Census Bureau-designated county-equivalent area of the Virgin Islands/other inhabited island territories of the U.S. is assigned one of the 9 codes.
This scheme allows researchers to break county data into finer residential groups, beyond metro and nonmetro, particularly for the analysis of trends in nonmetro areas that are related to population density and metro influence. The Rural-Urban Continuum Codes were originally developed in 1974. They have been updated each decennial since (1983, 1993, 2003, 2013), and slightly revised in 1988. Note that the 2013 Rural-Urban Continuum Codes are not directly comparable with the codes prior to 2000 because of the new methodology used in developing the 2000 metropolitan areas. See the Documentation for details and a map of the codes.
An update of the Rural-Urban Continuum Codes is planned for mid-2023.
OK, so the data is a bit out of date, but it's the best I can do for now. Again, they've fit all 3,144 counties into one of 9 urban/rural categories. From left to right, these are:
- Metro - Counties in metro areas of 1 million population or more
- Metro - Counties in metro areas of 250,000 to 1 million population
- Metro - Counties in metro areas of fewer than 250,000 population
- Nonmetro - Urban population of 20,000 or more, adjacent to a metro area
- Nonmetro - Urban population of 20,000 or more, not adjacent to a metro area
- Nonmetro - Urban population of 2,500 to 19,999, adjacent to a metro area
- Nonmetro - Urban population of 2,500 to 19,999, not adjacent to a metro area
- Nonmetro - Completely rural or less than 2,500 urban population, adjacent to a metro area
- Nonmetro - Completely rural or less than 2,500 urban population, not adjacent to a metro area
It's important to note that a county being categorized as #1 does not mean the county has more than a million residents (only around 40 or so counties have hit the 1M+ threshold). It just means that the county is located within a metropolitan area which has at least a million people.
Here's what that looks like:
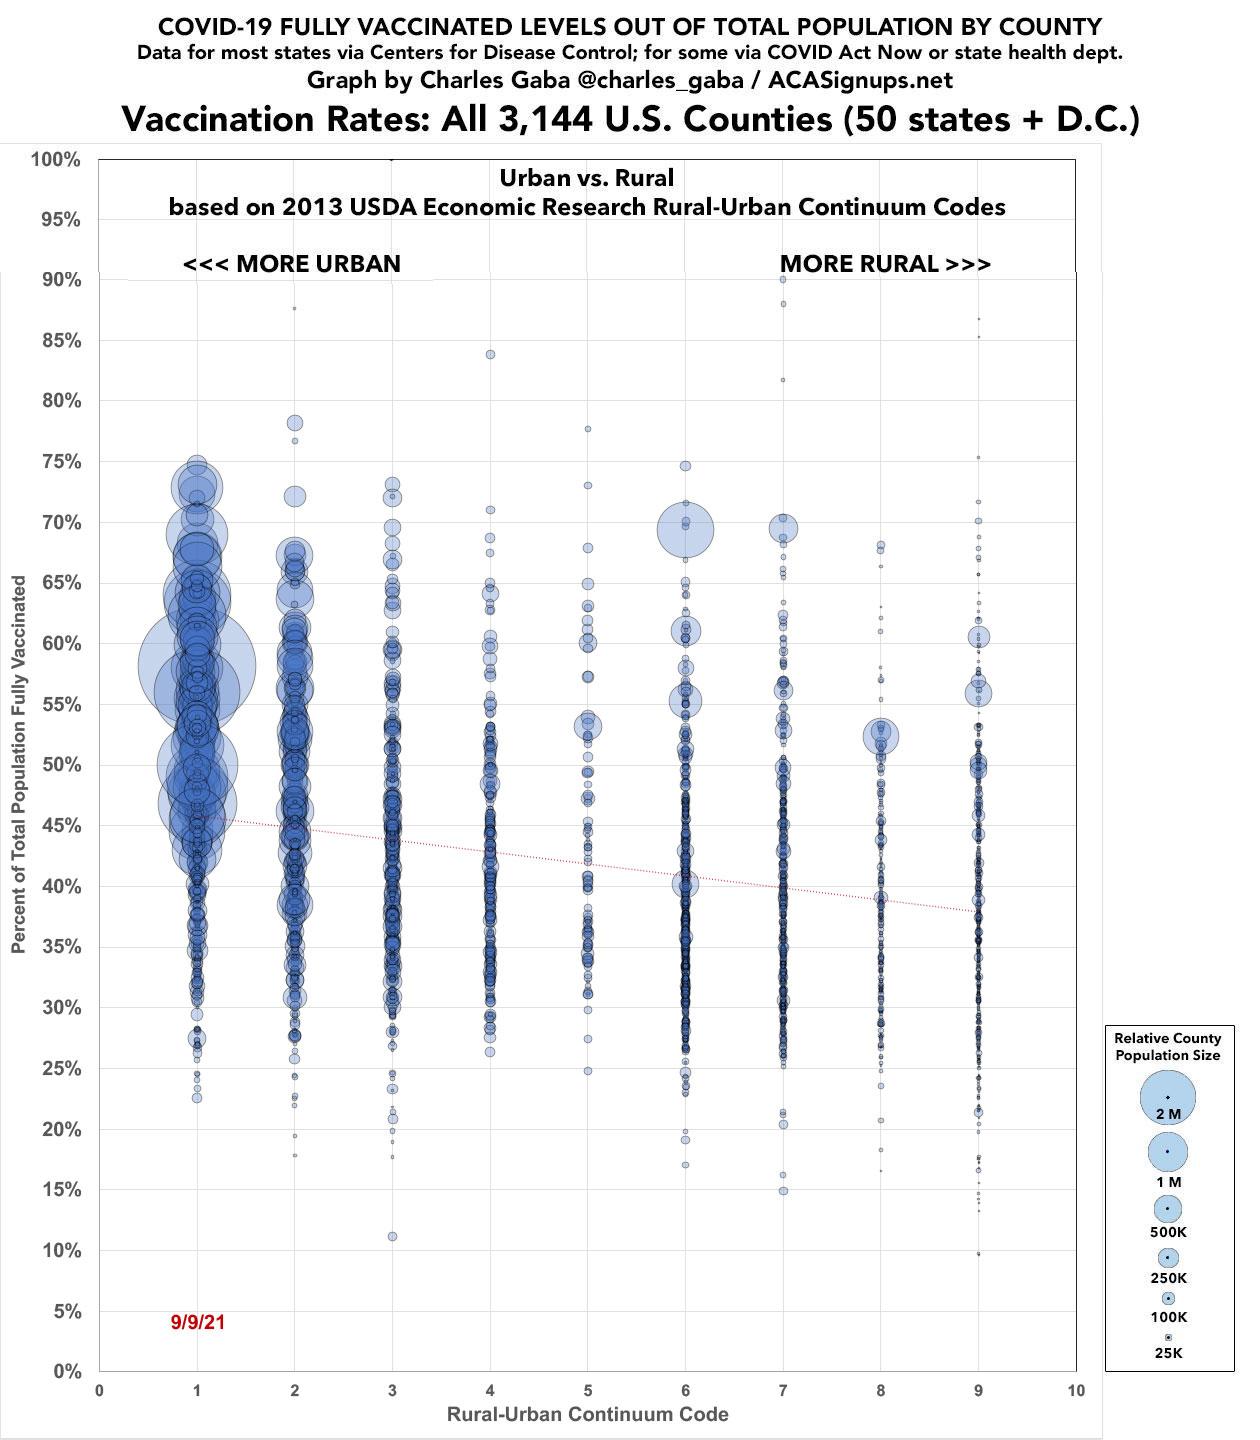
Again, there's a slight correlation as you move from more urban/metro counties to more rural/non-metro counties...but it looks pretty weak to me.
Put another way, here's the average vaccination levels of the counties in all 9 categories:
- Metro (452 counties): 178.9 million people, 54.3% fully vaxxed
- Metro (389 counties): 67.9 million people, 49.6% fully vaxxed
- Metro (360 counties): 27.7 million people, 44.5% fully vaxxed
- Nonmetro (215 counties): 13.3 million people, 43.2% fully vaxxed
- Nonmetro (88 counties): 5.0 million people, 45.8% fully vaxxed
- Nonmetro (592 counties): 20.0 million people, 44.8% fully vaxxed
- Nonmetro (415 counties): 9.8 million people, 43.6% fully vaxxed
- Nonmetro (215 counties): 3.9 million people, 44.8% fully vaxxed
- Nonmetro (417 counties): 5.0 million people, 45.0% fully vaxxed
As you can see, while the first two categories clearly have the highest vaccination levels, after that it jumps around within a range of 43.2% - 45.8% vaccinated. So yeah, it makes some difference...but not that much. Note that the range from the highest to lowest vaccination levels for all 9 categories is only 11.1 points.
Advertisement
