

Weekly Update: U.S. #COVID19 vaccination levels BY COUNTY & Partisan Lean (now w/2020 Census data!)
Tue, 08/17/2021 - 10:09pm
This week brings a major change...which actually doesn't change things that much, at least for the big picture.
With the U.S. Census Bureau finally releasing the official county-level results of the 2020 Census, I've updated the graph to include the official April 2020 populations for every county, parish borough and census area in the 50 United States + the District of Columbia (along with the U.S. territories), as opposed to the Census Bureau's July 2019 estimated populations which I had been using until now.
For most counties/etc. this only makes a minor difference one way or the other; in 2,656 out of 3,114 (over 85% of them), the difference is less than 5% higher or lower.
However, there's 153 counties where the official 2020 population is at least 5% higher than what I had. In fact there's 26 counties where the Census Bureau has the population down as more than 10% higher. There's even 4 counties where it's 25% higher or more.
The biggest discrepancy in this direction is Harding County, NM, where the actual population (657) is a whopping 49% higher than the 2019 estimate (441).
On the flip side, there's 305 counties where the official population is at least 5% lower than the 2019 estimates; 85 of which are at least 10% lower (Texas, Missouri, Georgia and South Dakota seem to comprise most of these), and 3 counties where it's at least 25% lower.
The biggest discrepancy in this direction is the smallest county in the nation: Loving County, TX, where the actual population is just 64 people vs. the 169 I previously had it listed at.
As a result, the county-level vaccination rate graph looks very different for many of these as individual counties. Los Alamos County, NM, for instance, which I thought was over 85% fully vaccinated turnst out to only be around 65% vaxxed.
In terms of the overall picture, however, this has makes almost no difference whatsoever, as you'll see below (I'm including 2 graphs based on the 2019 estimated populations and the 2020 Census populations for comparison).
Methodology reminders:
- For my county-level vaccination rate graphs, I go by FULLY vaccinated only (2 doses of the Pfizer or Moderna vaccine or one dose of the Johnson & Johnson vaccine).
- I base my percentages on the total population, as opposed to adults only or those over 11 years old.
- For 42 states + DC I use the daily data from the Centers for Disease Control, but there are some where the CDC is either missing county-level data entirely or where the CDC data is less than 90% complete at the county level. Therefore:
- For Hawaii, Vermont, Virginia and West Virginia, I'm using data from the COVID Act Now Risk & Vaccine Tracker database.
- For Colorado, Georgia, New Mexico and Texas, I'm using their COVID vaccine dashboards set up by the state health departments.
- For California, I'm using the CDC data for most counties and the state health dept. dashboard data for the 8 small counties which the CDC isn't allowed to post data for.
- For Massachusetts, I'm using the CDC data for most counties but this municipality-level data for Barnstable, Dukes & Nantucket counties, which the CDC only has partial data for.
- The 5 major U.S. territories don't vote for President in the general election, preventing me from displaying them in the main graph, but I have them listed down the right side.
With this in mind, here's what it looks like using the 2019 estimated populations, as I have been until now:
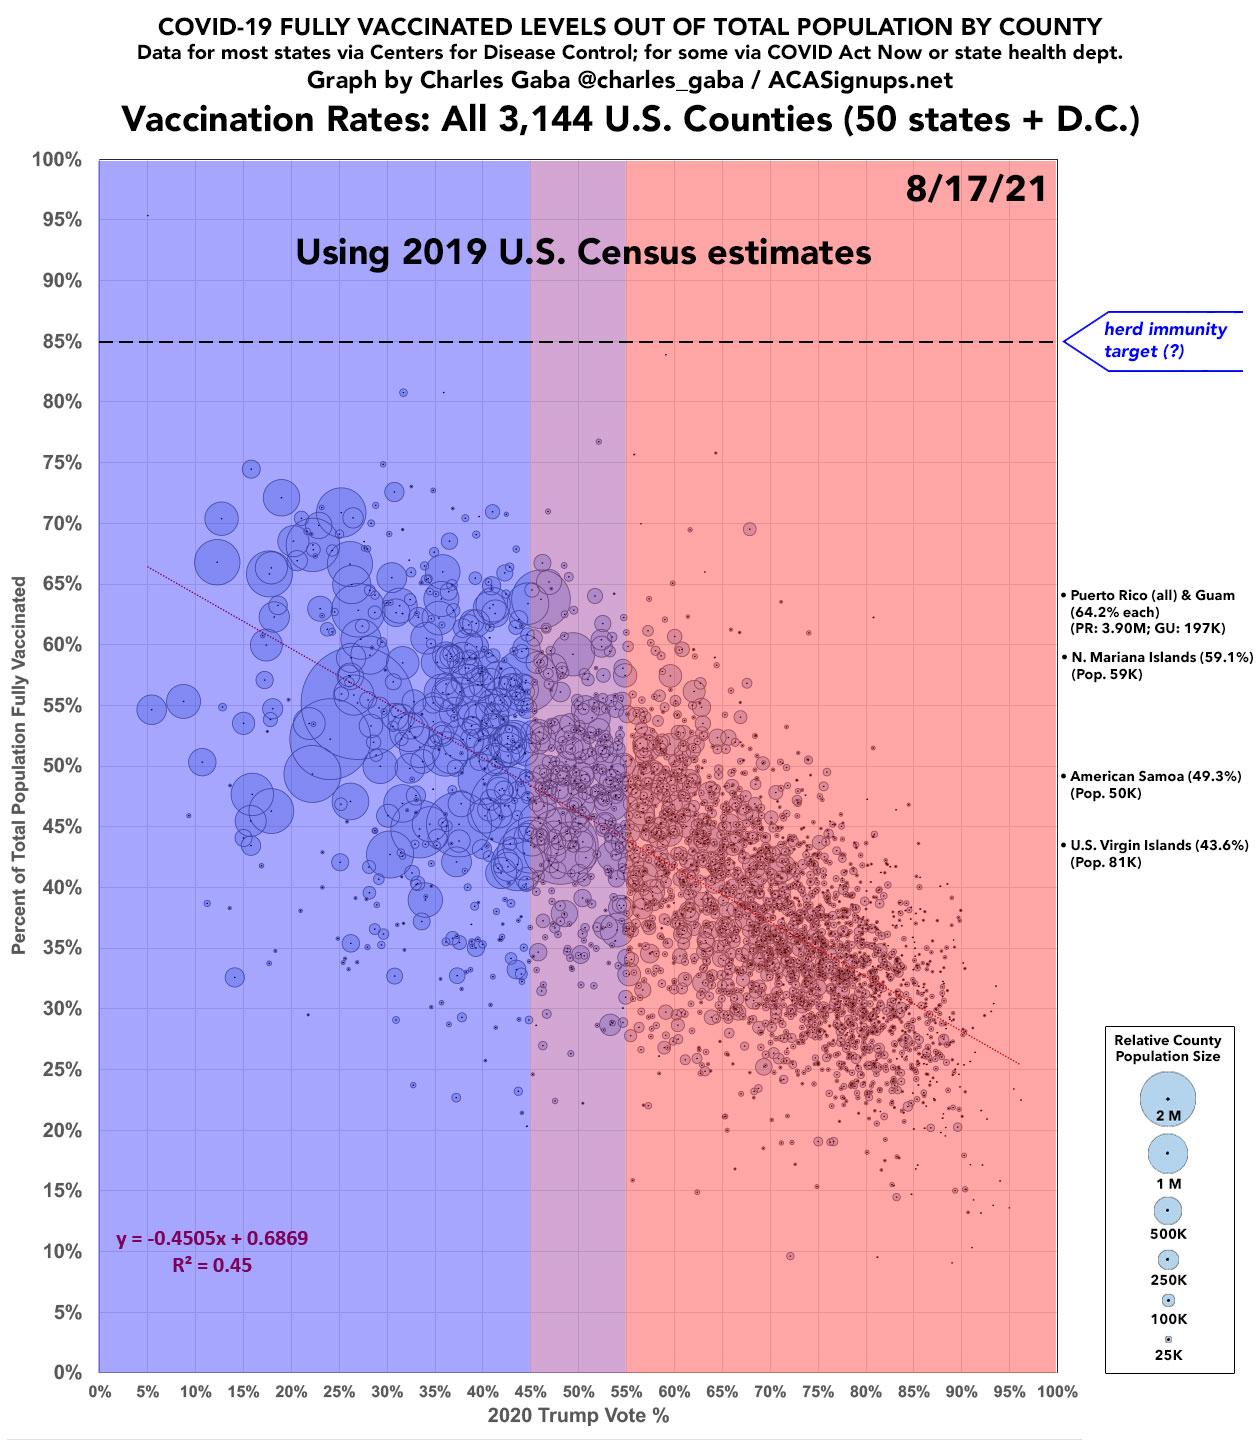
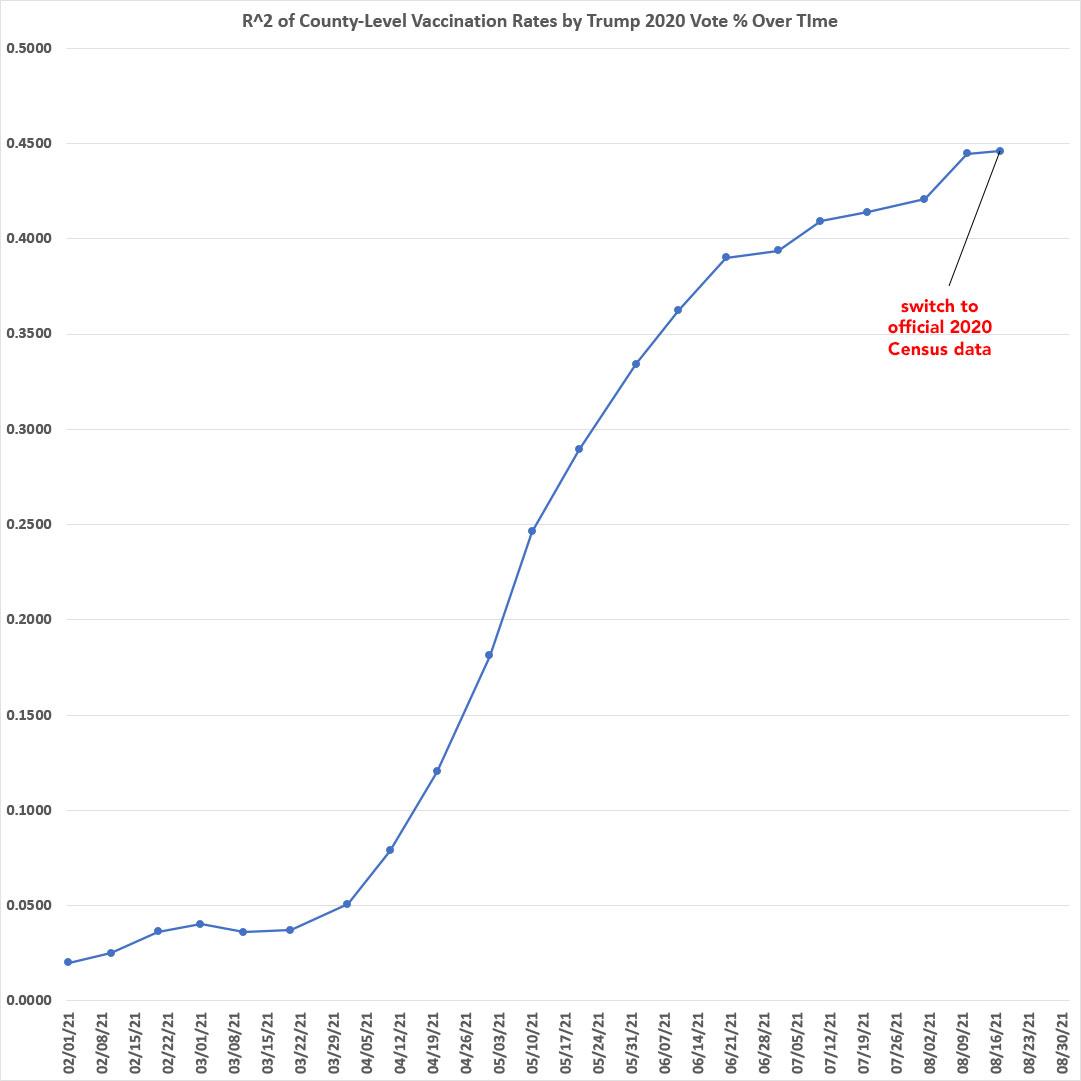
Note that using the 2019 estimated populations, the R^2 continued to increase slightly while the slope actually dropped ever so slightly:
- R^2 went from 0.4447 on 8/10 to 0.4500 on 8/17
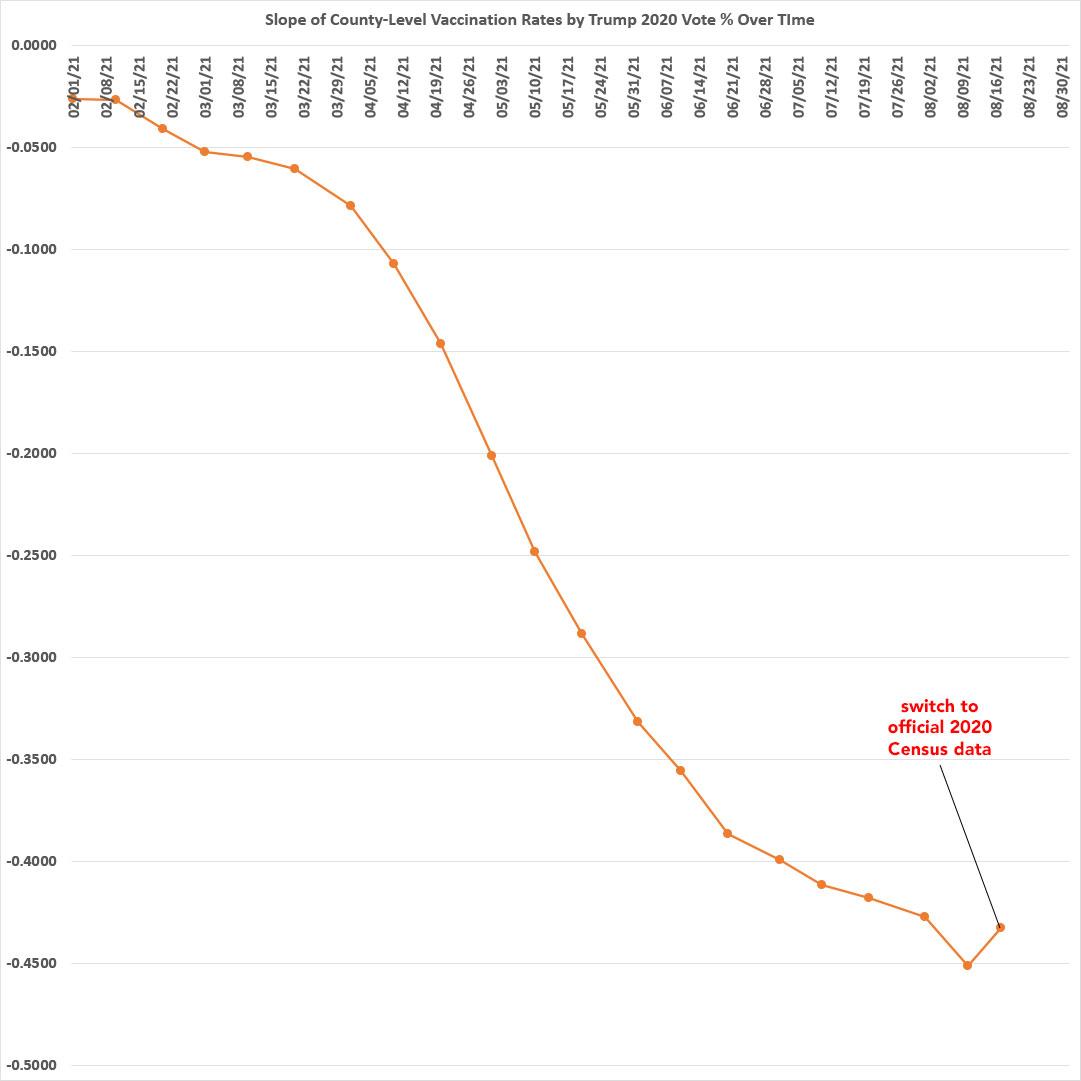
- Slope went from -0.4515 on 8/10 to -0.4505 on 8/17
Next, let's look at the same graph using the official 2020 U.S. Census Bureau data, which is what I plan on using going forward:
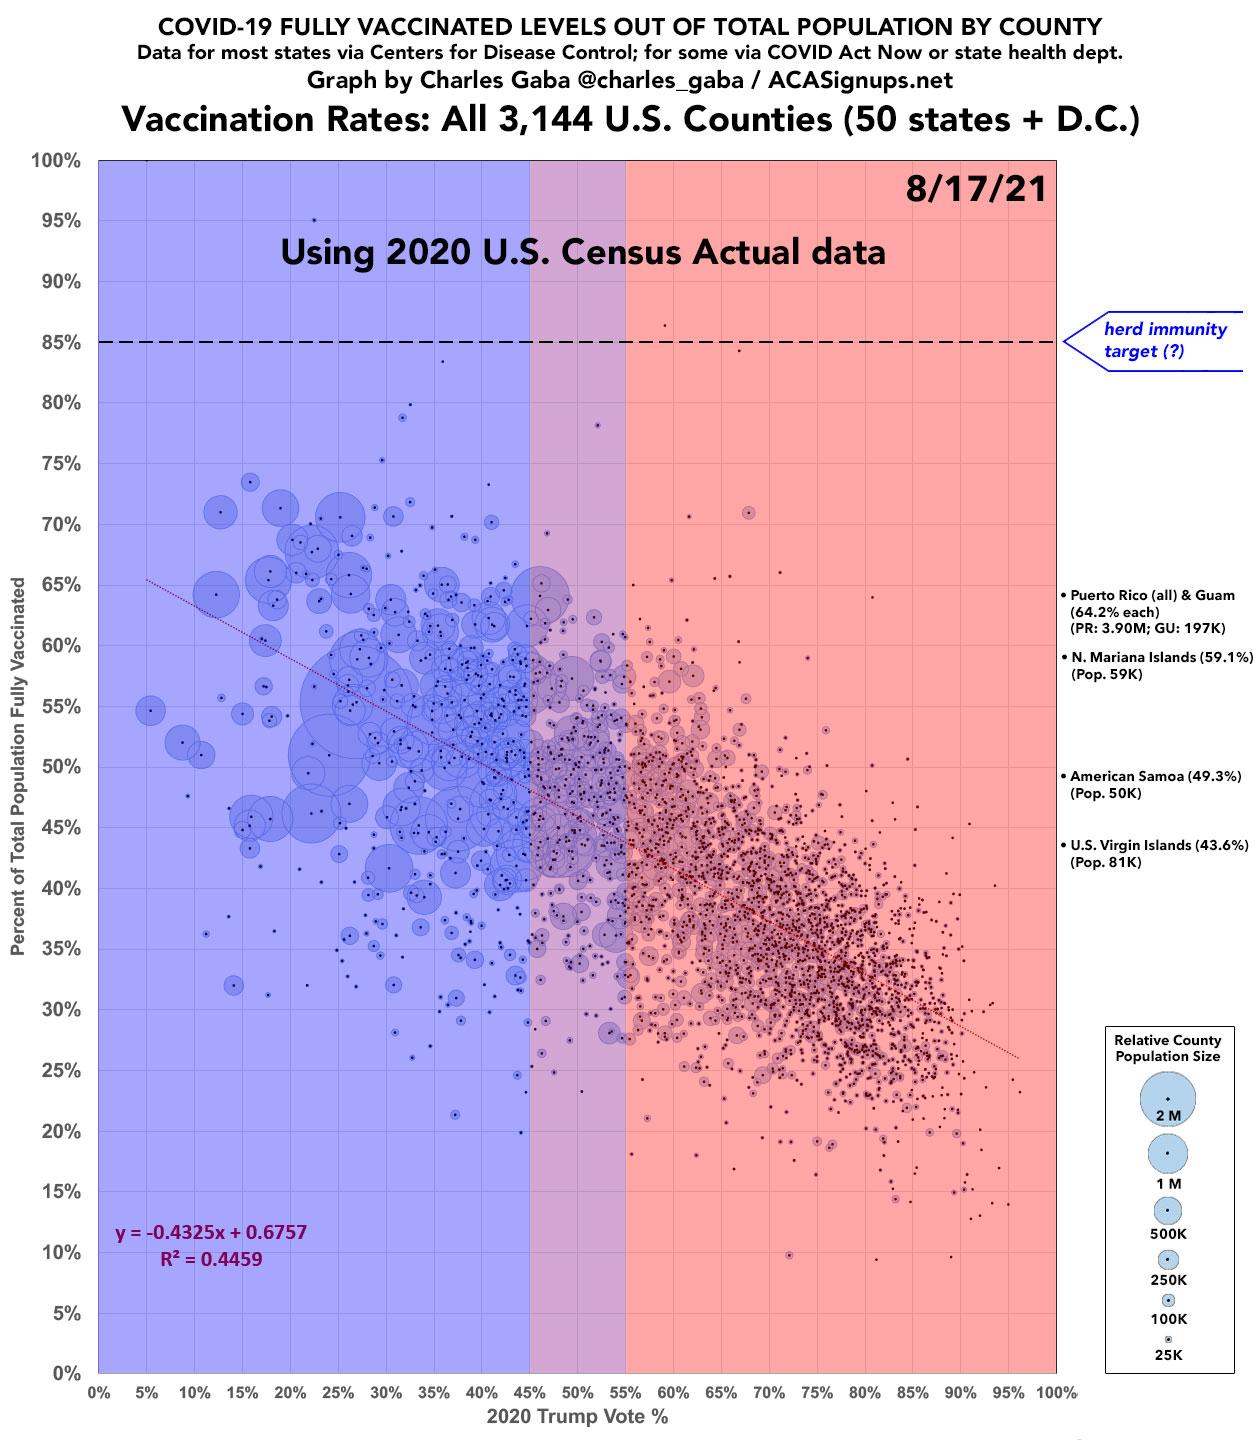
With the one-time correcation to the updated population data, the R^2 continues to increase (from 0.4447 to 0.4459) over the past week, while the slope drops slightly (from -0.4515 to -0.4325):
We'll see what happens going forward, of course, but my suspicion is that with the one-time correction out of the way, both of these figures will resume increasing a bit every week. Stay tuned...
Other things especially worth noting given the update to the official 2020 Census data:
- Kalawao County, HI (pop. corrected from 86 to 82) is still the only one which is 100% vaccinated.
- As noted above, Los Alamos, NM has fallen way out of the top-vaccinated list; this leaves Bristol Bay Borough, AK (pop. 844) in the #2 spot.
-
Hudspeth County, TX is one of the counties where the Census Bureau puts their 2020 population much lower than I thought (3,202 vs. 4,886). This means their vaccination rate is much higher than previously estimated: 84.3% vs. 55.2%. Huh.
Note that I'll be double-checking the official 2020 Census numbers for some of these going forward, since there's some massive differences in a few counties.
- At the opposite end, not much has changed: There's still 3 counties below 10% fully vaccinated, and they're the same ones I've noted before (McPherson County, SD; Slope County, ND and Miller County, AR. None of their populations were off by more than a few percent. The fourth one (McPherson County, NE) jumped to 12.8% vaccinated, however, as their population appears to be just 399 people vs. 494.
- Of counties with more than 100,000 residents, the top-vaxxed is Marin County, CA (73.5% vaxxed); Montgomery County, MD (71.3%); and San Francisco, CA (71.0% vaxxed)
- Of counties with more than 100,000 residents, the least-vaxxed are Shelby and Limestone Counties, AL, neither of which has vaccinated more than 25% of their total populations.
- There are 49 counties with more than 1 million residents. Of those, the highest-vaxxed is (again) Montgomery County, MD (71.3% vaxxed) while the lowest-vaxxed is Wayne County, MI (home of Detroit), which has only vaccinated 41.7% of its population.
Advertisement
