

Alaska: #COVID19 vaccination rates by borough/census area & partisan lean
Fri, 05/21/2021 - 11:21am
IMPORTANT UPDATE: It turns out I had Alaska's "boroughs" and "census areas" (not counties) completely botched in several ways. On top of having some names/populations wrong, it also turns out that one of the "census areas" doesn't even exist anymore...it was abolished and split into two new census areas.
The entire post and graphs below have been updated/corrected to reflect this.
UPDATE 6/03/21: I've updated the graphs and table below and am not using fully-vaccinated residents only in order to make Alaska consistent with every other state.
It's also worth noting that the CDC says around 2.9% of all fully vaccinated AK residents (7,900 people) have an unknown home borough/area.
Now that I've developed a standardized format/layout & methodology for tracking both state- and county-level COVID vaccination levels by partisan lean (which can also be easily applied to other variables like education level, median income, population density, ethnicity, etc), I've started moving beyond my home state of Michigan.
Here's Alaska.
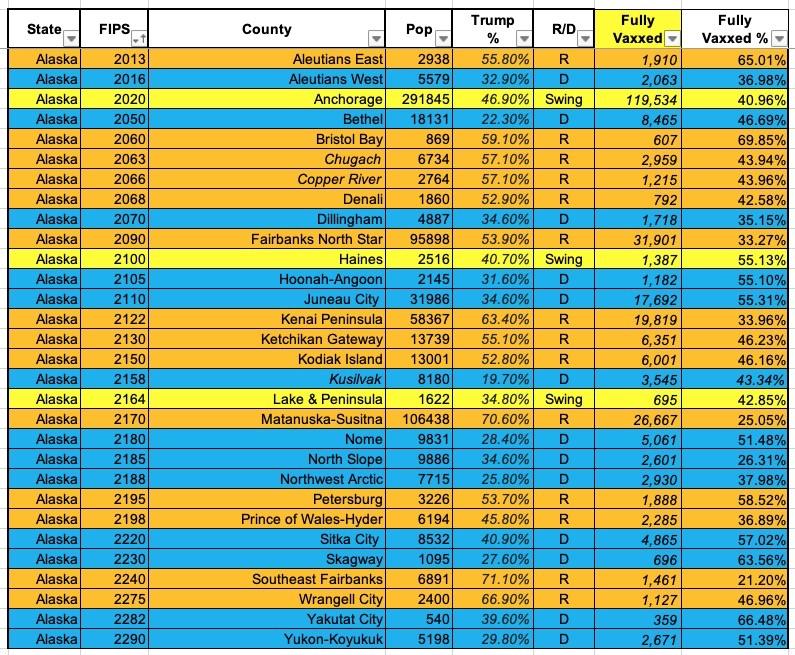
- 2016 Presidential Election results via RRH Elections (estimate based on analysis of precinct & AK House District data)
- Total fully-vaccinated residents via the Centers for Disease Control
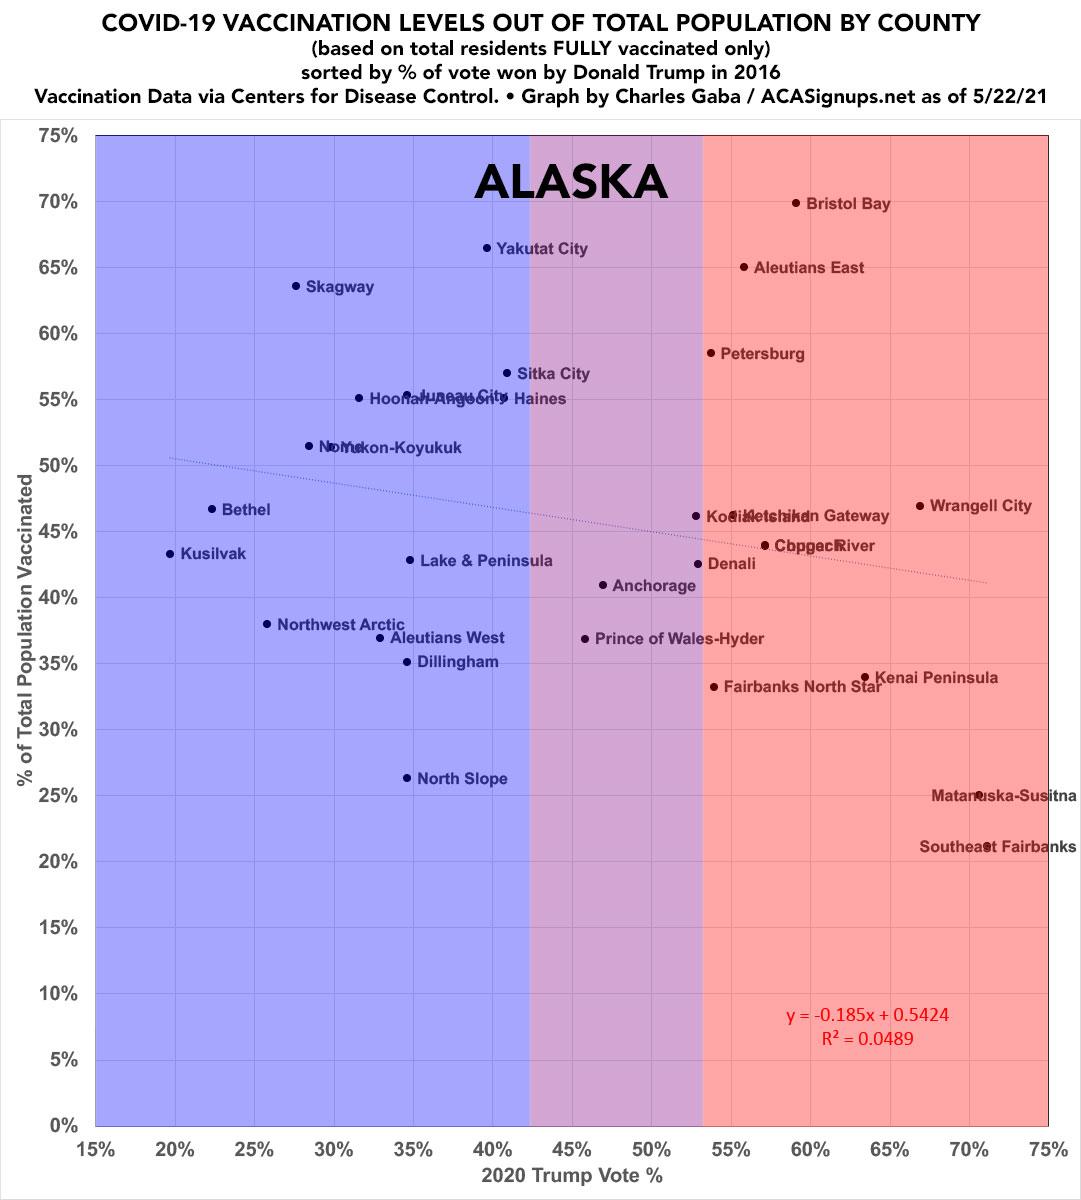
Alaska is the first state I've found where there really doesn't appear to be any correlation between partisan lean and vaccination rates. However, there's a couple of caveats which may or may not make a difference:
- As noted above, the Trump support data comes from 2016 instead of 2020; I don't think it changed all that much from one to the other, but it's possible.
- Even then, RRH Elections warns that:
Unlike the other 49 states, Alaska usually doesn’t report its election results by counties. That’s not because Alaska doesn’t have counties – they’re called Boroughs, with the Unorganized Borough broken up by the U.S. Census Bureau into component Census Areas. Instead, Alaska traditionally reports its election day results by precinct and its absentee, question and early votes by House District. Because Alaska House Districts are redistricted every 10 years (or sometimes even more often), this does not allow for easy analysis of trends between cycles. For example, even the 2012 HD map is different from the 2016 HD map due to a successful legal challenge to the 2012 map – which makes trend analysis difficult.
To make matters worse, as I stated above, absentee, question and early votes are only reported by HD, which often cross county equivalent lines (even a few precincts do, but quite often, very few people actually live in the part outside of the main county equivalent). Thus, every estimate of the total vote by HD is just that – an estimate.
- Unlike most other states, for Alaska I only have data for the number of residents fully vaccinated; this doesn't include those who've received their first shots only...except for Kusilvak, where I was only able to find "first shot" data, and that comes from the AK Health Dept. COVID vaccine dashboard, not the CDC.
- The Valdez-Cordova Census Area doesn't even exist anymore; apparently it was split into two new Census Areas called Chugach and Copper River. I'm assuming the vaccination split is roughly equivalent to their population split (thus giving them identical vaccination percentages), but I could be wrong.
Other than Kusilvak and Chugach/Copper River, I think I have it correct.
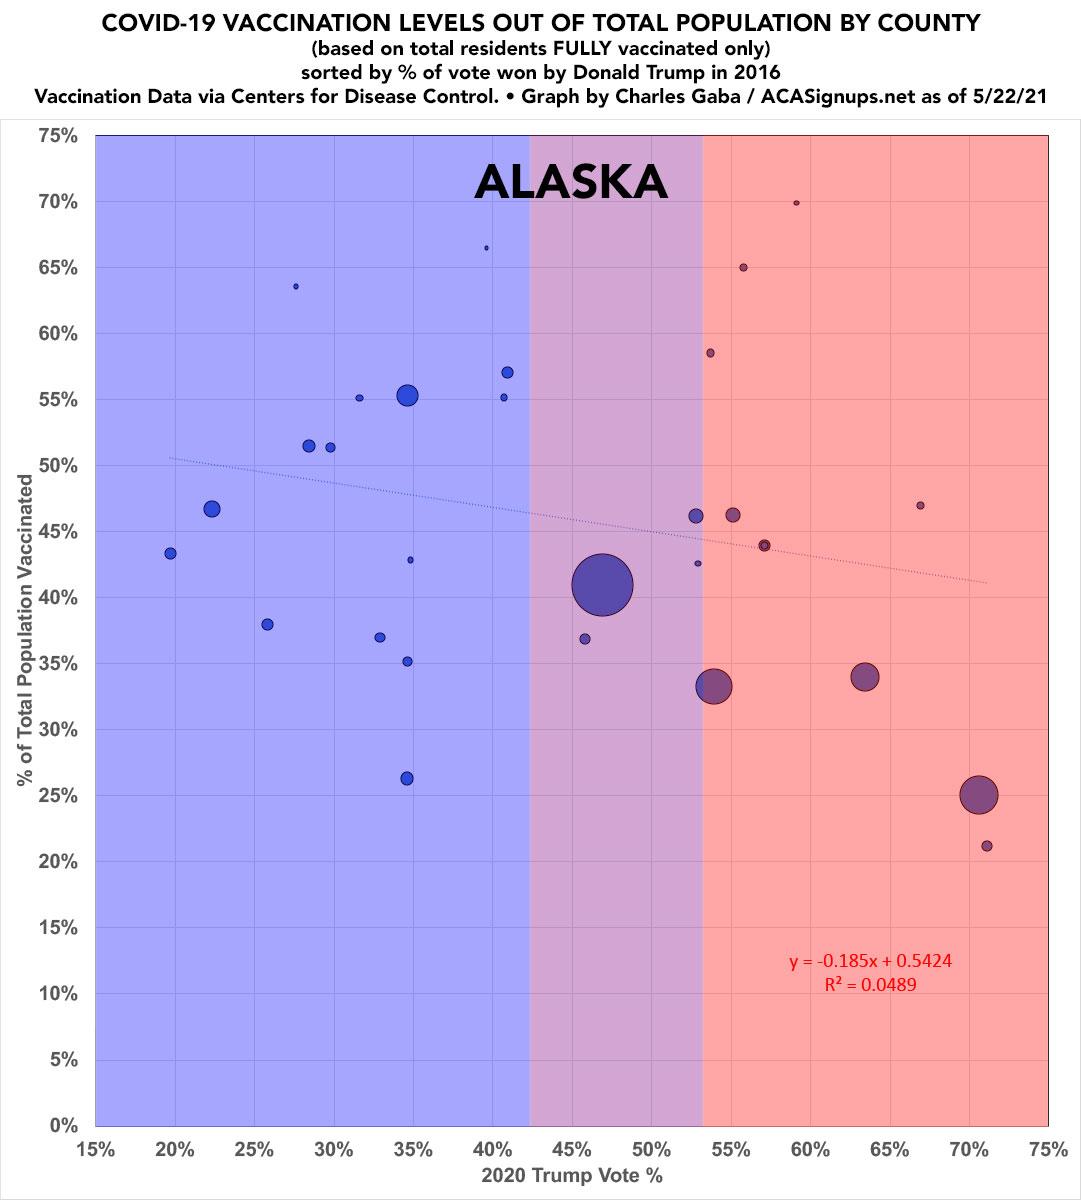
UPDATE: A Twitter follower of mine from Alaska, Cornell University professor Kim Weeden (who also called attention to my data errors), plugged my data into more advanced statistics software to weigh the results by county population size, and apparently it makes a huge difference:
I tweeted the AK results. Weighting makes a big difference – R2 increases to 0.45 – because of all those dinky census areas compared with the size of the boroughs containing Fairbanks, Anchorage, and the Mat-Su Valley. Alaska is often problematic in state- or county equivalent-level analyses because of this. Plus, Alaska is just an outlier, demographically: e.g., it has the highest share of Native Americans of any state while also having one of the lowest shares of Black Americans, the population is heavily skewed toward men, it has a relatively young population because no one moves to Alaska to retire, the population tends to be quite transient, and so on.
Advertisement
