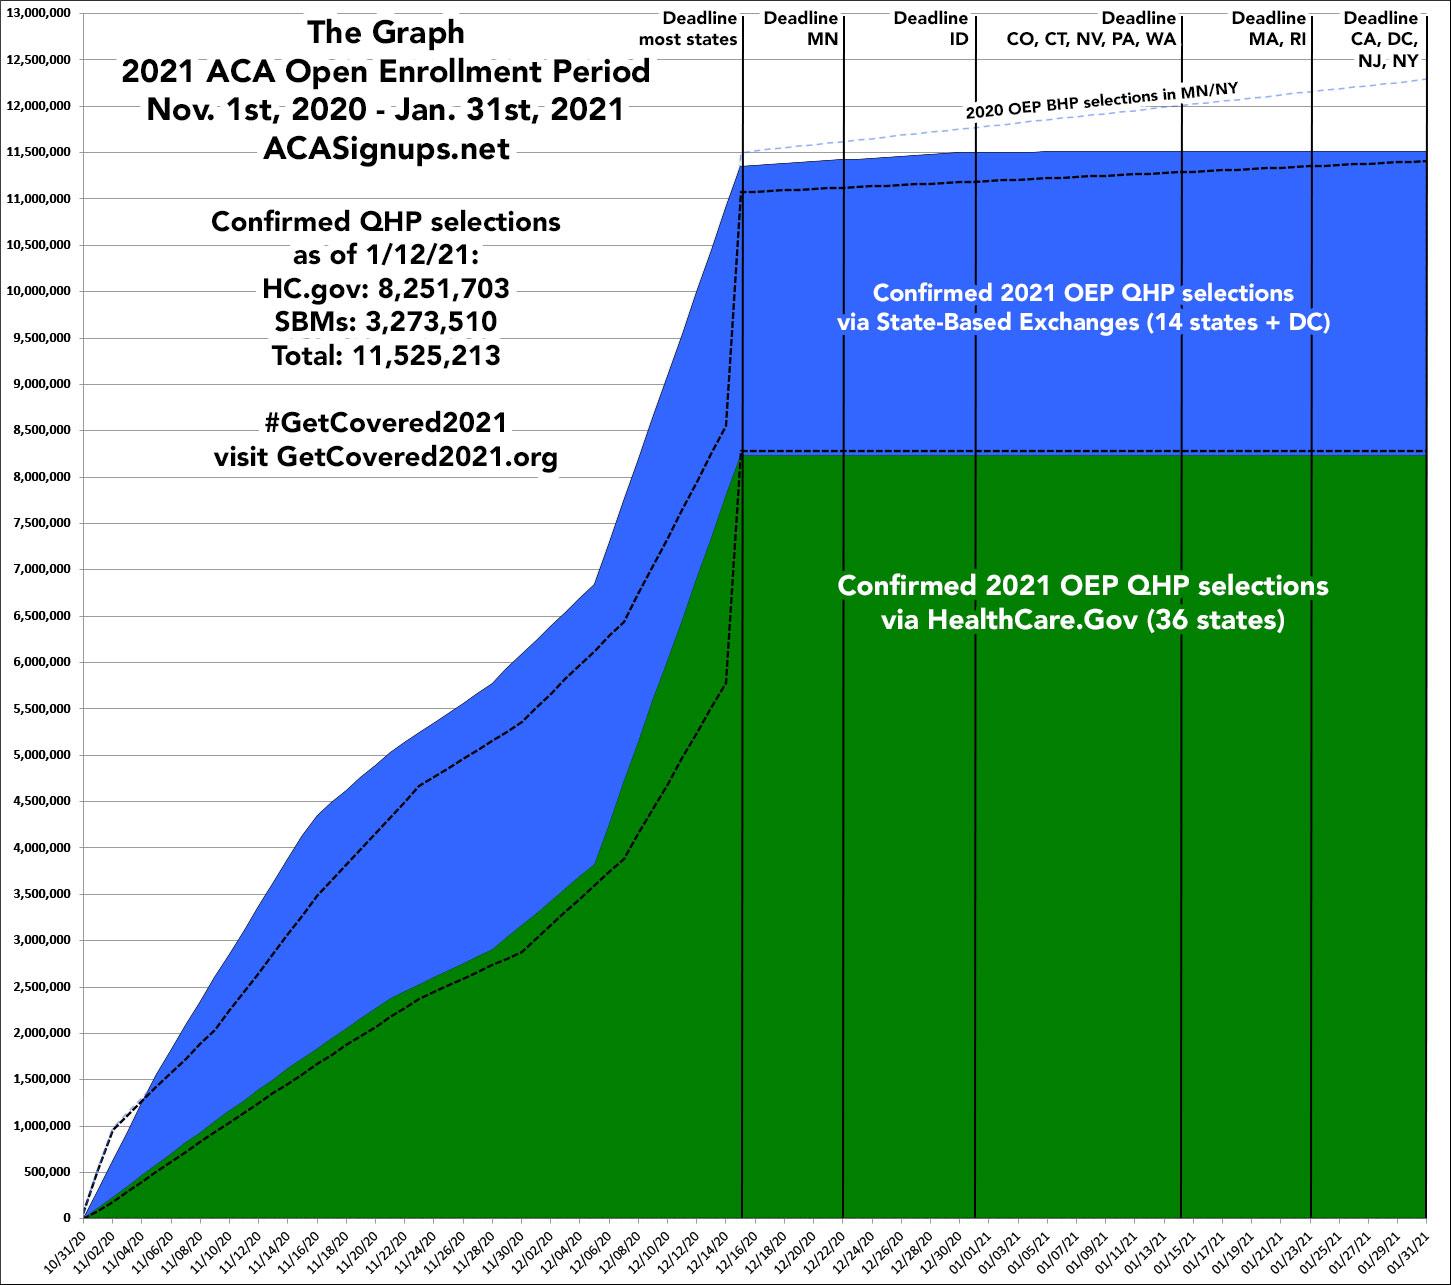
The Graph: 11.5 million QHPs confirmed nationally; will likely break 12.0M by 1/31; still time to #GetCovered in 12 states!
Way back in October 2013, I launched the ACA Signups project as a light, nerdy hobby thing which was only supposed to last around six months, through the end of the first ACA Open Enrollment Period (March 31, 2014). Instead...well, let's just say that it's more than seven years later and I'm still doing this.
The reality is that The Graph itself doesn't serve a whole lot of useful function anymore. The enrollment patterns were erratic the first couple of years but have since settled into a pretty predictable...if not downright boring pattern for both the federal and state exchanges. The main reason I keep doing it each year is mostly out of tradition these days; after all, without The Graph, there wouldn't be an ACA Signups and I wouldn't have become a healthcare policy wonk in the first place.
Still, The Graph remains a fun way of visualizing ACA Open Enrollment trends. Again, the dotted lines show last year's enrollment patterns for HealthCare.Gov, the 13 state-based exchanges (SBE) and BHP enrollments in Minnesota & New York. This year the lines will shift slightly due to Pennsylvania and New Jersey splitting off onto their own state-based exchanges, but the final totals will likely be similar...or perhaps not!
On the one hand, the COVID-19 pandemic is likely spurring more people into making sure they #GetCovered. On the other hand, the Trump/GOP lawsuit to strike down the ACA might be scaring some people off...or perhaps it's spurring them into action as well? Finally, the Trump Administration has basically abandoned any effort to get people to sign up...but 3rd-party organizations/coalitions like Get America Covered and Get Covered 2021 have sprung up to fill in the gap, so who knows?
The Centers for Medicare & Medicaid has released the semifinal "snapshot report" for HealthCare.Gov enrollment, and most of the state-based exchanges have released at least some of their enrollment data. With the addition of today's announcement by Covered California, I've confirmed 11.51 million QHP selections to date.
Keep in mind, however, that there's likely over 400,000 more enrollees across the states which haven't reported anything yet (Idaho, New York, Rhode Island and Vermont), so the actual total nationwide is likely closer to 11.9 million, give or take. In addition, Open Enrollment is still ongoing across a dozen states, so the final total will almost certainly break 12 million when the dust settles after the final January 31st deadline passes.
It could even total as much as 12.2 million, assuming the following:
- 11.51M confirmed to date
- CA: Assume ~160K more than reported so far
- CO: Assume ~5K more
- CT: Assume ~5K more
- DC: Assume ~1K more
- ID: Assume ~80K
- MD: Assume ~4K more*
- MA: Assume ~40K more
- NV: Assume ~3K more
- NY: Assume ~285K
- PA: Assume ~15K more
- RI: Assume ~35K
- VT: Assume ~25K
- WA: Assume ~5K more**
*Note re. Maryland: I'm not sure whether the official CMS 2021 OEP report will include MD's recently re-opened COVID-19 SEP or not, since it overlaps with some state OEP time windows.
**1/13/21: Washington State made a minor update, increasing their total by 3,000 enrollees with 3 days left to go.
This would bring the grand total in at around 12.17 million, give or take. If so, that would be the 3rd highest ACA QHP selection total, just below 2017's 12.22 million. It's even conceivable it could break that and come in second after 2016's high water mark of 12.68 million:
How to support my healthcare wonkery:
1. Donate via ActBlue or PayPal
2. Subscribe via Substack.
3. Subscribe via Patreon.


